Pea Grits Market Report - Market Forecast and Outlook (2025-2035)

The pea grits market is projected to rise from USD 1.0 million in 2025 to USD 1.7 million by 2035, reflecting an absolute increase of USD 0.7 million during the assessment period. This translates into a CAGR of 5.8%, highlighting a steady growth trajectory supported by evolving dietary preferences, expansion in plant-based ingredients, and the use of pea derivatives in multiple processing industries. The market size, although niche compared with staple commodities, is advancing as pea grits secure applications in functional food formulations, bakery blends, and snack production, driven by their protein density, fiber enrichment, and gluten-free positioning.

On the demand side, food processors are incorporating pea grits into cereals, porridges, extruded snacks, and fortified bakery goods to meet rising consumer interest in alternative protein sources. The clean-label trend has elevated demand for minimally processed ingredients, and pea grits are finding a role as natural texturizers and nutritional enhancers. Their compatibility with both conventional and plant-based recipes makes them attractive to food manufacturers seeking diversification of product portfolios. Pharmaceutical and nutraceutical sectors are also exploring pea grit fractions for use in controlled formulations due to their stability and digestibility, adding further momentum to demand expansion.

Supply-side dynamics are influenced by pulse cultivation patterns and milling infrastructure. Regions with strong pea production bases, such as Europe and North America, dominate the availability of high-quality pea grits. The supply chain remains moderately concentrated, as milling facilities capable of producing consistent grit fractions are fewer compared to flour or protein isolate processors. This concentration creates sensitivity to harvest volatility and trade fluctuations, as variations in pea yields directly affect raw material availability. Efficient processing technology and controlled sourcing from pulse cooperatives are becoming critical to ensuring reliable supply.

Production scalability is another consideration, as pea grit manufacturing requires precision milling to maintain uniform particle size and functional properties. Investments in advanced milling equipment and integrated processing lines are being undertaken by established players to optimize output and maintain cost competitiveness. Smaller producers remain challenged by capital intensity and operational efficiency, which limits broader market participation. Product innovation, such as flavored or fortified pea grits for direct consumer use, represents a growing area of production focus, enabling differentiation and value capture.

Quick Stats for Pea Grits Market

  • Pea Grits Market Value (2025): USD 1 million
  • Pea Grits Market Forecast Value (2035): USD 1.7 million
  • Pea Grits Market Forecast CAGR: 5.80%
  • Leading Product Type in Pea Grits Market: Green Pea Grits
  • Key Growth Regions in Pea Grits Market: Asia Pacific, North America, and Europe
  • Top Key Players in Pea Grits Market: Martino Rossi SpA, Avena Foods Limited, Best Cooking Pulses Inc., ADM, Ingredion
  • Where Revenue Comes From - Now vs Next (Industry-Level View)
Period Primary Revenue Buckets Share Notes
Today Food processing ingredients 45% Protein enrichment, texture applications
Poultry and animal feeds 28% Cost-effective protein source, digestibility
Foodservice applications 15% Restaurant ingredients, institutional food
Household/retail consumption 8% Direct consumer cooking, traditional dishes
Other industrial uses 4% Pet food, specialized applications
Future (3-5 yrs) Plant-based food formulations 40-45% Meat alternatives, dairy analogs, protein bars
Functional food ingredients 20-25% Fortification, texture improvement, clean label
Animal nutrition optimization 18-22% Sustainable feed protein, aquaculture applications
Foodservice plant-based menus 10-15% Restaurant chains, institutional catering
Direct-to-consumer products 5-10% Retail packaged goods, e-commerce brands
Pet food premium segment 3-5% Natural pet nutrition, allergen alternatives

Pea Grits Market Key Takeaways

Metric Value
Market Value (2025)  USD 1 million
Market Forecast (2035)  USD 1.7 million
Growth Rate  5.80% CAGR
Leading Product Type  Green Pea Grits
Primary End-Use  Food Processing

The market demonstrates strong fundamentals with green pea grits capturing dominant share through superior nutritional profile and versatile food processing applications. Food processing applications drive primary demand, supported by increasing plant-based product development and clean-label ingredient trends. Geographic expansion remains concentrated in North America and Europe with established pulse processing infrastructure, while Asia Pacific shows accelerating adoption rates driven by protein security initiatives and sustainable agriculture programs.

Imperatives for Stakeholders in Pea Grits Market

Position for Plant-Based Revolution

  • Offer comprehensive ingredient solutions: nutritional specifications + functional testing + application development + technical support + regulatory compliance documentation
  • Preconfigured formulation packages: protein content optimization, texture modification guidance, flavor masking protocols, and performance validation for plant-based applications

Sustainability and Traceability Excellence

  • Sustainable sourcing programs, carbon footprint documentation, and supply chain transparency (farm-to-processor tracking, non-GMO verification)
  • Regenerative agriculture partnerships and environmental impact assessment reporting

Technical Application Support

  • Customized particle size specifications, protein solubility optimization, flavor neutralization support, and process compatibility validation
  • Integration with food processing equipment and formulation troubleshooting expertise

Multi-Channel Market Access

  • B2B bulk ingredient supply + B2C retail packaging + foodservice distribution + e-commerce platforms
  • Co-manufacturing partnerships and private label development for market expansion

Segmental Analysis

Primary Classification

The market segments by product type into green pea grits and yellow pea grits, representing variations in pea variety selection that offer distinct color, flavor, and nutritional characteristics for comprehensive food processing and feed application optimization.

Secondary Classification

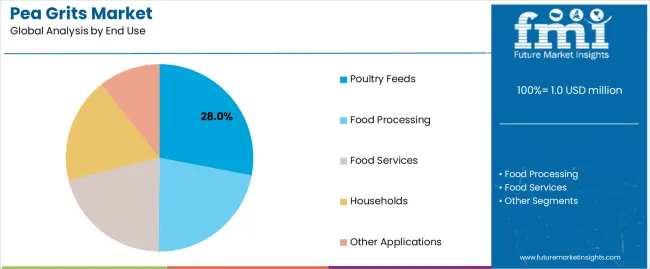
End-use segmentation divides the market into food processing, poultry feeds, foodservices, households, and other applications, reflecting distinct requirements for protein content, particle size specifications, and functional performance across diverse consumption patterns.

Tertiary Classification

Flavor segmentation covers sweet and savory applications, while distribution channels span B2B (business-to-business), B2C (business-to-consumer) including hypermarkets/supermarkets, convenience stores, and specialty retail stores.

Regional Classification

Geographic distribution covers Asia Pacific (China, India, Japan), North America (United States, Canada), Europe (Germany, United Kingdom, France), Latin America, and other regions, with North America and Europe leading established markets while Asia Pacific demonstrates explosive growth potential.

The segmentation structure reveals ingredient progression from traditional pulse processing toward specialized food ingredient applications with enhanced functionality and clean-label credentials, while application diversity spans from animal nutrition to sophisticated plant-based food formulations requiring precise protein and texture specifications.
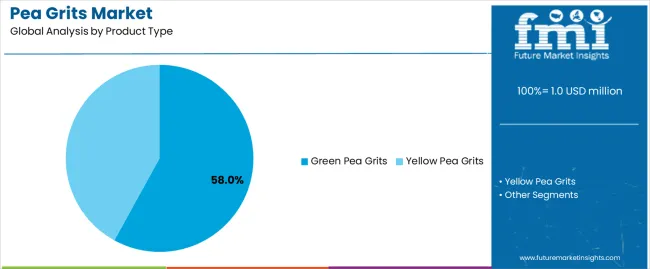
By Product Type, Green Pea Grits Segment Accounts for Dominant Market Share

Pea Grits Market Analysis By Product Type

Market Position: Green pea grits command the leading position in the pea grits market with approximately 58% market share through superior nutritional profile, appealing color characteristics, and versatile food processing applications that enable manufacturers to achieve optimal protein enrichment while maintaining clean-label positioning across plant-based products, traditional dishes, and animal feed formulations.

Value Drivers: The segment benefits from food processor preference for vibrant green color that signals freshness and natural ingredients, higher protein content averaging 22-25% compared to yellow varieties, and consumer associations with traditional green pea preparations that enhance product acceptance. Enhanced amino acid profiles and digestibility characteristics make green pea grits ideal for both human consumption and premium animal feed applications.

Competitive Advantages: Green Pea Grits differentiate through proven nutritional superiority including higher lysine content, appealing visual characteristics for food applications, and established supply chains from major pea-producing regions in North America and Europe that ensure consistent quality and availability.

Key market characteristics:

  • Superior nutritional composition with optimized protein content (22-25%) and essential amino acid profiles
  • Enhanced visual appeal enabling natural color claims and premium product positioning in food applications
  • Versatile functionality supporting diverse applications from traditional cooking to advanced plant-based formulations

Yellow Pea Grits Show Cost-Effective Performance

Yellow Pea Grits maintain approximately 42% market position due to competitive pricing advantages, neutral flavor profile, and suitable functionality for animal feed applications and industrial food processing where color considerations prove less critical than cost efficiency and protein content.

Market Intelligence Brief:

  • Animal feed representing 65% of yellow pea grit consumption due to cost advantages
  • Industrial food applications preferring neutral color for products requiring specific appearance
  • Price differential of 10-15% lower than green varieties driving adoption in cost-sensitive segments
  • Growing acceptance in plant-based meat alternatives where color can be masked through processing

Growth Characteristics:

  • Steady growth in animal nutrition applications as sustainable protein source
  • Expanding use in extruded snacks and processed foods requiring neutral substrate
  • Increasing adoption in aquaculture feeds as fish meal alternative
  • Geographic expansion in emerging markets prioritizing cost-effective protein ingredients

By End-Use, Food Processing Drives Market Leadership

Pea Grits Market Analysis By End Use

Market Context: Food processing applications dominate the market with strongest growth contribution at 6.8% CAGR, reflecting critical role of pea grits in plant-based product development, protein fortification programs, and clean-label ingredient initiatives across diverse food manufacturing sectors from meat alternatives to baked goods.

Appeal Factors: Food manufacturers prioritize ingredient functionality, nutritional profile, and clean-label credentials that enable plant-based positioning, allergen-free formulations, and sustainable sourcing claims resonating with consumer trends. The segment benefits from substantial investment in plant-based R&D and reformulation initiatives replacing animal-based proteins with pulse ingredients.

Growth Drivers: Plant-based meat alternative market expansion creates derived demand for textured protein ingredients including pea grits. Gluten-free product development drives adoption in bakery and snack applications. Protein fortification trends in breakfast cereals, nutrition bars, and functional foods create sustained ingredient demand.

Application dynamics include:

  • Strong growth in meat alternative formulations requiring protein and texture functionality
  • Increasing adoption in gluten-free and allergen-friendly product development
  • Rising integration with clean-label initiatives replacing synthetic additives with pulse-based solutions

Poultry Feeds Maintain Strong Animal Nutrition Position

Poultry Feeds capture approximately 28% end-use share through cost-effective protein supplementation in broiler and layer rations where pea grits provide essential amino acids, energy content, and digestibility characteristics supporting optimal animal performance and feed conversion efficiency.

Market Intelligence Brief:

  • Broiler feed representing 60% of poultry feed application segment
  • Soybean meal replacement programs driving pea grit adoption in feed formulations
  • Improved feed conversion ratios documented in feeding trials supporting adoption
  • Non-GMO and organic poultry production preferring pulse-based protein sources

Foodservices Show Plant-Based Menu Growth

Foodservices account for approximately 15% end-use share with fastest growth rate at 7.5% CAGR through restaurant chains, institutional catering, and QSR (quick-service restaurants) incorporating plant-based menu items requiring pea grit ingredients for protein content and texture optimization.

Value Drivers:

  • Fast-casual restaurant chains launching plant-based burger alternatives
  • Institutional foodservice (hospitals, universities) expanding vegetarian options
  • Quick-service restaurants testing plant-based protein across menu categories
  • Catering operations developing vegan and vegetarian-friendly offerings

Households Demonstrate Traditional Consumption Patterns

Household consumption captures approximately 8% market share through direct consumer purchases for traditional cooking applications, ethnic cuisine preparation, and health-conscious meal preparation in home cooking environments.

Other Applications Serve Specialized Segments

Other applications including pet food, aquaculture feeds, and industrial uses account for remaining market share through specialized requirements for natural protein ingredients in premium pet nutrition formulations and sustainable aquaculture operations.

By Flavor, Sweet Applications Show Emerging Growth

Market Position: Sweet flavor applications demonstrate growing market interest in dessert formulations, breakfast products, and confectionery items incorporating pea grits for protein fortification and texture modification while maintaining sweet taste profiles.

Value Drivers: Protein bar manufacturers incorporating pea grits into sweet formulations, breakfast cereal producers adding pulse proteins for nutritional enhancement, and bakery applications developing protein-enriched sweet goods create expanding market opportunities.

Savory Applications Maintain Traditional Leadership

Savory applications capture dominant market share through established use patterns in soup bases, savory snacks, meat alternative products, and traditional culinary preparations where pea grits provide protein, texture, and familiar flavor profiles.

By Distribution Channel, B2B Dominates Industrial Supply

Market Context: B2B (Business-to-Business) distribution commands dominant position with approximately 70% channel share through bulk ingredient sales to food processors, feed manufacturers, and industrial customers requiring reliable supply relationships, technical support, and consistent quality specifications.

Business Model Advantages: Direct manufacturer relationships enable customized specifications, long-term supply contracts, and technical collaboration on product development that create stable revenue streams and operational efficiency for pea grit suppliers.

Operational Benefits: Bulk logistics optimization, quality assurance programs, and application development support create value-added differentiation opportunities beyond commodity pricing competition in pulse ingredient markets.

B2C Retail Shows Consumer Brand Growth

B2C distribution through hypermarkets/supermarkets, convenience stores, and specialty retailers captures approximately 30% channel share with accelerating growth driven by consumer interest in cooking with pulse ingredients, ethnic cuisine preparation, and health-conscious shopping patterns.

Growth Characteristics:

  • Hypermarkets/supermarkets representing 60% of B2C distribution through mainstream retail presence
  • Specialty retail stores showing fastest growth serving natural food consumers and ethnic markets
  • Convenience stores emerging in urban markets for impulse purchases and ethnic communities
  • E-commerce platforms expanding access for niche products and direct-to-consumer brands

By Region, Asia Pacific Leads Market Growth

Market Context: Asia Pacific dominates pea grits market growth with fastest CAGR at 7.2% driven by population growth, protein security initiatives, expanding food processing industry, and traditional consumption patterns across China, India, and Southeast Asian nations requiring pulse-based ingredients.

Business Model Advantages: The region provides largest consumption volumes for both traditional food applications and emerging plant-based product development, driving sustained demand while supporting regional pulse cultivation and processing capacity expansion.

Operational Benefits: Asia Pacific markets benefit from agricultural production capabilities in India and China, growing middle-class protein consumption, and government food security programs that create integrated pulse processing value chains and competitive market economics.

Drivers, Restraints, and Key Trends

Category Factor Impact Why It Matters
Driver Plant-based protein demand (vegan/vegetarian trends, sustainability concerns) ★★★★★ Consumer dietary shifts drive plant protein ingredient demand; pea grits positioned as clean-label, sustainable protein source
Driver Food allergy considerations (soy-free, gluten-free alternatives) ★★★★★ Allergen avoidance creates market opportunity for pea-based ingredients; hypoallergenic properties enable wide formulation use
Driver Sustainable agriculture & protein diversification ★★★★☆ Nitrogen-fixing properties and low water requirements position peas as sustainable crop; agricultural diversification away from soy benefits pulse ingredients
Restraint Flavor challenges & off-taste perceptions ★★★★☆ Beany or earthy flavor notes limit application in sensitive formulations; requires masking or flavor optimization for mainstream acceptance
Restraint Price volatility & crop yield variations ★★★☆☆ Agricultural commodity pricing fluctuates with weather and harvest; margin pressure during high-price periods affects affordability
Restraint Competition from other pulse proteins (lentils, chickpeas) ★★★☆☆ Multiple pulse alternatives compete for food processing adoption; differentiation requires functional advantages or cost positioning
Trend Protein fortification & functional food development ★★★★★ Food manufacturers enriching products with plant proteins; pea grits enable protein content claims without allergen concerns
Trend Clean-label movement & minimal processing ★★★★☆ Simple ingredient lists favor recognizable pulse ingredients; pea grits align with consumer desire for natural, minimally processed foods
Trend Circular economy & upcycled ingredients ★★★★☆ Side-stream utilization in pea processing creates value-added products; sustainability credentials enhance brand positioning

Analysis of the Pea Grits Market by Key Country

The pea grits market demonstrates varied regional dynamics with Growth Leaders including China (5.2% growth rate) and India (4.9% growth rate), driven by plant-protein snacks, bakery extenders, noodle and batter systems, and starch–protein co-processing near pulse hubs. Steady Performers encompass Germany (4.3% growth rate) and developed regions that benefit from rigorous quality programs, extrusion know-how, and private-label depth. Mature Markets feature the United States (3.7% growth rate), United Kingdom (3.3% growth rate), and Japan (2.9% growth rate), where label clarity, texture control, and reliable supply chains support consistent growth patterns. Regional synthesis shows East Asian markets leading adoption through puffed snacks, instant noodles, and pet nutrition; North America maintains steady expansion anchored in gluten-control bakery and high-protein formats; European markets post moderate growth focused on particle control, flavor management, and audit-ready documentation.
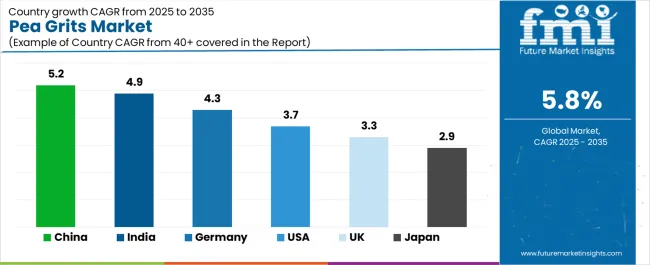
Pea Grits Market Cagr Analysis By Country

Region/Country 2025–2035 Growth How to win What to watch out
China 5.2% Local milling near ports; odor-managed lots; fast QC & Chinese COAs Price pressure; flavor drift in warm routes; import paperwork
India 4.9% Value SKUs for snacks/noodles; drum-split service; fryer and extruder trials Monsoon logistics; heat stability; GST complexity
Germany 4.3% Tight granulation bands; low-OD lots; bakery and meat-alt pilots Strict specs; long validations; allergen cross-contact control
United States 3.7% Gluten-management in bakery; pet-nutrition grades; rapid sampling Grain price swings; freight; taste masking in high loads
United Kingdom 3.3% Retailer co-dev snacks; cereal and batter extensions; shelf-ready cases HFSS rules; pack size pressure; consistency audits
Japan 2.9% Fine-grit precision; clear label cues; small-lot pilots for convenience Space limits; humid summers; slow rotation risk

China Drives Fastest Market Growth

Pea Grits Market Country Value Analysis

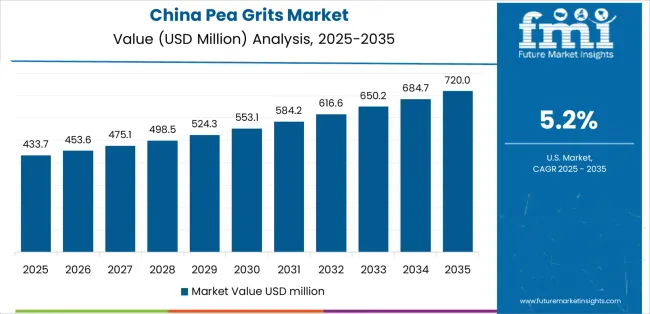
China establishes fastest market growth through large snack corridors, instant noodle plants, and pet-food clusters that seek plant-forward extenders without sacrificing crunch or bowl life. The country’s 5.2% growth rate reflects demand from Shanghai, Guangdong, and Shandong hubs where converters want odor-managed pea grits that run clean on extruders and fryers. Success rests on particle size discipline, moisture control, and peroxide limits that protect taste in light-flavor snacks and clear soups. Bakery teams blend grits into steamed buns and crackers for texture while holding color. Pet lines favor consistent proteins and low ash to stabilize stool scores and palatability. Import partners who localize COAs, maintain buffer stock, and release lots quickly gain share during seasonal launches. E-commerce brands extend reach with family pouches and recipe cards that teach home cooks how to use grits in congee toppings and batters. Millers near ports win on freight and speed, especially when they offer deodorized options for delicate flavor systems.

Strategic Market Indicators:

  • Snack plants seeking narrow 300–800 µm bands for even expansion
  • Pet facilities requesting low-OD, low-ash lots for sensitive formulas
  • Flavor parks favoring pre-sifted, low-moisture pallets for fast changeovers

India Emerges as High-Growth Market

India shows one of the fastest adoption curves in pea grits, expanding at 4.9% during 2025–2035. Growth centers on namkeen, extruded snacks, instant noodles, and value bakery where pea grits lift protein while keeping bite. Clusters in Delhi NCR, Gujarat, Maharashtra, and Karnataka reach for drum-split services (5–25 kg) and clear SOPs that limit dusting and carryover. Fryer lines ask for particles that drain oil well, reduce breakage, and keep seasonings bright. Noodle plants want blends that hold strand strength yet cook fast for cup formats. Festival spikes require depot playbooks, moisture-proof wraps, and quick QC release to avoid rework during rain weeks. Private brands push small pouches for kirana, while modern trade buyers prefer shelf-ready cases for quick restocks. Training on flavor masking and basic deodorization lifts acceptance in lightly seasoned products. Documentation in bilingual format and GST-clean billing shorten onboarding for distributors and co-packers.

Market Intelligence Brief:

  • Heat-stable lots with low residual beany notes for mild masala SKUs
  • Extruder and fryer clinics demonstrating expansion and drain profiles
  • Depot humidity controls and pallet wraps for monsoon periods

Germany Maintains Technology Leadership

Germany remains the European benchmark for quality-led pea grits adoption, maintaining a 4.3% growth rate from 2025 to 2035. Buyers in Bavaria, NRW, and Baden-Württemberg expect tight granulation, low off-odor, and verified microbiology for bakery, cereal coatings, meat alternatives, and soups. Formulators rely on clean particle distributions to manage hydration and crumb structure, with odor-managed grits supporting mild flavors and long shelf life. Audit depth matters: allergen cross-contact control, metal detection, and batch trace move projects through retailer gates. Pilot plants value vendor support on shear settings, water ratios, and dwell time for both extrusion and hydrated dough systems. Private label teams co-develop crunch inclusions and breaders that keep adhesion in oven cycles. Success rises with evidence that grits hold color, limit sandy mouthfeel, and remain stable in retort or pasteurization. Millers that offer consistent deodorized grades and EU-language documentation secure repeat listings across seasonal runs.

Market Intelligence Brief:

  • Bakery pilots proving crumb lift with 5–15% inclusion rates
  • Retort tests confirming color and bite in delicately seasoned soups
  • Retail audit packs: SDS, CoA, sieve curves, and allergen controls

United States Maintains Market Leadership

The United States holds a leading position in the pea grits market, maintaining a steady 3.7% growth rate through 2035. Demand spans gluten-management in bakery, high-protein cereals, snack puffs, and pet nutrition where texture and bowl life drive repeat purchase. Brands want rapid sampling, spec-matched alternates, and freight-sensible sourcing to cushion crop swings. Snack makers focus on even expansion and gentle seasoning adhesion, while bakers need granulation that supports crumb without gritty chew. Pet formulators request consistent protein and low ash to stabilize stool scores and palatants. Co-manufacturers prefer lots that run across multiple clients without lengthy clean-downs. Data-led resets reward suppliers who protect velocity on core SKUs while adding two to three flavors per cycle. Regional DCs with safety stock keep promo calendars intact during storm seasons. Clear taste-masking guides help developers hold delicate vanilla or cheese notes at higher inclusion levels.

Market Intelligence Brief:

  • Cold-chain and storm-season freight plans to protect launch timing
  • Sieve and moisture targets tuned to air vs. oil expansion systems
  • Pet-grade specs aligning digestibility with stool and coat metrics

United Kingdom Shows Food Integration

United Kingdom advances at 3.3%, with retailer programs favoring portion-sized snacks, oven-ready breaders, and cereal inclusions that keep bite without heavy seasoning. Buyers ask for shelf-ready outers, tidy case weights, and consistent granulation that supports quick line changeovers. Bakery teams use grits to lift protein while preserving crumb softness in rolls and wraps. Coating lines seek adhesion that survives oven cycles and air-fryer prep. Convenience and discounter channels want compact packs and clear front-of-pack cues. Wins grow when suppliers run bake and oven tests with retailer labs, share sieve curves, and document odor control steps. UK DC safety stock smooths weekly promos and school-holiday peaks. Clear claim phrasing and predictable micro counts ease audits. Small pilot runs for limited flavors keep novelty flowing while protecting core ranges from cannibalization.

Market Intelligence Brief:
  • Breader trials validating crisp hold after 20–30 minutes on hot counter
  • Cereal inclusion tests for milk bowl life and even hydration
  • Shelf-ready cases sized for narrow backrooms and fast picks

Japan Shows Precision Market Development

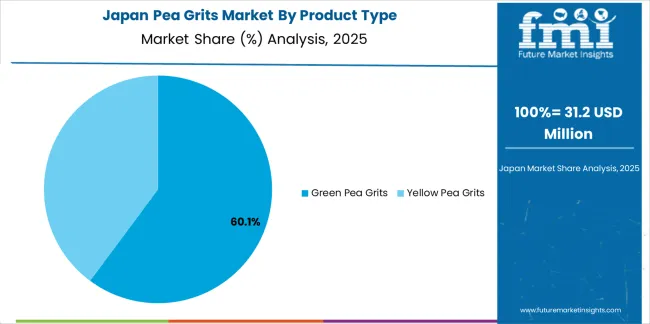
Pea Grits Market Japan Market Share Analysis By Product Type

Japan posts 2.9% growth, shaped by refined taste targets, compact packaging, and convenience-led rotations. Converters in Tokyo, Osaka, and Nagoya prefer fine-to-medium grits that hydrate predictably and carry delicate flavors such as shoyu, dashi, yuzu, and mild cheese. Convenience stores require small pouches with perfect seals and low scuff labels, so outer cases must hold shape through dense backrooms. Noodle and tempura lines test blends that improve texture while keeping cook time and oil uptake under control. Documentation in Japanese, clear odor descriptors, and storage guidance for humid summers build trust. Success improves when vendors offer deodorized options, micro sets that prove low off-notes, and pilot support on water ratios and dwell times. Seasonal minis and gift packs benefit from tight lot matching so repeat buyers experience identical bite month to month.

Strategic Market Considerations:
  • Humidity-stress checks for summer routes and coastal stores
  • Fine-grit pilots for convenience noodles and baked snacks
  • JP-language COAs, sieve data, and odor panels for approvals

Europe Market Split by Country

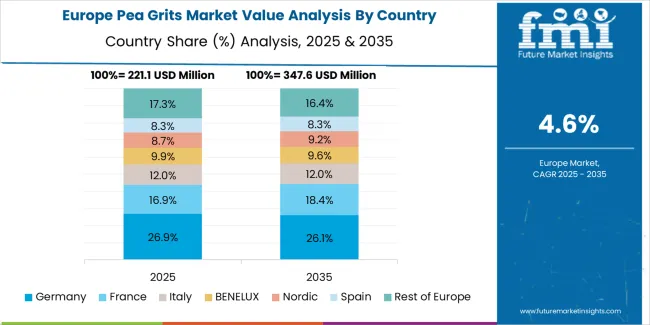
Pea Grits Market Europe Country Market Share Analysis, 2025 & 2035

The European pea grits market is projected to grow from USD 1.12 billion in 2025 to USD 1.62 billion by 2035, registering a CAGR of 3.8%. Germany is expected to maintain leadership with a 34% share in 2025 through bakery, cereal, and meat-alt applications anchored by tight specifications and audit depth. The United Kingdom follows with 22%, driven by retailer co-developed snacks, breaders, and cereal inclusions. France holds 17% with soup and snack corridors; Italy accounts for 15% via bakery and breaders; Spain reaches 9%, while the rest of Europe edges from 3% to 3.5% by 2035 as Central and Nordic plants add extrusion and coating capacity.
Competitive Landscape

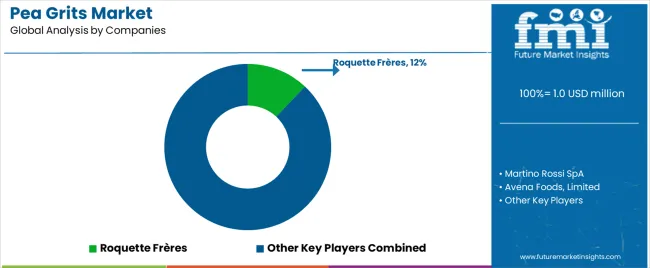
Pea Grits Market Analysis By Company

  • Structure: ~40-60 processors and suppliers globally; top 12-15 hold ~50-60% by processing capacity
  • Leadership is maintained through: supply chain integration, processing capabilities, and application expertise (farmer relationships + milling technology + technical service)
  • What's commoditizing: standard yellow pea grits for animal feed applications
  • Margin Opportunities: organic certification, functional ingredient grades, application-specific customization, and technical service packages
Stakeholder What they actually control Typical strengths Typical blind spots
Integrated pulse processors Farmer networks, processing capacity, logistics infrastructure Supply security, cost position, volume capability Innovation speed; specialty applications
Specialty ingredient suppliers Application expertise, custom specifications, technical service Differentiation, premium positioning, customer intimacy Production scale; commodity competition
Regional processors Local market access, cultural understanding, farmer relationships Geographic proximity, flexibility, relationship focus Technology gaps; international reach
Food ingredient companies Application development, formulation expertise, market access Technical service, innovation support, global reach Pulse sourcing; agricultural expertise
Organic pulse suppliers Organic certification, sustainable sourcing, niche positioning Premium segments, clean-label credentials, brand loyalty Volume constraints; price premium limitations

Key Players in Pea Grits Market

  • Martino Rossi SpA
  • Avena Foods, Limited
  • Best Cooking Pulses, Inc.
  • ADM (Archer Daniels Midland Company)
  • Ingredion Incorporated
  • Roquette Frères
  • AGT Food and Ingredients
  • The Scoular Company
  • Vestkorn Milling AS
  • Great Western Grain
  • Simpson Seeds Inc.
  • Parrheim Foods
  • Prairie Fava Inc.
  • SunOpta Inc.
  • Puris Foods

Scope of the Report

Item Value
Quantitative Units USD 1 million
Product Type Green Pea Grits, Yellow Pea Grits
End Use Food Processing, Poultry Feeds, Food Services, Households, Other Applications
Flavor Sweet, Savory
Distribution Channel B2B, B2C (Hypermarkets/Supermarkets, Convenience Stores, Specialty Retail Stores)
Regions Covered Asia Pacific, North America, Europe, Latin America, Middle East & Africa
Countries Covered China, India, United States, Germany, United Kingdom, Japan, Canada, France, Australia, Brazil, Netherlands, Italy, Spain, Belgium, and 20+ additional countries
Key Companies Profiled Martino Rossi SpA, Avena Foods Limited, Best Cooking Pulses Inc., ADM, Ingredion, Roquette Frères, AGT Food and Ingredients, The Scoular Company, Vestkorn Milling, Great Western Grain
Additional Attributes Revenue analysis by product type and end-use categories, regional consumption patterns across Asia Pacific, North America, and Europe, competitive landscape with integrated processors and specialty suppliers, customer preferences for organic certification and functional specifications, distribution channel dynamics across B2B and B2C sectors, innovations in particle size optimization and flavor neutralization, development of application-specific grades with protein content and digestibility optimization capabilities

Market Segmentation

Product Type

  • Green Pea Grits
    • Standard Grade
    • Food Grade
    • Premium Grade
    • Organic Certified
  • Yellow Pea Grits
    • Standard Grade
    • Food Grade
    • Feed Grade
    • Organic Certified

End Use

  • Food Processing
    • Meat Alternatives (Burgers, Sausages, Nuggets)
    • Bakery Products (Protein Breads, Baked Goods)
    • Snack Foods (Extruded Snacks, Protein Chips)
    • Pasta and Noodles
    • Protein Bars and Nutrition Products
    • Dairy Alternatives
    • Soups and Sauces
  • Poultry Feeds
    • Broiler Feed
    • Layer Feed
    • Breeder Feed
    • Organic Poultry Nutrition
  • Food Services
    • Restaurant Chains
    • Quick Service Restaurants (QSR)
    • Institutional Catering
    • Hotels and Hospitality
    • Cloud Kitchens
  • Households
    • Traditional Cooking
    • Ethnic Cuisine Preparation
    • Health-Conscious Meal Prep
    • Home Baking
  • Other Applications
    • Pet Food (Dog Food, Cat Food)
    • Aquaculture Feeds
    • Livestock Feed
    • Industrial Applications

Flavor

  • Sweet
    • Dessert Applications
    • Breakfast Products
    • Confectionery
    • Sweet Baked Goods
  • Savory
    • Meat Alternative Products
    • Savory Snacks
    • Soups and Stews
    • Traditional Preparations

Distribution Channel

  • B2B (Business-to-Business)
    • Direct Manufacturer Supply
    • Ingredient Distributors
    • Feed Ingredient Suppliers
    • Foodservice Distributors
  • B2C (Business-to-Consumer)
    • Hypermarkets/Supermarkets
    • Convenience Stores
    • Specialty Retail Stores
    • Online/E-Commerce Platforms
    • Ethnic Grocery Stores

Particle Size Specifications

  • Coarse Grits (for texture applications)
  • Medium Grits (general purpose)
  • Fine Grits (smooth texture applications)
  • Custom Specifications (application-specific)

Certification Types

  • Organic Certified
  • Non-GMO Verified
  • Gluten-Free Certified
  • Kosher Certified
  • Halal Certified
  • Vegan Certified

Region

  • Asia Pacific
    • China
    • India
    • Japan
    • Australia
    • South Korea
    • Thailand
    • Vietnam
    • Indonesia
    • Pakistan
    • Bangladesh
  • North America
    • United States
    • Canada
    • Mexico
  • Europe
    • Germany
    • United Kingdom
    • France
    • Netherlands
    • Belgium
    • Italy
    • Spain
    • Poland
    • Russia
    • Scandinavia
  • Latin America
    • Brazil
    • Argentina
    • Chile
    • Colombia
  • Middle East & Africa
    • United Arab Emirates
    • Saudi Arabia
    • South Africa
    • Egypt
    • Ethiopia
    • Kenya

Frequently Asked Questions

How big is the pea grits market in 2025?

The global pea grits market is estimated to be valued at USD 1.0 million in 2025.

What will be the size of pea grits market in 2035?

The market size for the pea grits market is projected to reach USD 1.7 million by 2035.

How much will be the pea grits market growth between 2025 and 2035?

The pea grits market is expected to grow at a 5.8% CAGR between 2025 and 2035.

What are the key product types in the pea grits market?

The key product types in pea grits market are green pea grits and yellow pea grits.

Which end use segment to contribute significant share in the pea grits market in 2025?

In terms of end use, poultry feeds segment to command 28.0% share in the pea grits market in 2025.

Table of Content

  1. Executive Summary
    • Global Market Outlook
    • Demand to side Trends
    • Supply to side Trends
    • Technology Roadmap Analysis
    • Analysis and Recommendations
  2. Market Overview
    • Market Coverage / Taxonomy
    • Market Definition / Scope / Limitations
  3. Market Background
    • Market Dynamics
      • Drivers
      • Restraints
      • Opportunity
      • Trends
    • Scenario Forecast
      • Demand in Optimistic Scenario
      • Demand in Likely Scenario
      • Demand in Conservative Scenario
    • Opportunity Map Analysis
    • Product Life Cycle Analysis
    • Supply Chain Analysis
    • Investment Feasibility Matrix
    • Value Chain Analysis
    • PESTLE and Porter’s Analysis
    • Regulatory Landscape
    • Regional Parent Market Outlook
    • Production and Consumption Statistics
    • Import and Export Statistics
  4. Global Market Analysis 2020 to 2024 and Forecast, 2025 to 2035
    • Historical Market Size Value (USD Million) Analysis, 2020 to 2024
    • Current and Future Market Size Value (USD Million) Projections, 2025 to 2035
      • Y to o to Y Growth Trend Analysis
      • Absolute $ Opportunity Analysis
  5. Global Market Pricing Analysis 2020 to 2024 and Forecast 2025 to 2035
  6. Global Market Analysis 2020 to 2024 and Forecast 2025 to 2035, By Product Type
    • Introduction / Key Findings
    • Historical Market Size Value (USD Million) Analysis By Product Type , 2020 to 2024
    • Current and Future Market Size Value (USD Million) Analysis and Forecast By Product Type , 2025 to 2035
      • Green Pea Grits
      • Yellow Pea Grits
    • Y to o to Y Growth Trend Analysis By Product Type , 2020 to 2024
    • Absolute $ Opportunity Analysis By Product Type , 2025 to 2035
  7. Global Market Analysis 2020 to 2024 and Forecast 2025 to 2035, By End Use
    • Introduction / Key Findings
    • Historical Market Size Value (USD Million) Analysis By End Use, 2020 to 2024
    • Current and Future Market Size Value (USD Million) Analysis and Forecast By End Use, 2025 to 2035
      • Poultry Feeds
      • Food Processing
      • Food Services
      • Households
      • Other Applications
    • Y to o to Y Growth Trend Analysis By End Use, 2020 to 2024
    • Absolute $ Opportunity Analysis By End Use, 2025 to 2035
  8. Global Market Analysis 2020 to 2024 and Forecast 2025 to 2035, By Region
    • Introduction
    • Historical Market Size Value (USD Million) Analysis By Region, 2020 to 2024
    • Current Market Size Value (USD Million) Analysis and Forecast By Region, 2025 to 2035
      • North America
      • Latin America
      • Western Europe
      • Eastern Europe
      • East Asia
      • South Asia and Pacific
      • Middle East & Africa
    • Market Attractiveness Analysis By Region
  9. North America Market Analysis 2020 to 2024 and Forecast 2025 to 2035, By Country
    • Historical Market Size Value (USD Million) Trend Analysis By Market Taxonomy, 2020 to 2024
    • Market Size Value (USD Million) Forecast By Market Taxonomy, 2025 to 2035
      • By Country
        • USA
        • Canada
        • Mexico
      • By Product Type
      • By End Use
    • Market Attractiveness Analysis
      • By Country
      • By Product Type
      • By End Use
    • Key Takeaways
  10. Latin America Market Analysis 2020 to 2024 and Forecast 2025 to 2035, By Country
    • Historical Market Size Value (USD Million) Trend Analysis By Market Taxonomy, 2020 to 2024
    • Market Size Value (USD Million) Forecast By Market Taxonomy, 2025 to 2035
      • By Country
        • Brazil
        • Chile
        • Rest of Latin America
      • By Product Type
      • By End Use
    • Market Attractiveness Analysis
      • By Country
      • By Product Type
      • By End Use
    • Key Takeaways
  11. Western Europe Market Analysis 2020 to 2024 and Forecast 2025 to 2035, By Country
    • Historical Market Size Value (USD Million) Trend Analysis By Market Taxonomy, 2020 to 2024
    • Market Size Value (USD Million) Forecast By Market Taxonomy, 2025 to 2035
      • By Country
        • Germany
        • UK
        • Italy
        • Spain
        • France
        • Nordic
        • BENELUX
        • Rest of Western Europe
      • By Product Type
      • By End Use
    • Market Attractiveness Analysis
      • By Country
      • By Product Type
      • By End Use
    • Key Takeaways
  12. Eastern Europe Market Analysis 2020 to 2024 and Forecast 2025 to 2035, By Country
    • Historical Market Size Value (USD Million) Trend Analysis By Market Taxonomy, 2020 to 2024
    • Market Size Value (USD Million) Forecast By Market Taxonomy, 2025 to 2035
      • By Country
        • Russia
        • Poland
        • Hungary
        • Balkan & Baltic
        • Rest of Eastern Europe
      • By Product Type
      • By End Use
    • Market Attractiveness Analysis
      • By Country
      • By Product Type
      • By End Use
    • Key Takeaways
  13. East Asia Market Analysis 2020 to 2024 and Forecast 2025 to 2035, By Country
    • Historical Market Size Value (USD Million) Trend Analysis By Market Taxonomy, 2020 to 2024
    • Market Size Value (USD Million) Forecast By Market Taxonomy, 2025 to 2035
      • By Country
        • China
        • Japan
        • South Korea
      • By Product Type
      • By End Use
    • Market Attractiveness Analysis
      • By Country
      • By Product Type
      • By End Use
    • Key Takeaways
  14. South Asia and Pacific Market Analysis 2020 to 2024 and Forecast 2025 to 2035, By Country
    • Historical Market Size Value (USD Million) Trend Analysis By Market Taxonomy, 2020 to 2024
    • Market Size Value (USD Million) Forecast By Market Taxonomy, 2025 to 2035
      • By Country
        • India
        • ASEAN
        • Australia & New Zealand
        • Rest of South Asia and Pacific
      • By Product Type
      • By End Use
    • Market Attractiveness Analysis
      • By Country
      • By Product Type
      • By End Use
    • Key Takeaways
  15. Middle East & Africa Market Analysis 2020 to 2024 and Forecast 2025 to 2035, By Country
    • Historical Market Size Value (USD Million) Trend Analysis By Market Taxonomy, 2020 to 2024
    • Market Size Value (USD Million) Forecast By Market Taxonomy, 2025 to 2035
      • By Country
        • Kingdom of Saudi Arabia
        • Other GCC Countries
        • Turkiye
        • South Africa
        • Other African Union
        • Rest of Middle East & Africa
      • By Product Type
      • By End Use
    • Market Attractiveness Analysis
      • By Country
      • By Product Type
      • By End Use
    • Key Takeaways
  16. Key Countries Market Analysis
    • USA
      • Pricing Analysis
      • Market Share Analysis, 2024
        • By Product Type
        • By End Use
    • Canada
      • Pricing Analysis
      • Market Share Analysis, 2024
        • By Product Type
        • By End Use
    • Mexico
      • Pricing Analysis
      • Market Share Analysis, 2024
        • By Product Type
        • By End Use
    • Brazil
      • Pricing Analysis
      • Market Share Analysis, 2024
        • By Product Type
        • By End Use
    • Chile
      • Pricing Analysis
      • Market Share Analysis, 2024
        • By Product Type
        • By End Use
    • Germany
      • Pricing Analysis
      • Market Share Analysis, 2024
        • By Product Type
        • By End Use
    • UK
      • Pricing Analysis
      • Market Share Analysis, 2024
        • By Product Type
        • By End Use
    • Italy
      • Pricing Analysis
      • Market Share Analysis, 2024
        • By Product Type
        • By End Use
    • Spain
      • Pricing Analysis
      • Market Share Analysis, 2024
        • By Product Type
        • By End Use
    • France
      • Pricing Analysis
      • Market Share Analysis, 2024
        • By Product Type
        • By End Use
    • India
      • Pricing Analysis
      • Market Share Analysis, 2024
        • By Product Type
        • By End Use
    • ASEAN
      • Pricing Analysis
      • Market Share Analysis, 2024
        • By Product Type
        • By End Use
    • Australia & New Zealand
      • Pricing Analysis
      • Market Share Analysis, 2024
        • By Product Type
        • By End Use
    • China
      • Pricing Analysis
      • Market Share Analysis, 2024
        • By Product Type
        • By End Use
    • Japan
      • Pricing Analysis
      • Market Share Analysis, 2024
        • By Product Type
        • By End Use
    • South Korea
      • Pricing Analysis
      • Market Share Analysis, 2024
        • By Product Type
        • By End Use
    • Russia
      • Pricing Analysis
      • Market Share Analysis, 2024
        • By Product Type
        • By End Use
    • Poland
      • Pricing Analysis
      • Market Share Analysis, 2024
        • By Product Type
        • By End Use
    • Hungary
      • Pricing Analysis
      • Market Share Analysis, 2024
        • By Product Type
        • By End Use
    • Kingdom of Saudi Arabia
      • Pricing Analysis
      • Market Share Analysis, 2024
        • By Product Type
        • By End Use
    • Turkiye
      • Pricing Analysis
      • Market Share Analysis, 2024
        • By Product Type
        • By End Use
    • South Africa
      • Pricing Analysis
      • Market Share Analysis, 2024
        • By Product Type
        • By End Use
  17. Market Structure Analysis
    • Competition Dashboard
    • Competition Benchmarking
    • Market Share Analysis of Top Players
      • By Regional
      • By Product Type
      • By End Use
  18. Competition Analysis
    • Competition Deep Dive
      • Roquette Frères
        • Overview
        • Product Portfolio
        • Profitability by Market Segments (Product/Age /Sales Channel/Region)
        • Sales Footprint
        • Strategy Overview
          • Marketing Strategy
          • Product Strategy
          • Channel Strategy
      • Martino Rossi SpA
      • Avena Foods, Limited
      • Best Cooking Pulses, Inc.
      • ADM (Archer Daniels Midland Company)
      • Ingredion Incorporated
      • AGT Food and Ingredients
      • The Scoular Company
      • Vestkorn Milling AS
      • Great Western Grain
      • Simpson Seeds Inc.
      • Parrheim Foods
      • Prairie Fava Inc.
      • SunOpta Inc.
      • Puris Foods
  19. Assumptions & Acronyms Used
  20. Research Methodology

List of Tables

  • Table 1: Global Market Value (USD Million) Forecast by Region, 2020 to 2035
  • Table 2: Global Market Value (USD Million) Forecast by Product Type , 2020 to 2035
  • Table 3: Global Market Value (USD Million) Forecast by End Use, 2020 to 2035
  • Table 4: North America Market Value (USD Million) Forecast by Country, 2020 to 2035
  • Table 5: North America Market Value (USD Million) Forecast by Product Type , 2020 to 2035
  • Table 6: North America Market Value (USD Million) Forecast by End Use, 2020 to 2035
  • Table 7: Latin America Market Value (USD Million) Forecast by Country, 2020 to 2035
  • Table 8: Latin America Market Value (USD Million) Forecast by Product Type , 2020 to 2035
  • Table 9: Latin America Market Value (USD Million) Forecast by End Use, 2020 to 2035
  • Table 10: Western Europe Market Value (USD Million) Forecast by Country, 2020 to 2035
  • Table 11: Western Europe Market Value (USD Million) Forecast by Product Type , 2020 to 2035
  • Table 12: Western Europe Market Value (USD Million) Forecast by End Use, 2020 to 2035
  • Table 13: Eastern Europe Market Value (USD Million) Forecast by Country, 2020 to 2035
  • Table 14: Eastern Europe Market Value (USD Million) Forecast by Product Type , 2020 to 2035
  • Table 15: Eastern Europe Market Value (USD Million) Forecast by End Use, 2020 to 2035
  • Table 16: East Asia Market Value (USD Million) Forecast by Country, 2020 to 2035
  • Table 17: East Asia Market Value (USD Million) Forecast by Product Type , 2020 to 2035
  • Table 18: East Asia Market Value (USD Million) Forecast by End Use, 2020 to 2035
  • Table 19: South Asia and Pacific Market Value (USD Million) Forecast by Country, 2020 to 2035
  • Table 20: South Asia and Pacific Market Value (USD Million) Forecast by Product Type , 2020 to 2035
  • Table 21: South Asia and Pacific Market Value (USD Million) Forecast by End Use, 2020 to 2035
  • Table 22: Middle East & Africa Market Value (USD Million) Forecast by Country, 2020 to 2035
  • Table 23: Middle East & Africa Market Value (USD Million) Forecast by Product Type , 2020 to 2035
  • Table 24: Middle East & Africa Market Value (USD Million) Forecast by End Use, 2020 to 2035

List of Figures

  • Figure 1: Global Market Pricing Analysis
  • Figure 2: Global Market Value (USD Million) Forecast 2020-2035
  • Figure 3: Global Market Value Share and BPS Analysis by Product Type , 2025 and 2035
  • Figure 4: Global Market Y to o to Y Growth Comparison by Product Type , 2025-2035
  • Figure 5: Global Market Attractiveness Analysis by Product Type
  • Figure 6: Global Market Value Share and BPS Analysis by End Use, 2025 and 2035
  • Figure 7: Global Market Y to o to Y Growth Comparison by End Use, 2025-2035
  • Figure 8: Global Market Attractiveness Analysis by End Use
  • Figure 9: Global Market Value (USD Million) Share and BPS Analysis by Region, 2025 and 2035
  • Figure 10: Global Market Y to o to Y Growth Comparison by Region, 2025-2035
  • Figure 11: Global Market Attractiveness Analysis by Region
  • Figure 12: North America Market Incremental Dollar Opportunity, 2025-2035
  • Figure 13: Latin America Market Incremental Dollar Opportunity, 2025-2035
  • Figure 14: Western Europe Market Incremental Dollar Opportunity, 2025-2035
  • Figure 15: Eastern Europe Market Incremental Dollar Opportunity, 2025-2035
  • Figure 16: East Asia Market Incremental Dollar Opportunity, 2025-2035
  • Figure 17: South Asia and Pacific Market Incremental Dollar Opportunity, 2025-2035
  • Figure 18: Middle East & Africa Market Incremental Dollar Opportunity, 2025-2035
  • Figure 19: North America Market Value Share and BPS Analysis by Country, 2025 and 2035
  • Figure 20: North America Market Value Share and BPS Analysis by Product Type , 2025 and 2035
  • Figure 21: North America Market Y to o to Y Growth Comparison by Product Type , 2025-2035
  • Figure 22: North America Market Attractiveness Analysis by Product Type
  • Figure 23: North America Market Value Share and BPS Analysis by End Use, 2025 and 2035
  • Figure 24: North America Market Y to o to Y Growth Comparison by End Use, 2025-2035
  • Figure 25: North America Market Attractiveness Analysis by End Use
  • Figure 26: Latin America Market Value Share and BPS Analysis by Country, 2025 and 2035
  • Figure 27: Latin America Market Value Share and BPS Analysis by Product Type , 2025 and 2035
  • Figure 28: Latin America Market Y to o to Y Growth Comparison by Product Type , 2025-2035
  • Figure 29: Latin America Market Attractiveness Analysis by Product Type
  • Figure 30: Latin America Market Value Share and BPS Analysis by End Use, 2025 and 2035
  • Figure 31: Latin America Market Y to o to Y Growth Comparison by End Use, 2025-2035
  • Figure 32: Latin America Market Attractiveness Analysis by End Use
  • Figure 33: Western Europe Market Value Share and BPS Analysis by Country, 2025 and 2035
  • Figure 34: Western Europe Market Value Share and BPS Analysis by Product Type , 2025 and 2035
  • Figure 35: Western Europe Market Y to o to Y Growth Comparison by Product Type , 2025-2035
  • Figure 36: Western Europe Market Attractiveness Analysis by Product Type
  • Figure 37: Western Europe Market Value Share and BPS Analysis by End Use, 2025 and 2035
  • Figure 38: Western Europe Market Y to o to Y Growth Comparison by End Use, 2025-2035
  • Figure 39: Western Europe Market Attractiveness Analysis by End Use
  • Figure 40: Eastern Europe Market Value Share and BPS Analysis by Country, 2025 and 2035
  • Figure 41: Eastern Europe Market Value Share and BPS Analysis by Product Type , 2025 and 2035
  • Figure 42: Eastern Europe Market Y to o to Y Growth Comparison by Product Type , 2025-2035
  • Figure 43: Eastern Europe Market Attractiveness Analysis by Product Type
  • Figure 44: Eastern Europe Market Value Share and BPS Analysis by End Use, 2025 and 2035
  • Figure 45: Eastern Europe Market Y to o to Y Growth Comparison by End Use, 2025-2035
  • Figure 46: Eastern Europe Market Attractiveness Analysis by End Use
  • Figure 47: East Asia Market Value Share and BPS Analysis by Country, 2025 and 2035
  • Figure 48: East Asia Market Value Share and BPS Analysis by Product Type , 2025 and 2035
  • Figure 49: East Asia Market Y to o to Y Growth Comparison by Product Type , 2025-2035
  • Figure 50: East Asia Market Attractiveness Analysis by Product Type
  • Figure 51: East Asia Market Value Share and BPS Analysis by End Use, 2025 and 2035
  • Figure 52: East Asia Market Y to o to Y Growth Comparison by End Use, 2025-2035
  • Figure 53: East Asia Market Attractiveness Analysis by End Use
  • Figure 54: South Asia and Pacific Market Value Share and BPS Analysis by Country, 2025 and 2035
  • Figure 55: South Asia and Pacific Market Value Share and BPS Analysis by Product Type , 2025 and 2035
  • Figure 56: South Asia and Pacific Market Y to o to Y Growth Comparison by Product Type , 2025-2035
  • Figure 57: South Asia and Pacific Market Attractiveness Analysis by Product Type
  • Figure 58: South Asia and Pacific Market Value Share and BPS Analysis by End Use, 2025 and 2035
  • Figure 59: South Asia and Pacific Market Y to o to Y Growth Comparison by End Use, 2025-2035
  • Figure 60: South Asia and Pacific Market Attractiveness Analysis by End Use
  • Figure 61: Middle East & Africa Market Value Share and BPS Analysis by Country, 2025 and 2035
  • Figure 62: Middle East & Africa Market Value Share and BPS Analysis by Product Type , 2025 and 2035
  • Figure 63: Middle East & Africa Market Y to o to Y Growth Comparison by Product Type , 2025-2035
  • Figure 64: Middle East & Africa Market Attractiveness Analysis by Product Type
  • Figure 65: Middle East & Africa Market Value Share and BPS Analysis by End Use, 2025 and 2035
  • Figure 66: Middle East & Africa Market Y to o to Y Growth Comparison by End Use, 2025-2035
  • Figure 67: Middle East & Africa Market Attractiveness Analysis by End Use
  • Figure 68: Global Market - Tier Structure Analysis
  • Figure 69: Global Market - Company Share Analysis
Dashboard
Dashboard
Dashboard
Dashboard
Dashboard
Dashboard

Full Research Suite comprises of:

Market outlook & trends analysis

Market outlook & trends analysis

Interviews & case studies

Interviews & case studies

Strategic recommendations

Strategic recommendations

Vendor profiles & capabilities analysis

Vendor profiles & capabilities analysis

5-year forecasts

5-year forecasts

8 regions and 60+ country-level data splits

8 regions and 60+ country-level data splits

Market segment data splits

Market segment data splits

12 months of continuous data updates

12 months of continuous data updates

DELIVERED AS:

PDF EXCEL ONLINE

Full Research Suite


$3500

$5000

$6500

Buy Report Now
Similar Industry Reports

Similar Industry Reports

Green Pea Grits Market

Green Pea Grits Market

Pearl Liquid Market
Pearl Liquid Market

Pearl Liquid Market Size and Share Forecast Outlook 2025 to 2035

Pearl Eye Drops Market

Pearl Eye Drops Market Size and Share Forecast Outlook 2025 to 2035

Peak Shaving Construction Generator Sets Market

Peak Shaving Construction Generator Sets Market Size and Share Forecast Outlook 2025 to 2035

Pea Flakes Market
Pea Flakes Market

Pea Flakes Market Size and Share Forecast Outlook 2025 to 2035

Peanut Butter Market

Peanut Butter Market Analysis - Size, Share, and Forecast Outlook 2025 to 2035

Pea Protein Market
Pea Protein Market

Pea Protein Market Analysis - Size, Share, and Forecast Outlook 2025 to 2035

Pea Fiber Market
Pea Fiber Market

Pea Fiber Market Analysis – Size, Share, and Forecast Outlook 2025 to 2035

Peak Shaving Diesel Fueled Power Rental Market

Peak Shaving Diesel Fueled Power Rental Market Size and Share Forecast Outlook 2025 to 2035

Pea Starch Market
Pea Starch Market

Pea Starch Market Analysis - Size, Share, and Forecast Outlook 2025 to 2035

Pea Milk Market
Pea Milk Market

Pea Milk Market Growth - Industry Projections & Market Trends

Pearlescent Pigment Market

Pearlescent Pigment Market Growth - Trends & Forecast 2025 to 2035

Peanut Milk Market
Peanut Milk Market

Peanut Milk Market Analysis - Size, Share & Forecast 2025 to 2035

Peanut Butter Keto Snacks Market

Peanut Butter Keto Snacks Market Analysis - Trends & Growth 2025 to 2035

Pea Starch Concentrate Market

Pea Starch Concentrate Market Trends - Growth & Industry Forecast 2025 to 2035

Pea Protein Ingredients Market

Pea Protein Ingredients Market Insights - Plant-Based Nutrition Growth 2025 to 2035

Pea Flakes Market Share Analysis

Market Share Breakdown of Pea Flakes Manufacturers

Peanut Flour Market
Peanut Flour Market

Peanut Flour Market

Spear Phishing Market

Spear Phishing Market Size and Share Forecast Outlook 2025 to 2035

Spear Phishing Solutions Market

Spear Phishing Solutions Market Insights – Trends & Forecast through 2034

Future Market Insights

Pea Grits Market

Chat With MaRIA

Chat With

MaRIA

Hi There, I am MaRIA, Your Market Research Intelligence Assistant. How may I help you?