Pea Flakes Market Size and Share Forecast Outlook 2025 to 2035

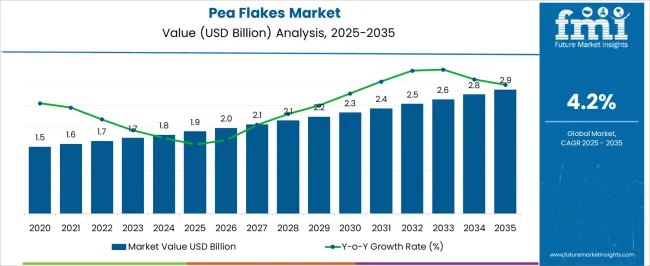
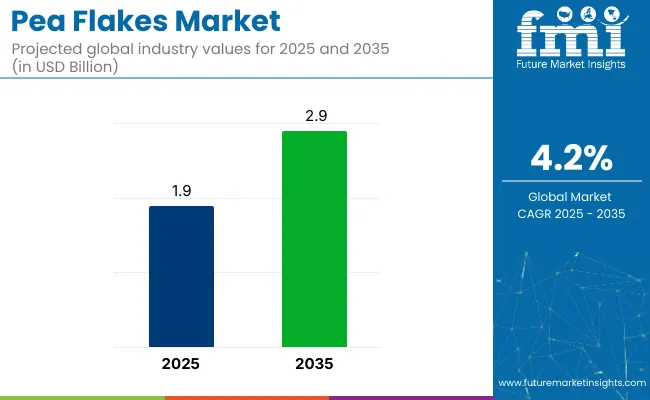
The global pea flakes market is valued at USD 1.9 billion in 2025 and is expected to reach USD 2.9 billion by 2035, reflecting a CAGR of 4.2%. Factors driving this growth include increasing awareness of the health benefits associated with pea flakes, their high nutritional content, and their growing adoption in both food products and pet food.
Quick Stats for Pea Flakes Market

  • Market Value (2025): USD 1.9 billion
  • Forecast Value (2035): USD 2.9 billion
  • Forecast CAGR: 4.2%
  • Type Leader in 2025: Yellow Pea Flakes (70% Market Share)
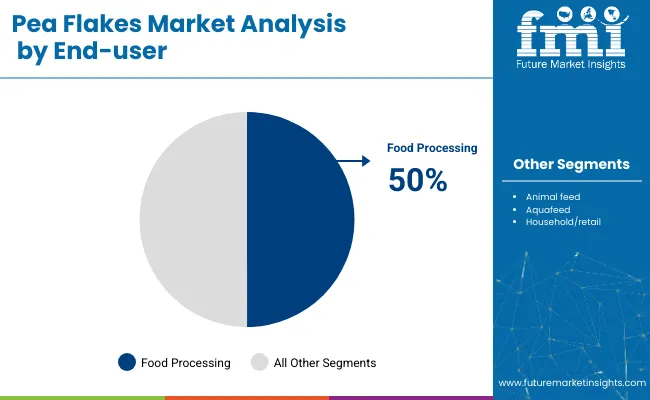
  • Top End-User:Food Processing (50% Market Share)
  • Key Growth Region:Asia-Pacific (fastest growing market in Japan with 4.6% CAGR)

Pea Flakes Market

Metric Value
Estimated Size (2025E) USD 1.9 billion
Projected Value (2035F) USD 2.9 billion
CAGR (2025 to 2035) 4.2%

The rise in health-conscious consumers opting for plant-based proteins and natural ingredients has significantly impacted the market. Moreover, the pet food industry's increasing demand for high-protein additives is expected to fuel market growth.

The North American region is expected to hold the largest market share,with the USA expected to continue to be the largest consumer of pea flakes due to the growing demand for healthy food and pet food products, growing 4.5%.

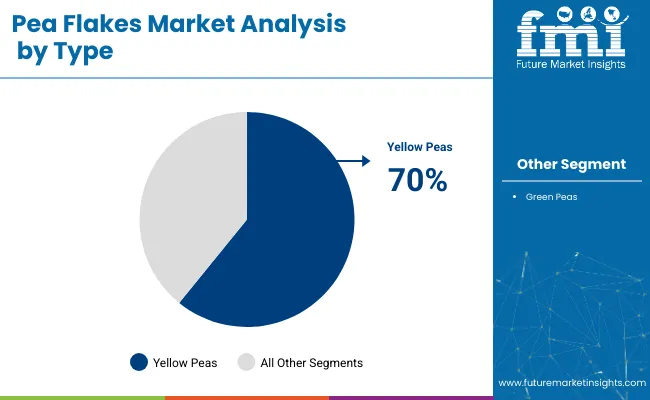
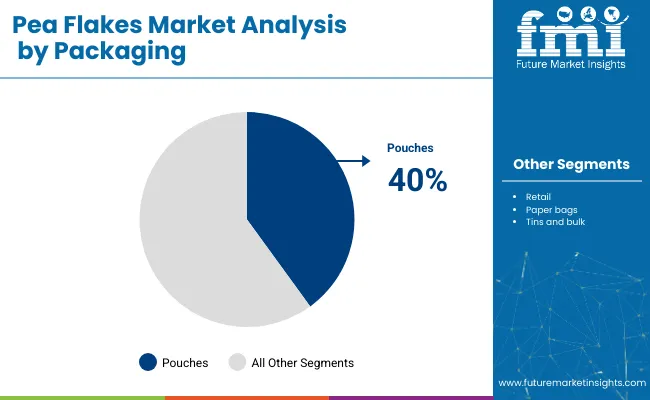
Meanwhile, Japan and Germany are anticipated to register the fastest growth with CAGRs of 4.6% and 4.2% respectively. By type, yellow peas are expected to lead with 70% of the market share. Meanwhile, Pouches by packaging type account for 40% of the market share in 2025.

The market holds a modest yet growing share across its parent markets. It accounts for approximately 6.2% of the plant-based protein market, reflecting its emerging role as a clean-label protein source. Within the pulse ingredients market, it captures around 7.8% share due to its high fiber and nutrient content.

In the broader functional food ingredients market, pea flakes hold about 3.4%, largely used in health-focused snacks and cereals. The market secures roughly 4.6% in the plant-based food market, driven by vegan trends. In the snack ingredients segment, its share is about 5.1%, supporting clean, high-protein snacking options.

The way forward for the pea flakes market includes a growing focus on sustainability and innovation. Manufacturers are increasingly incorporating organic and non-GMO claims into their products to attract health-conscious consumers.

Furthermore, government regulations on healthy food and nutrition are expected to play a significant role in shaping the market. As demand for plant-based proteins rises, manufacturers are expected to enhance their product offerings, focusing on clean-label and transparent production methods to meet the evolving preferences of consumers.

Analyzing Pea Flakes Market by Top Investment Segment

The market can be segmented based on various factors, including nature, type, end-user, packaging, distribution channel, and region. By nature, it is segmented into organic and conventional. By type, it is divided into yellow peas and green peas. By end-user, it is segmented into food processing, animal feed, aqua feed, and household/retail.

By packaging, it is segmented into retail, pouches, paper bags, tins and bulk. By distribution channel, it includes B2B/direct, B2C/indirect, supermarkets/hypermarkets, modern grocery stores, specialty stores, pet stores, and online retailers. By region, it covers North America, Latin America, Western Europe, Eastern Europe, Asia Pacific, East Asia, and MEA - Middle East & Africa.

By Nature, the Conventional Segment Accounts for 75% of the Market Share

The conventional segment continues to hold a dominant position in the pea flake market, accounting for 75% of the total market share in 2025. This dominance is attributed to its cost-effectiveness, large-scale availability, and widespread use in commercial livestock feed, aquaculture, and bulk pet food formulations. Conventional pea flakes remain the preferred choice in price-sensitive markets due to minimal certification requirements and streamlined supply chains.
  • Conventional pea flakes are widely used across livestock and poultry feed industries.
  • Lower production and sourcing costs favor conventional over organic.
  • Higher scalability supports large-volume commercial demand.
  • Particularly strong adoption in Asia, Latin America, and Eastern Europe.

By Type, Yellow Peas Account for 70% of the Market Share

Pea Flakes Market Analysis By Type

Yellow peas hold the largest share of 70% within the type segment, due to their higher nutritional value and popularity in protein-rich applications. Yellow peas are increasingly favored in pea flakes due to their higher protein content and superior digestibility. This has made them a staple in fitness and health-focused markets. Yellow pea flakes are also widely used in various food products, such as soups, salads, and snack foods, contributing to their dominant market position.
  • Yellow pea flakes are projected to account for the largest market share.
  • Yellow peas are a preferred source of plant-based protein.
  • Rising popularity in plant-based food alternatives further boosts demand.
  • Nutritional benefits make yellow peas popular among health-conscious consumers.

By End-User, the Food Processing Segment Accounts for 50% of the Market Share

Pea Flakes Market Analysis By End User

In the food processing segment, pea flakes are expected to dominate the end-user market with 50% of the market share. Their versatility as an ingredient in soups, salads, baked goods, and snacks contributes to this dominance. Increasing demand for healthy, plant-based ingredients in processed foods, especially those high in fiber and protein, is driving market growth.
  • Food processing is the leading end-user segment for pea flakes.
  • Rising demand for plant-based ingredients boosts pea flakes usage.
  • The trend toward functional and fortified foods is aiding growth.
  • Food manufacturers are incorporating pea flakes into various applications.

By Packaging, Pouches Account for 40% of the Market Share

Pea Flakes Market Analysis By Packaging

Pouches will lead the packaging segment due to their convenience, portability, and cost-effectiveness, accounting for 40% of the market share. Pouches are ideal for retail and household applications, offering a flexible, lightweight option for packaging pea flakes. This packaging type is gaining popularity as it helps in extending shelf life and is eco-friendly, meeting the increasing demand for sustainable packaging solutions.
  • Pouches are expected to be the most lucrative packaging type.
  • Their cost-effectiveness and convenience drive their growing market share.
  • Pouches are increasingly popular for e-commerce and retail distribution.

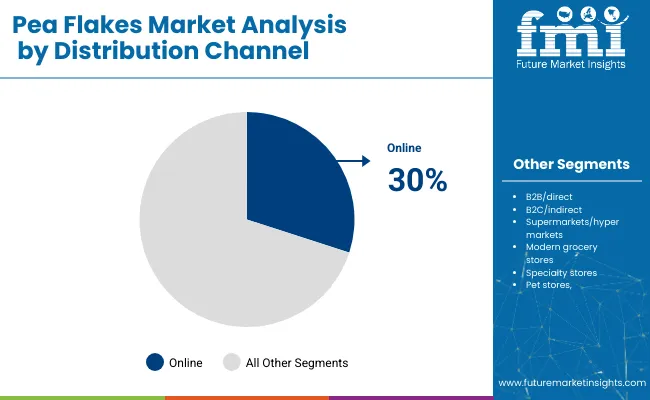
By Distribution Channel, Online Retailers Account for 30% of the Market Share

Pea Flakes Market Analysis By Distribution Channel

Online retailers are anticipated to capture the highest share of 30% in the distribution channel segment. E-commerce growth has fueled the rise of online shopping for food products, including pea flakes. The convenience of ordering online, coupled with the increasing availability of pea flakes through direct-to-consumer channels, makes online retail a preferred option.

  • Online retail is projected to capture the largest distribution channel share.
  • E-commerce platforms offer convenience and access to health-conscious consumers.
  • The growing trend of direct-to-consumer sales supports online retail growth.
  • Online shopping for healthy snacks and ingredients continues to rise.

Top Pea Flakes Market Dynamics

Recent Trends in Pea Flakes Market

  • Increasing demand for plant-based proteins drives the growth of pea flakes.
  • The rise in health-conscious consumers is propelling the popularity of organic pea flakes.
  • Sustainable and eco-friendly production methods are gaining traction among manufacturers.
  • E-commerce growth is boosting online retail for pea flakes, catering to a broader consumer base.

Challenges in the Pea Flakes Market

  • High production costs of organic pea flakes limit their widespread adoption.
  • Supply chain disruptions impact the availability of raw materials.
  • Consumer skepticism regarding the nutritional benefits of pea flakes in comparison to other plant-based alternatives.
  • The fluctuating prices of peas pose challenges to maintaining price stability.

Analyzing Top Countries Producing, Using and Supplying Pea Flakes

Country Wise Analysis Of Pea Flakes Market

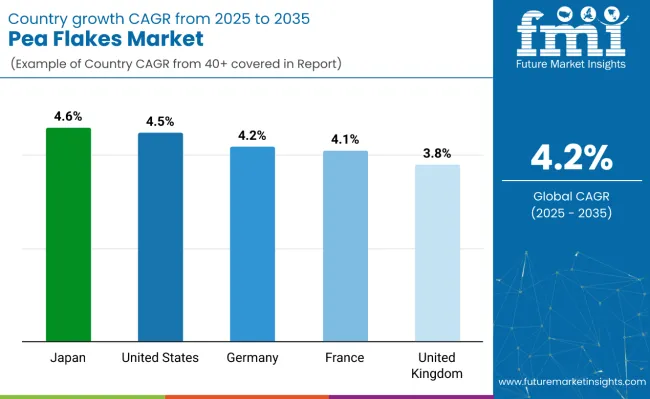
From 2025 to 2035, Japan is projected to lead the pea flakes market among the listed countries with the highest CAGR of 4.6%, driven by demand for protein-rich and functional foods. The USA follows closely with a CAGR of 4.5%, supported by a strong clean-label and plant-based movement.

Germany and France show steady growth at 4.2% and 4.1% respectively, fueled by sustainability and innovation in food processing. The UK records the lowest CAGR at 3.8%, although rising vegan trends and nutritional awareness are driving market interest. Overall, all five countries show positive momentum, with Asia slightly outpacing Western markets.
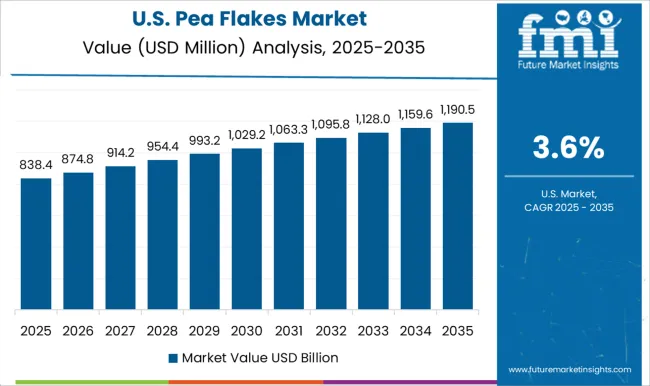
United States Pea Flakes Market Analysis

The revenue of pea flakes in the USA is projected to expand at a CAGR of 4.5% from 2025 to 2035. As the largest market for pea flakes, the USA is experiencing a surge in demand for plant-based ingredients due to rising health and sustainability concerns. Additionally, the growing preference for organic and non-GMO products is pushing the market forward. With a strong focus on fitness and clean-label foods, the USA remains a key player in the pea flakes market.

  • Rising demand for plant-based foods among health-conscious consumers.
  • Government policies supporting organic and sustainable farming practices.
  • Expanding e-commerce platforms catering to health-conscious buyers.

Pea Flakes Demand Analysis in the United Kingdom

The pea flakes market in the UK is expected to grow at a CAGR of 3.8% from 2025 to 2035. The increasing focus on plant-based diets and sustainability has led to a rise in demand for pea flakes. Consumers are gravitating toward high-protein, fiber-rich foods as part of their daily diets. The UK government’s initiatives promoting plant-based eating habits and reducing carbon footprints are further supporting the growth of pea flakes in the market.
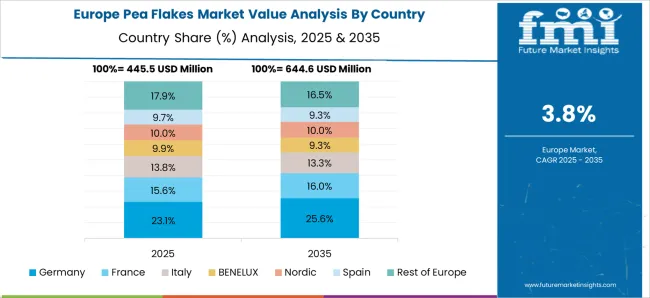
  • Strong shift towards vegan and plant-based diets.
  • Rise in consumer awareness regarding the nutritional benefits of pea flakes.
  • Expanding availability in both retail and online markets.

Germany Pea Flakes Sales Analysis

The sales of pea flakes in Germany are projected to flourish at a CAGR of 4.2% from 2025 to 2035. Germany is a leader in adopting sustainable and healthy food alternatives, and pea flakes are gaining traction among health-conscious consumers. The country's robust food processing industry contributes to the widespread use of pea flakes in various processed food products.

  • Strong preference for sustainable and organic food options.
  • Rising demand for plant-based protein sources.
  • Government support for food innovation and sustainability.

Pea Flakes Demand Analysis in France

The revenue from pea flakes in France is anticipated to grow at a CAGR of 4.1% from 2025 to 2035. As a major consumer of plant-based ingredients, France is witnessing increased use of pea flakes in food and beverages, especially in plant-based snacks and vegan products. The growing trend towards natural and functional foods is driving demand for pea flakes.

  • Increasing popularity of plant-based and organic foods.
  • Focus on eco-friendly packaging and sustainable production.
  • Rapidly growing retail channels offering plant-based products.

Japan Pea Flakes Market Analysis

The pea flakes market in Japan is predicted to rise at a CAGR of 4.6% from 2025 to 2035. Japan has seen significant growth in demand for healthy, protein-rich ingredients like pea flakes, particularly as part of its health-conscious and aging population. The market is being driven by the rise in functional foods and increasing awareness of plant-based proteins as a viable alternative to meat.
  • Increasing health awareness among Japan’s aging population.
  • Rising popularity of functional and protein-enriched foods.
  • Expansion of plant-based food products in mainstream retail markets.

Leading Pea Flakes Suppliers

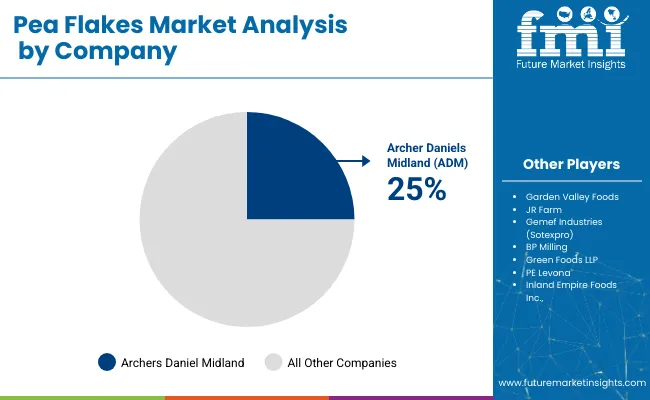
Pea Flakes Market Analysis By Company

The pea flakes market is moderately fragmented, with numerous key players competing to capture a significant portion of the market. Companies such as Garden Valley Foods, JR Farm, Gemef Industries (Sotexpro), BP Milling, Green Foods LLP, and PE Levona are leading the way, focusing on sustainable production methods and diversifying their product portfolios to cater to the growing demand for plant-based, organic ingredients.

These suppliers are competing through product innovation, strategic partnerships, and expanding their geographical footprint to meet the increasing consumer demand for nutritious, eco-friendly products in both the food and pet food sectors.

Top companies in the pea flakes market are increasingly leveraging pricing strategies, cutting-edge product innovations, and expanding their production capacity to stay competitive. Additionally, partnerships and collaborations with food processing and pet food manufacturers are helping them enhance their market presence.

These companies are also investing in expanding their direct-to-consumer sales channels, particularly through e-commerce platforms, to tap into the growing demand for healthy and functional foods. Furthermore, firms like Danone and Nutiva Inc. are focusing on organic and non-GMO certifications to align with consumer preferences for clean-label products.

Recent Pea Flakes Industry News

Danone, through its plant-based brand Alpro, launched a new product line in 2025 specifically targeted at children, addressing parental concerns about healthy food choices. Alpro’s expansion into child-focused plant-based foods reflects Danone’s ongoing strategy to diversify its product offerings and meet growing demand for nutritious, plant-based options in Europe.

Nutiva Inc. is identified as a leading company in the 2025 global pea flakes market report. The company is known for its commitment to organic, non-GMO, and plant-based ingredients, and its pea-based products are positioned to capitalize on the rising demand for clean-label, allergen-free, and protein-rich foods.

Pea Flakes Market Report Scope

Report Attributes Details
Current Total Market Size (2025) USD 1.9 billion
Projected Market Size (2035) USD 2 .9 billion
CAGR (2025 to 2035) 4.2%
Base Year for Estimation 2024
Historical Period 2020 to 2024
Projections Period 2025 to 2035
Market Analysis Parameters Revenue in USD billions/Volume in kilotons
By Nature Organic, Conventional
By Type Yellow Peas, Green Peas
By End-User Food Processing, Animal Feed, Aqua Feed, Household/Retail
By Packaging Retail, Pouches, Paper Bags, Tins, Bulk
By Distribution Channel B2B/Direct, B2C/Indirect, Supermarkets/Hypermarkets, Modern Grocery Stores, Specialty Stores, Pet Stores, Online Retailers
Regions Covered North America, Latin America, Western Europe, Eastern Europe, Asia Pacific, East Asia, MEA (Middle East & Africa)
Countries Covered United States, Canada, United Kingdom, Germany, France, China, Japan, South Korea, Brazil, Australia and 40+ Countries
Key Players Garden Valley Foods, JR Farm, Gemef Industries (Sotexpro), BP Milling, Green Foods LLP, PE Levona, Inland Empire Foods Inc., Inland Empire Foods, Wheeeky Pets, Nutiva Inc., The Simply Good Food Co., Danone SA, Orgain Inc.
Additional Attributes Dollar sales by value, market share analysis by segments, and country-wise analysis

Key Segmentation

By Nature:

  • Organic
  • Conventional

By Type:

  • Yellow Peas
  • Green Peas

By End Use:

  • Food Processing
  • Animal Feed
  • Aqua Feed
  • Household/Retail

By Packaging:

  • Retail
  • Pouches
  • Paper Bags
  • Tins
  • Bulk

By Distribution Channel:

  • B2B/Direct
  • B2C/Indirect
  • Supermarkets/Hypermarkets
  • Modern Grocery Stores
  • Specialty Stores
  • Pet Stores
  • Online Retailers

By Region:

  • North America
  • Latin America
  • Europe
  • East Asia
  • South Asia
  • Oceania
  • Middle East & Africa

Table of Content

  1. Executive Summary
    • Global Market Outlook
    • Demand-side Trends
    • Supply-side Trends
    • Technology Roadmap Analysis
    • Analysis and Recommendations
  2. Market Overview
    • Market Coverage/Taxonomy
    • Market Definition/Scope/Limitations
  3. Market Background
    • Market Dynamics
      • Drivers
      • Restraints
      • Opportunity
      • Trends
    • Scenario Forecast
      • Demand in Optimistic Scenario
      • Demand in Likely Scenario
      • Demand in Conservative Scenario
    • Opportunity Map Analysis
    • Product Life Cycle Analysis
    • Supply Chain Analysis
      • Supply Side Participants and their Roles
        • Producers
        • Mid-Level Participants (Traders/ Agents/ Brokers)
        • Wholesalers and Distributors
      • Value Added and Value Created at Node in the Supply Chain
      • List of Raw Material Suppliers
      • List of Existing and Potential Buyer’s
    • Investment Feasibility Matrix
    • Value Chain Analysis
      • Profit Margin Analysis
      • Wholesalers and Distributors
      • Retailers
    • PESTLE and Porter’s Analysis
    • Regulatory Landscape
      • By Key Regions
      • By Key Countries
    • Regional Parent Market Outlook
    • Production and Consumption Statistics
    • Import and Export Statistics
  4. Global Market Analysis 2020 to 2024 and Forecast, 2025 to 2035
    • Historical Market Size Value (USD Billion) & Volume (kilotons) Analysis, 2020 to 2024
    • Current and Future Market Size Value (USD Billion) & Volume (kilotons) Projections, 2025 to 2035
      • Y-o-Y Growth Trend Analysis
      • Absolute $ Opportunity Analysis
  5. Global Market Pricing Analysis 2020 to 2024 and Forecast 2025 to 2035
  6. Global Market Analysis 2020 to 2024 and Forecast 2025 to 2035, By Nature
    • Introduction/Key Findings
    • Historical Market Size Value (USD Billion) & Volume (kilotons) Analysis By Nature, 2020 to 2024
    • Current and Future Market Size Value (USD Billion) & Volume (kilotons) Analysis and Forecast By Nature, 2025 to 2035
      • Organic
      • Conventional
    • Y-o-Y Growth Trend Analysis By Nature, 2020 to 2024
    • Absolute $ Opportunity Analysis By Nature, 2025 to 2035
  7. Global Market Analysis 2020 to 2024 and Forecast 2025 to 2035, By Type
    • Introduction/Key Findings
    • Historical Market Size Value (USD Billion) & Volume (kilotons) Analysis By Type, 2020 to 2024
    • Current and Future Market Size Value (USD Billion) & Volume (kilotons) Analysis and Forecast By Type, 2025 to 2035
      • Yellow Peas
      • Green Peas
    • Y-o-Y Growth Trend Analysis By Type, 2020 to 2024
    • Absolute $ Opportunity Analysis By Type, 2025 to 2035
  8. Global Market Analysis 2020 to 2024 and Forecast 2025 to 2035, By End-User
    • Introduction/Key Findings
    • Historical Market Size Value (USD Billion) & Volume (kilotons) Analysis By End-User, 2020 to 2024
    • Current and Future Market Size Value (USD Billion) & Volume (kilotons) Analysis and Forecast By End-User, 2025 to 2035
      • Food Processing
      • Animal Feed
      • Aqua Feed
      • Household/Retail
    • Y-o-Y Growth Trend Analysis By End-User, 2020 to 2024
    • Absolute $ Opportunity Analysis By End-User, 2025 to 2035
  9. Global Market Analysis 2020 to 2024 and Forecast 2025 to 2035, By Packaging
    • Introduction/Key Findings
    • Historical Market Size Value (USD Billion) & Volume (kilotons) Analysis By Packaging, 2020 to 2024
    • Current and Future Market Size Value (USD Billion) & Volume (kilotons) Analysis and Forecast By Packaging, 2025 to 2035
      • Retail
      • Pouches
      • Paper Bags
      • Tins
      • Bulk
    • Y-o-Y Growth Trend Analysis By Packaging, 2020 to 2024
    • Absolute $ Opportunity Analysis By Packaging, 2025 to 2035
  10. Global Market Analysis 2020 to 2024 and Forecast 2025 to 2035, By Distribution Channel
    • Introduction/Key Findings
    • Historical Market Size Value (USD Billion) & Volume (kilotons) Analysis By Distribution Channel, 2020 to 2024
    • Current and Future Market Size Value (USD Billion) & Volume (kilotons) Analysis and Forecast By Distribution Channel, 2025 to 2035
      • B2B/Direct
      • B2C/Indirect
      • Supermarkets/Hypermarkets
      • Modern Grocery Stores
      • Specialty Stores
      • Pet Stores
      • Online Retailers
    • Y-o-Y Growth Trend Analysis By Distribution Channel, 2020 to 2024
    • Absolute $ Opportunity Analysis By Distribution Channel, 2025 to 2035
  11. Global Market Analysis 2020 to 2024 and Forecast 2025 to 2035, By Region
    • Introduction
    • Historical Market Size Value (USD Billion) & Volume (kilotons) Analysis By Region, 2020 to 2024
    • Current Market Size Value (USD Billion) & Volume (kilotons) Analysis and Forecast By Region, 2025 to 2035
      • North America
      • Latin America
      • Western Europe
      • Eastern Europe
      • East Asia
      • South Asia & Pacific
      • Middle East and Africa
    • Market Attractiveness Analysis By Region
  12. North America Market Analysis 2020 to 2024 and Forecast 2025 to 2035, By Country
    • Historical Market Size Value (USD Billion) & Volume (kilotons) Trend Analysis By Market Taxonomy, 2020 to 2024
    • Market Size Value (USD Billion) & Volume (kilotons) Forecast By Market Taxonomy, 2025 to 2035
      • By Country
        • USA
        • Canada
        • Mexico
      • By Nature
      • By Type
      • By End-User
      • By Packaging
      • By Distribution Channel
    • Market Attractiveness Analysis
      • By Country
      • By Nature
      • By Type
      • By End-User
      • By Packaging
      • By Distribution Channel
    • Key Takeaways
  13. Latin America Market Analysis 2020 to 2024 and Forecast 2025 to 2035, By Country
    • Historical Market Size Value (USD Billion) & Volume (kilotons) Trend Analysis By Market Taxonomy, 2020 to 2024
    • Market Size Value (USD Billion) & Volume (kilotons) Forecast By Market Taxonomy, 2025 to 2035
      • By Country
        • Brazil
        • Argentina
        • Rest of LATAM
      • By Nature
      • By Type
      • By End-User
      • By Packaging
      • By Distribution Channel
    • Market Attractiveness Analysis
      • By Country
      • By Nature
      • By Type
      • By End-User
      • By Packaging
      • By Distribution Channel
    • Key Takeaways
  14. Western Europe Market Analysis 2020 to 2024 and Forecast 2025 to 2035, By Country
    • Historical Market Size Value (USD Billion) & Volume (kilotons) Trend Analysis By Market Taxonomy, 2020 to 2024
    • Market Size Value (USD Billion) & Volume (kilotons) Forecast By Market Taxonomy, 2025 to 2035
      • By Country
        • Germany
        • Italy
        • France
        • UK
        • Spain
        • BENELUX
        • Nordic
        • Rest of W.Europe
      • By Nature
      • By Type
      • By End-User
      • By Packaging
      • By Distribution Channel
    • Market Attractiveness Analysis
      • By Country
      • By Nature
      • By Type
      • By End-User
      • By Packaging
      • By Distribution Channel
    • Key Takeaways
  15. Eastern Europe Market Analysis 2020 to 2024 and Forecast 2025 to 2035, By Country
    • Historical Market Size Value (USD Billion) & Volume (kilotons) Trend Analysis By Market Taxonomy, 2020 to 2024
    • Market Size Value (USD Billion) & Volume (kilotons) Forecast By Market Taxonomy, 2025 to 2035
      • By Country
        • Russia
        • Hungary
        • Poland
        • Balkan & Baltics
        • Rest of E. Europe
      • By Nature
      • By Type
      • By End-User
      • By Packaging
      • By Distribution Channel
    • Market Attractiveness Analysis
      • By Country
      • By Nature
      • By Type
      • By End-User
      • By Packaging
      • By Distribution Channel
    • Key Takeaways
  16. East Asia Market Analysis 2020 to 2024 and Forecast 2025 to 2035, By Country
    • Historical Market Size Value (USD Billion) & Volume (kilotons) Trend Analysis By Market Taxonomy, 2020 to 2024
    • Market Size Value (USD Billion) & Volume (kilotons) Forecast By Market Taxonomy, 2025 to 2035
      • By Country
        • China
        • Japan
        • South Korea
      • By Nature
      • By Type
      • By End-User
      • By Packaging
      • By Distribution Channel
    • Market Attractiveness Analysis
      • By Country
      • By Nature
      • By Type
      • By End-User
      • By Packaging
      • By Distribution Channel
    • Key Takeaways
  17. South Asia & Pacific Market Analysis 2020 to 2024 and Forecast 2025 to 2035, By Country
    • Historical Market Size Value (USD Billion) & Volume (kilotons) Trend Analysis By Market Taxonomy, 2020 to 2024
    • Market Size Value (USD Billion) & Volume (kilotons) Forecast By Market Taxonomy, 2025 to 2035
      • By Country
        • India
        • Australia & New Zealand
        • ASEAN
        • Rest of SAP
      • By Nature
      • By Type
      • By End-User
      • By Packaging
      • By Distribution Channel
    • Market Attractiveness Analysis
      • By Country
      • By Nature
      • By Type
      • By End-User
      • By Packaging
      • By Distribution Channel
    • Key Takeaways
  18. Middle East and Africa Market Analysis 2020 to 2024 and Forecast 2025 to 2035, By Country
    • Historical Market Size Value (USD Billion) & Volume (kilotons) Trend Analysis By Market Taxonomy, 2020 to 2024
    • Market Size Value (USD Billion) & Volume (kilotons) Forecast By Market Taxonomy, 2025 to 2035
      • By Country
        • GCC Countries
        • Northern Africa
        • South Africa
        • Turkiye
        • Rest of MEA
      • By Nature
      • By Type
      • By End-User
      • By Packaging
      • By Distribution Channel
    • Market Attractiveness Analysis
      • By Country
      • By Nature
      • By Type
      • By End-User
      • By Packaging
      • By Distribution Channel
    • Key Takeaways
  19. Key Countries Market Analysis
    • USA
      • Pricing Analysis
      • Market Share Analysis, 2024
        • By Nature
        • By Type
        • By End-User
        • By Packaging
        • By Distribution Channel
    • Canada
      • Pricing Analysis
      • Market Share Analysis, 2024
        • By Nature
        • By Type
        • By End-User
        • By Packaging
        • By Distribution Channel
    • Brazil
      • Pricing Analysis
      • Market Share Analysis, 2024
        • By Nature
        • By Type
        • By End-User
        • By Packaging
        • By Distribution Channel
    • Mexico
      • Pricing Analysis
      • Market Share Analysis, 2024
        • By Nature
        • By Type
        • By End-User
        • By Packaging
        • By Distribution Channel
    • Argentina
      • Pricing Analysis
      • Market Share Analysis, 2024
        • By Nature
        • By Type
        • By End-User
        • By Packaging
        • By Distribution Channel
  20. Market Structure Analysis
    • Competition Dashboard
    • Competition Benchmarking
    • Market Share Analysis of Top Players
      • By Regional
      • By Nature
      • By Type
      • By End-User
      • By Packaging
      • By Distribution Channel
  21. Competition Analysis
    • Competition Deep Dive
      • Garden Valley Foods
        • Overview
        • Product Portfolio
        • Profitability by Market Segments (Product/Age /Sales Channel/Region)
        • Sales Footprint
        • Strategy Overview
          • Marketing Strategy
          • Product Strategy
          • Channel Strategy
      • JR Farm
        • Overview
        • Product Portfolio
        • Profitability by Market Segments (Product/Age /Sales Channel/Region)
        • Sales Footprint
        • Strategy Overview
          • Marketing Strategy
          • Product Strategy
          • Channel Strategy
      • Gemef Industries (Sotexpro)
        • Overview
        • Product Portfolio
        • Profitability by Market Segments (Product/Age /Sales Channel/Region)
        • Sales Footprint
        • Strategy Overview
          • Marketing Strategy
          • Product Strategy
          • Channel Strategy
      • BP Milling
        • Overview
        • Product Portfolio
        • Profitability by Market Segments (Product/Age /Sales Channel/Region)
        • Sales Footprint
        • Strategy Overview
          • Marketing Strategy
          • Product Strategy
          • Channel Strategy
      • Green Foods LLP
        • Overview
        • Product Portfolio
        • Profitability by Market Segments (Product/Age /Sales Channel/Region)
        • Sales Footprint
        • Strategy Overview
          • Marketing Strategy
          • Product Strategy
          • Channel Strategy
      • PE Levona
        • Overview
        • Product Portfolio
        • Profitability by Market Segments (Product/Age /Sales Channel/Region)
        • Sales Footprint
        • Strategy Overview
          • Marketing Strategy
          • Product Strategy
          • Channel Strategy
      • Inland Empire Foods Inc.
        • Overview
        • Product Portfolio
        • Profitability by Market Segments (Product/Age /Sales Channel/Region)
        • Sales Footprint
        • Strategy Overview
          • Marketing Strategy
          • Product Strategy
          • Channel Strategy
      • Inland Empire Foods
        • Overview
        • Product Portfolio
        • Profitability by Market Segments (Product/Age /Sales Channel/Region)
        • Sales Footprint
        • Strategy Overview
          • Marketing Strategy
          • Product Strategy
          • Channel Strategy
      • Wheeeky Pets
        • Overview
        • Product Portfolio
        • Profitability by Market Segments (Product/Age /Sales Channel/Region)
        • Sales Footprint
        • Strategy Overview
          • Marketing Strategy
          • Product Strategy
          • Channel Strategy
      • Nutiva Inc.
        • Overview
        • Product Portfolio
        • Profitability by Market Segments (Product/Age /Sales Channel/Region)
        • Sales Footprint
        • Strategy Overview
          • Marketing Strategy
          • Product Strategy
          • Channel Strategy
      • The Simply Good Food Co.
        • Overview
        • Product Portfolio
        • Profitability by Market Segments (Product/Age /Sales Channel/Region)
        • Sales Footprint
        • Strategy Overview
          • Marketing Strategy
          • Product Strategy
          • Channel Strategy
      • Danone SA
        • Overview
        • Product Portfolio
        • Profitability by Market Segments (Product/Age /Sales Channel/Region)
        • Sales Footprint
        • Strategy Overview
          • Marketing Strategy
          • Product Strategy
          • Channel Strategy
      • Orgain Inc.
        • Overview
        • Product Portfolio
        • Profitability by Market Segments (Product/Age /Sales Channel/Region)
        • Sales Footprint
        • Strategy Overview
          • Marketing Strategy
          • Product Strategy
          • Channel Strategy
  22. Assumptions & Acronyms Used
  23. Research Methodology

List of Tables

  • Table 1: Global Market Value (USD Billion) Forecast by Region, 2020-2035
  • Table 2: Global Market Volume (kilotons) Forecast by Region, 2020-2035
  • Table 3: Global Market Value (USD Billion) Forecast by Nature, 2020-2035
  • Table 4: Global Market Volume (kilotons) Forecast by Nature, 2020-2035
  • Table 5: Global Market Value (USD Billion) Forecast by Type, 2020-2035
  • Table 6: Global Market Volume (kilotons) Forecast by Type, 2020-2035
  • Table 7: Global Market Value (USD Billion) Forecast by End-User, 2020-2035
  • Table 8: Global Market Volume (kilotons) Forecast by End-User, 2020-2035
  • Table 9: Global Market Value (USD Billion) Forecast by Packaging, 2020-2035
  • Table 10: Global Market Volume (kilotons) Forecast by Packaging, 2020-2035
  • Table 11: Global Market Value (USD Billion) Forecast by Distribution Channel, 2020-2035
  • Table 12: Global Market Volume (kilotons) Forecast by Distribution Channel, 2020-2035
  • Table 13: North America Market Value (USD Billion) Forecast by Country, 2020-2035
  • Table 14: North America Market Volume (kilotons) Forecast by Country, 2020-2035
  • Table 15: North America Market Value (USD Billion) Forecast by Nature, 2020-2035
  • Table 16: North America Market Volume (kilotons) Forecast by Nature, 2020-2035
  • Table 17: North America Market Value (USD Billion) Forecast by Type, 2020-2035
  • Table 18: North America Market Volume (kilotons) Forecast by Type, 2020-2035
  • Table 19: North America Market Value (USD Billion) Forecast by End-User, 2020-2035
  • Table 20: North America Market Volume (kilotons) Forecast by End-User, 2020-2035
  • Table 21: North America Market Value (USD Billion) Forecast by Packaging, 2020-2035
  • Table 22: North America Market Volume (kilotons) Forecast by Packaging, 2020-2035
  • Table 23: North America Market Value (USD Billion) Forecast by Distribution Channel, 2020-2035
  • Table 24: North America Market Volume (kilotons) Forecast by Distribution Channel, 2020-2035
  • Table 25: Latin America Market Value (USD Billion) Forecast by Country, 2020-2035
  • Table 26: Latin America Market Volume (kilotons) Forecast by Country, 2020-2035
  • Table 27: Latin America Market Value (USD Billion) Forecast by Nature, 2020-2035
  • Table 28: Latin America Market Volume (kilotons) Forecast by Nature, 2020-2035
  • Table 29: Latin America Market Value (USD Billion) Forecast by Type, 2020-2035
  • Table 30: Latin America Market Volume (kilotons) Forecast by Type, 2020-2035
  • Table 31: Latin America Market Value (USD Billion) Forecast by End-User, 2020-2035
  • Table 32: Latin America Market Volume (kilotons) Forecast by End-User, 2020-2035
  • Table 33: Latin America Market Value (USD Billion) Forecast by Packaging, 2020-2035
  • Table 34: Latin America Market Volume (kilotons) Forecast by Packaging, 2020-2035
  • Table 35: Latin America Market Value (USD Billion) Forecast by Distribution Channel, 2020-2035
  • Table 36: Latin America Market Volume (kilotons) Forecast by Distribution Channel, 2020-2035
  • Table 37: Western Europe Market Value (USD Billion) Forecast by Country, 2020-2035
  • Table 38: Western Europe Market Volume (kilotons) Forecast by Country, 2020-2035
  • Table 39: Western Europe Market Value (USD Billion) Forecast by Nature, 2020-2035
  • Table 40: Western Europe Market Volume (kilotons) Forecast by Nature, 2020-2035
  • Table 41: Western Europe Market Value (USD Billion) Forecast by Type, 2020-2035
  • Table 42: Western Europe Market Volume (kilotons) Forecast by Type, 2020-2035
  • Table 43: Western Europe Market Value (USD Billion) Forecast by End-User, 2020-2035
  • Table 44: Western Europe Market Volume (kilotons) Forecast by End-User, 2020-2035
  • Table 45: Western Europe Market Value (USD Billion) Forecast by Packaging, 2020-2035
  • Table 46: Western Europe Market Volume (kilotons) Forecast by Packaging, 2020-2035
  • Table 47: Western Europe Market Value (USD Billion) Forecast by Distribution Channel, 2020-2035
  • Table 48: Western Europe Market Volume (kilotons) Forecast by Distribution Channel, 2020-2035
  • Table 49: Eastern Europe Market Value (USD Billion) Forecast by Country, 2020-2035
  • Table 50: Eastern Europe Market Volume (kilotons) Forecast by Country, 2020-2035
  • Table 51: Eastern Europe Market Value (USD Billion) Forecast by Nature, 2020-2035
  • Table 52: Eastern Europe Market Volume (kilotons) Forecast by Nature, 2020-2035
  • Table 53: Eastern Europe Market Value (USD Billion) Forecast by Type, 2020-2035
  • Table 54: Eastern Europe Market Volume (kilotons) Forecast by Type, 2020-2035
  • Table 55: Eastern Europe Market Value (USD Billion) Forecast by End-User, 2020-2035
  • Table 56: Eastern Europe Market Volume (kilotons) Forecast by End-User, 2020-2035
  • Table 57: Eastern Europe Market Value (USD Billion) Forecast by Packaging, 2020-2035
  • Table 58: Eastern Europe Market Volume (kilotons) Forecast by Packaging, 2020-2035
  • Table 59: Eastern Europe Market Value (USD Billion) Forecast by Distribution Channel, 2020-2035
  • Table 60: Eastern Europe Market Volume (kilotons) Forecast by Distribution Channel, 2020-2035
  • Table 61: East Asia Market Value (USD Billion) Forecast by Country, 2020-2035
  • Table 62: East Asia Market Volume (kilotons) Forecast by Country, 2020-2035
  • Table 63: East Asia Market Value (USD Billion) Forecast by Nature, 2020-2035
  • Table 64: East Asia Market Volume (kilotons) Forecast by Nature, 2020-2035
  • Table 65: East Asia Market Value (USD Billion) Forecast by Type, 2020-2035
  • Table 66: East Asia Market Volume (kilotons) Forecast by Type, 2020-2035
  • Table 67: East Asia Market Value (USD Billion) Forecast by End-User, 2020-2035
  • Table 68: East Asia Market Volume (kilotons) Forecast by End-User, 2020-2035
  • Table 69: East Asia Market Value (USD Billion) Forecast by Packaging, 2020-2035
  • Table 70: East Asia Market Volume (kilotons) Forecast by Packaging, 2020-2035
  • Table 71: East Asia Market Value (USD Billion) Forecast by Distribution Channel, 2020-2035
  • Table 72: East Asia Market Volume (kilotons) Forecast by Distribution Channel, 2020-2035
  • Table 73: South Asia & Pacific Market Value (USD Billion) Forecast by Country, 2020-2035
  • Table 74: South Asia & Pacific Market Volume (kilotons) Forecast by Country, 2020-2035
  • Table 75: South Asia & Pacific Market Value (USD Billion) Forecast by Nature, 2020-2035
  • Table 76: South Asia & Pacific Market Volume (kilotons) Forecast by Nature, 2020-2035
  • Table 77: South Asia & Pacific Market Value (USD Billion) Forecast by Type, 2020-2035
  • Table 78: South Asia & Pacific Market Volume (kilotons) Forecast by Type, 2020-2035
  • Table 79: South Asia & Pacific Market Value (USD Billion) Forecast by End-User, 2020-2035
  • Table 80: South Asia & Pacific Market Volume (kilotons) Forecast by End-User, 2020-2035
  • Table 81: South Asia & Pacific Market Value (USD Billion) Forecast by Packaging, 2020-2035
  • Table 82: South Asia & Pacific Market Volume (kilotons) Forecast by Packaging, 2020-2035
  • Table 83: South Asia & Pacific Market Value (USD Billion) Forecast by Distribution Channel, 2020-2035
  • Table 84: South Asia & Pacific Market Volume (kilotons) Forecast by Distribution Channel, 2020-2035
  • Table 85: Middle East and Africa Market Value (USD Billion) Forecast by Country, 2020-2035
  • Table 86: Middle East and Africa Market Volume (kilotons) Forecast by Country, 2020-2035
  • Table 87: Middle East and Africa Market Value (USD Billion) Forecast by Nature, 2020-2035
  • Table 88: Middle East and Africa Market Volume (kilotons) Forecast by Nature, 2020-2035
  • Table 89: Middle East and Africa Market Value (USD Billion) Forecast by Type, 2020-2035
  • Table 90: Middle East and Africa Market Volume (kilotons) Forecast by Type, 2020-2035
  • Table 91: Middle East and Africa Market Value (USD Billion) Forecast by End-User, 2020-2035
  • Table 92: Middle East and Africa Market Volume (kilotons) Forecast by End-User, 2020-2035
  • Table 93: Middle East and Africa Market Value (USD Billion) Forecast by Packaging, 2020-2035
  • Table 94: Middle East and Africa Market Volume (kilotons) Forecast by Packaging, 2020-2035
  • Table 95: Middle East and Africa Market Value (USD Billion) Forecast by Distribution Channel, 2020-2035
  • Table 96: Middle East and Africa Market Volume (kilotons) Forecast by Distribution Channel, 2020-2035

List of Figures

  • Figure 1: Global Market Volume (kilotons) Forecast 2020-2035
  • Figure 2: Global Market Pricing Analysis
  • Figure 3: Global Market Value (USD Billion) Forecast 2020-2035
  • Figure 4: Global Market Value Share and BPS Analysis by Nature, 2025 and 2035
  • Figure 5: Global Market Y-o-Y Growth Comparison by Nature, 2025-2035
  • Figure 6: Global Market Attractiveness Analysis by Nature
  • Figure 7: Global Market Value Share and BPS Analysis by Type, 2025 and 2035
  • Figure 8: Global Market Y-o-Y Growth Comparison by Type, 2025-2035
  • Figure 9: Global Market Attractiveness Analysis by Type
  • Figure 10: Global Market Value Share and BPS Analysis by End-User, 2025 and 2035
  • Figure 11: Global Market Y-o-Y Growth Comparison by End-User, 2025-2035
  • Figure 12: Global Market Attractiveness Analysis by End-User
  • Figure 13: Global Market Value Share and BPS Analysis by Packaging, 2025 and 2035
  • Figure 14: Global Market Y-o-Y Growth Comparison by Packaging, 2025-2035
  • Figure 15: Global Market Attractiveness Analysis by Packaging
  • Figure 16: Global Market Value Share and BPS Analysis by Distribution Channel, 2025 and 2035
  • Figure 17: Global Market Y-o-Y Growth Comparison by Distribution Channel, 2025-2035
  • Figure 18: Global Market Attractiveness Analysis by Distribution Channel
  • Figure 19: Global Market Value (USD Billion) Share and BPS Analysis by Region, 2025 and 2035
  • Figure 20: Global Market Y-o-Y Growth Comparison by Region, 2025-2035
  • Figure 21: Global Market Attractiveness Analysis by Region
  • Figure 22: North America Market Incremental $ Opportunity, 2025-2035
  • Figure 23: Latin America Market Incremental $ Opportunity, 2025-2035
  • Figure 24: Western Europe Market Incremental $ Opportunity, 2025-2035
  • Figure 25: Eastern Europe Market Incremental $ Opportunity, 2025-2035
  • Figure 26: East Asia Market Incremental $ Opportunity, 2025-2035
  • Figure 27: South Asia & Pacific Market Incremental $ Opportunity, 2025-2035
  • Figure 28: Middle East and Africa Market Incremental $ Opportunity, 2025-2035
  • Figure 29: North America Market Value Share and BPS Analysis by Country, 2025 and 2035
  • Figure 30: North America Market Value Share and BPS Analysis by Nature, 2025 and 2035
  • Figure 31: North America Market Y-o-Y Growth Comparison by Nature, 2025-2035
  • Figure 32: North America Market Attractiveness Analysis by Nature
  • Figure 33: North America Market Value Share and BPS Analysis by Type, 2025 and 2035
  • Figure 34: North America Market Y-o-Y Growth Comparison by Type, 2025-2035
  • Figure 35: North America Market Attractiveness Analysis by Type
  • Figure 36: North America Market Value Share and BPS Analysis by End-User, 2025 and 2035
  • Figure 37: North America Market Y-o-Y Growth Comparison by End-User, 2025-2035
  • Figure 38: North America Market Attractiveness Analysis by End-User
  • Figure 39: North America Market Value Share and BPS Analysis by Packaging, 2025 and 2035
  • Figure 40: North America Market Y-o-Y Growth Comparison by Packaging, 2025-2035
  • Figure 41: North America Market Attractiveness Analysis by Packaging
  • Figure 42: North America Market Value Share and BPS Analysis by Distribution Channel, 2025 and 2035
  • Figure 43: North America Market Y-o-Y Growth Comparison by Distribution Channel, 2025-2035
  • Figure 44: North America Market Attractiveness Analysis by Distribution Channel
  • Figure 45: Latin America Market Value Share and BPS Analysis by Country, 2025 and 2035
  • Figure 46: Latin America Market Value Share and BPS Analysis by Nature, 2025 and 2035
  • Figure 47: Latin America Market Y-o-Y Growth Comparison by Nature, 2025-2035
  • Figure 48: Latin America Market Attractiveness Analysis by Nature
  • Figure 49: Latin America Market Value Share and BPS Analysis by Type, 2025 and 2035
  • Figure 50: Latin America Market Y-o-Y Growth Comparison by Type, 2025-2035
  • Figure 51: Latin America Market Attractiveness Analysis by Type
  • Figure 52: Latin America Market Value Share and BPS Analysis by End-User, 2025 and 2035
  • Figure 53: Latin America Market Y-o-Y Growth Comparison by End-User, 2025-2035
  • Figure 54: Latin America Market Attractiveness Analysis by End-User
  • Figure 55: Latin America Market Value Share and BPS Analysis by Packaging, 2025 and 2035
  • Figure 56: Latin America Market Y-o-Y Growth Comparison by Packaging, 2025-2035
  • Figure 57: Latin America Market Attractiveness Analysis by Packaging
  • Figure 58: Latin America Market Value Share and BPS Analysis by Distribution Channel, 2025 and 2035
  • Figure 59: Latin America Market Y-o-Y Growth Comparison by Distribution Channel, 2025-2035
  • Figure 60: Latin America Market Attractiveness Analysis by Distribution Channel
  • Figure 61: Western Europe Market Value Share and BPS Analysis by Country, 2025 and 2035
  • Figure 62: Western Europe Market Value Share and BPS Analysis by Nature, 2025 and 2035
  • Figure 63: Western Europe Market Y-o-Y Growth Comparison by Nature, 2025-2035
  • Figure 64: Western Europe Market Attractiveness Analysis by Nature
  • Figure 65: Western Europe Market Value Share and BPS Analysis by Type, 2025 and 2035
  • Figure 66: Western Europe Market Y-o-Y Growth Comparison by Type, 2025-2035
  • Figure 67: Western Europe Market Attractiveness Analysis by Type
  • Figure 68: Western Europe Market Value Share and BPS Analysis by End-User, 2025 and 2035
  • Figure 69: Western Europe Market Y-o-Y Growth Comparison by End-User, 2025-2035
  • Figure 70: Western Europe Market Attractiveness Analysis by End-User
  • Figure 71: Western Europe Market Value Share and BPS Analysis by Packaging, 2025 and 2035
  • Figure 72: Western Europe Market Y-o-Y Growth Comparison by Packaging, 2025-2035
  • Figure 73: Western Europe Market Attractiveness Analysis by Packaging
  • Figure 74: Western Europe Market Value Share and BPS Analysis by Distribution Channel, 2025 and 2035
  • Figure 75: Western Europe Market Y-o-Y Growth Comparison by Distribution Channel, 2025-2035
  • Figure 76: Western Europe Market Attractiveness Analysis by Distribution Channel
  • Figure 77: Eastern Europe Market Value Share and BPS Analysis by Country, 2025 and 2035
  • Figure 78: Eastern Europe Market Value Share and BPS Analysis by Nature, 2025 and 2035
  • Figure 79: Eastern Europe Market Y-o-Y Growth Comparison by Nature, 2025-2035
  • Figure 80: Eastern Europe Market Attractiveness Analysis by Nature
  • Figure 81: Eastern Europe Market Value Share and BPS Analysis by Type, 2025 and 2035
  • Figure 82: Eastern Europe Market Y-o-Y Growth Comparison by Type, 2025-2035
  • Figure 83: Eastern Europe Market Attractiveness Analysis by Type
  • Figure 84: Eastern Europe Market Value Share and BPS Analysis by End-User, 2025 and 2035
  • Figure 85: Eastern Europe Market Y-o-Y Growth Comparison by End-User, 2025-2035
  • Figure 86: Eastern Europe Market Attractiveness Analysis by End-User
  • Figure 87: Eastern Europe Market Value Share and BPS Analysis by Packaging, 2025 and 2035
  • Figure 88: Eastern Europe Market Y-o-Y Growth Comparison by Packaging, 2025-2035
  • Figure 89: Eastern Europe Market Attractiveness Analysis by Packaging
  • Figure 90: Eastern Europe Market Value Share and BPS Analysis by Distribution Channel, 2025 and 2035
  • Figure 91: Eastern Europe Market Y-o-Y Growth Comparison by Distribution Channel, 2025-2035
  • Figure 92: Eastern Europe Market Attractiveness Analysis by Distribution Channel
  • Figure 93: East Asia Market Value Share and BPS Analysis by Country, 2025 and 2035
  • Figure 94: East Asia Market Value Share and BPS Analysis by Nature, 2025 and 2035
  • Figure 95: East Asia Market Y-o-Y Growth Comparison by Nature, 2025-2035
  • Figure 96: East Asia Market Attractiveness Analysis by Nature
  • Figure 97: East Asia Market Value Share and BPS Analysis by Type, 2025 and 2035
  • Figure 98: East Asia Market Y-o-Y Growth Comparison by Type, 2025-2035
  • Figure 99: East Asia Market Attractiveness Analysis by Type
  • Figure 100: East Asia Market Value Share and BPS Analysis by End-User, 2025 and 2035
  • Figure 101: East Asia Market Y-o-Y Growth Comparison by End-User, 2025-2035
  • Figure 102: East Asia Market Attractiveness Analysis by End-User
  • Figure 103: East Asia Market Value Share and BPS Analysis by Packaging, 2025 and 2035
  • Figure 104: East Asia Market Y-o-Y Growth Comparison by Packaging, 2025-2035
  • Figure 105: East Asia Market Attractiveness Analysis by Packaging
  • Figure 106: East Asia Market Value Share and BPS Analysis by Distribution Channel, 2025 and 2035
  • Figure 107: East Asia Market Y-o-Y Growth Comparison by Distribution Channel, 2025-2035
  • Figure 108: East Asia Market Attractiveness Analysis by Distribution Channel
  • Figure 109: South Asia & Pacific Market Value Share and BPS Analysis by Country, 2025 and 2035
  • Figure 110: South Asia & Pacific Market Value Share and BPS Analysis by Nature, 2025 and 2035
  • Figure 111: South Asia & Pacific Market Y-o-Y Growth Comparison by Nature, 2025-2035
  • Figure 112: South Asia & Pacific Market Attractiveness Analysis by Nature
  • Figure 113: South Asia & Pacific Market Value Share and BPS Analysis by Type, 2025 and 2035
  • Figure 114: South Asia & Pacific Market Y-o-Y Growth Comparison by Type, 2025-2035
  • Figure 115: South Asia & Pacific Market Attractiveness Analysis by Type
  • Figure 116: South Asia & Pacific Market Value Share and BPS Analysis by End-User, 2025 and 2035
  • Figure 117: South Asia & Pacific Market Y-o-Y Growth Comparison by End-User, 2025-2035
  • Figure 118: South Asia & Pacific Market Attractiveness Analysis by End-User
  • Figure 119: South Asia & Pacific Market Value Share and BPS Analysis by Packaging, 2025 and 2035
  • Figure 120: South Asia & Pacific Market Y-o-Y Growth Comparison by Packaging, 2025-2035
  • Figure 121: South Asia & Pacific Market Attractiveness Analysis by Packaging
  • Figure 122: South Asia & Pacific Market Value Share and BPS Analysis by Distribution Channel, 2025 and 2035
  • Figure 123: South Asia & Pacific Market Y-o-Y Growth Comparison by Distribution Channel, 2025-2035
  • Figure 124: South Asia & Pacific Market Attractiveness Analysis by Distribution Channel
  • Figure 125: Middle East and Africa Market Value Share and BPS Analysis by Country, 2025 and 2035
  • Figure 126: Middle East and Africa Market Value Share and BPS Analysis by Nature, 2025 and 2035
  • Figure 127: Middle East and Africa Market Y-o-Y Growth Comparison by Nature, 2025-2035
  • Figure 128: Middle East and Africa Market Attractiveness Analysis by Nature
  • Figure 129: Middle East and Africa Market Value Share and BPS Analysis by Type, 2025 and 2035
  • Figure 130: Middle East and Africa Market Y-o-Y Growth Comparison by Type, 2025-2035
  • Figure 131: Middle East and Africa Market Attractiveness Analysis by Type
  • Figure 132: Middle East and Africa Market Value Share and BPS Analysis by End-User, 2025 and 2035
  • Figure 133: Middle East and Africa Market Y-o-Y Growth Comparison by End-User, 2025-2035
  • Figure 134: Middle East and Africa Market Attractiveness Analysis by End-User
  • Figure 135: Middle East and Africa Market Value Share and BPS Analysis by Packaging, 2025 and 2035
  • Figure 136: Middle East and Africa Market Y-o-Y Growth Comparison by Packaging, 2025-2035
  • Figure 137: Middle East and Africa Market Attractiveness Analysis by Packaging
  • Figure 138: Middle East and Africa Market Value Share and BPS Analysis by Distribution Channel, 2025 and 2035
  • Figure 139: Middle East and Africa Market Y-o-Y Growth Comparison by Distribution Channel, 2025-2035
  • Figure 140: Middle East and Africa Market Attractiveness Analysis by Distribution Channel
  • Figure 141: Global Market - Tier Structure Analysis
  • Figure 142: Global Market - Company Share Analysis


Frequently Asked Questions

What is the projected size of the pea flakes market in 2025?

The market size is valued at USD 1.9 billion in 2025.

What is the outlook on pea flakes demand by 2035?

The market is forecasted to reach USD 2.9 billion by 2035, reflecting a CAGR of 4.2%.

Which type of pea holds the largest market share in 2025?

Yellow peas are expected to dominate the market with a 70% share in 2025.

Which end-user segment is expected to lead the pea flakes market in 2025?

The food processing segment is projected to lead the market with 50% share in 2025.

Which country is projected to have the fastest-growing pea flakes market?

Japan is expected to be the fastest-growing market with a CAGR of 4.6% from 2025 to 2035.

Explore Similar Insights

Future Market Insights

Pea Flakes Market