The pearl eye drops market demonstrates gradual and stable growth, rising from USD 916.7 million in 2025 to USD 1,162.0 million by 2035, reflecting a CAGR of 2.4%. The market exhibits a linear growth pattern, indicating steady demand from ophthalmology clinics, hospitals, and retail pharmacies. In the initial phase, from 2025 to 2028, the CAGR is supported by consistent adoption in developed regions, where consumer awareness of eye care products is high. Demand is further reinforced by incremental product innovation, including enhanced formulations for hydration, irritation relief, and compatibility with sensitive eyes.
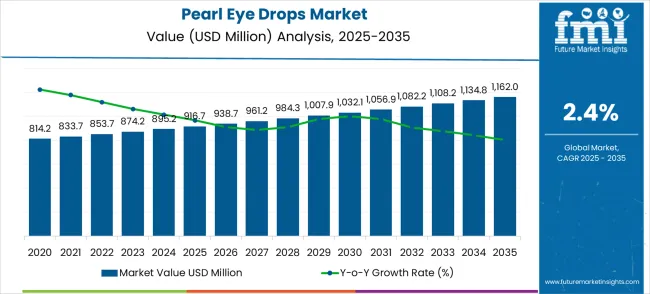
Between 2028 and 2032, growth remains stable, reflecting gradual market penetration in emerging economies with increasing access to healthcare and rising awareness of eye health. Leading companies focus on product standardization, ease of administration, and broad-spectrum applicability, which sustains consistent uptake. The final phase, 2032 to 2035, maintains a similar growth rate, driven by recurring demand, ongoing product enhancements, and regulatory approvals that expand market reach.
The pearl eye drops market is divided into dry eye treatment at 36%, anti-allergy formulations at 25%, lubricating and moisturizing drops at 18%, post-surgery and ophthalmic care at 12%, and specialty/niche formulations at 9%. Dry eye treatments dominate due to rising screen time, environmental pollution, and aging populations increasing incidence of ocular dryness.
Anti-allergy drops are expanding as seasonal and environmental allergens trigger eye irritation globally. Lubricating drops are widely used for general eye comfort. Post-surgery applications cater to patients following cataract, LASIK, or other ocular procedures.
Trends in the pearl eye drops market include formulation innovations with nano-emulsion, preservative-free, and herbal ingredients to enhance absorption and reduce irritation. Manufacturers are introducing multi-action drops combining hydration, anti-allergy, and antioxidant benefits.
Expansion into over-the-counter (OTC) channels and e-commerce platforms is improving accessibility and consumer convenience. Packaging innovations like single-use vials and dropper bottles ensure hygiene and accurate dosing. Collaborations between pharmaceutical companies and research institutions are enabling clinically validated and eye-safe formulations.
| Metric | Value |
|---|---|
| Estimated Value in (2025E) | USD 916.7 million |
| Forecast Value in (2035F) | USD 1,162.0 million |
| Forecast CAGR (2025 to 2035) | 2.4% |
The pearl eye drops market represents a niche traditional medicine segment driven by cultural heritage, natural wellness trends, and growing consumer interest in gentle eye care alternatives. With the global market growing from USD 916.7 million in 2025 to USD 1,162.0 million by 2035 at a modest 2.4% CAGR, strategic opportunities emerge through digital distribution expansion, product modernization, and geographic diversification beyond traditional Asian markets. Online sales commanding USD 323.7 million in 2025, ordinary pearl eye drops' authenticity appeal, and China's 3.2% growth rate reflect the importance of traditional formulations and digital accessibility in this culturally significant therapeutic category.
The market benefits from increasing acceptance of traditional medicine, e-commerce growth enabling broader access, and consumer preferences for natural alternatives to synthetic eye care products. The dominance of ordinary pearl eye drops demonstrates consumer demand for authentic traditional formulations, while online sales leadership indicates digital channels' effectiveness in educating consumers about traditional medicine benefits.
Market expansion is being supported by the increasing global interest in traditional medicine and the corresponding demand for natural therapeutic products that can provide effective eye care solutions while maintaining cultural authenticity and traditional wellness benefits. Modern consumers are increasingly focused on natural health solutions that can address common eye problems, support overall ocular health, and provide gentle treatment options without harsh synthetic ingredients. Pearl eye drops' proven ability to deliver traditional therapeutic benefits, natural moisturizing properties, and cultural wellness significance make them essential products for contemporary natural health care and conventional medicine practices.
The growing attention on holistic wellness and preventive healthcare is driving demand for pearl eye drops that can support natural eye health maintenance, provide gentle treatment for minor ocular conditions, and enable consumers to incorporate traditional medicine principles into their daily health routines. Consumers' preference for products that combine traditional wisdom with modern quality standards and safety assurance is creating opportunities for innovative formulation and distribution strategies. The rising influence of e-commerce platforms and digital health awareness is also contributing to increased adoption of pearl eye drops that can provide convenient access to traditional therapeutic products with authentic formulations.
The pearl eye drops market is growing steadily, supported by rising awareness of eye care and convenience in product purchase. Ordinary pearl eye drops dominate the product type segment with approximately 75% of the market share, reflecting their widespread use for general eye hydration and relief.
In terms of sales channels, online sales account for around 45% of the market, driven by e-commerce penetration and the preference for doorstep delivery. These segments highlight opportunities for manufacturers to expand reach, enhance product availability, and meet consumer demand for accessible, convenient, and reliable eye care solutions.
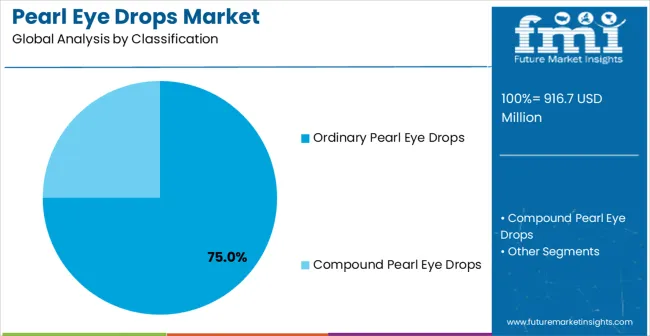
Ordinary pearl eye drops hold roughly 75% of the product type segment, making them the most widely used variant. They are primarily employed for daily eye hydration, relief from dryness, and comfort in long-screen exposure. Key manufacturers include Bausch & Lomb, Rohto, Alcon, and Johnson & Johnson. Ordinary drops are formulated for safe, frequent use with minimal preservatives, making them suitable for a wide age range. Their affordability and easy availability in retail and pharmacy channels reinforce their dominance in the market.
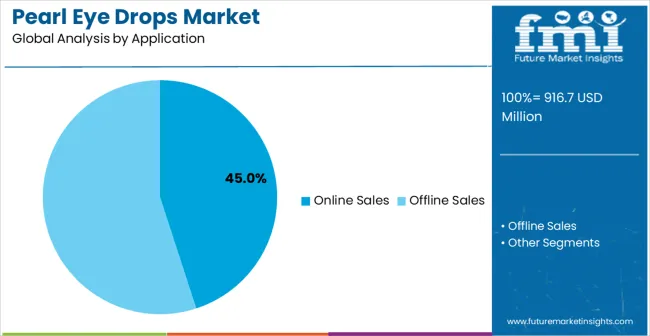
Online sales account for approximately 45% of the market, making e-commerce a leading channel for pearl eye drops. Consumers prefer online platforms for convenience, price comparison, and doorstep delivery. Major online distributors include Amazon, Flipkart, 1mg, and local pharmacy e-commerce portals. Online channels provide access to detailed product information, customer reviews, and subscription-based delivery services. Segment growth is fueled by increasing internet penetration, mobile commerce adoption, and the trend of purchasing healthcare products online, enabling manufacturers to reach a wider audience efficiently.
The pearl eye drops market is advancing steadily due to increasing consumer interest in traditional medicine and growing adoption of natural wellness products that provide gentle and effective eye care solutions based on traditional therapeutic principles.
The market faces challenges, including regulatory complexity for traditional medicine products, competition from conventional eye care treatments, and the need for quality standardization across different manufacturers. Innovation in extraction technologies and formulation enhancement continues to influence product development and market expansion patterns.
The growing integration of traditional medicine into modern healthcare practices and increasing consumer awareness of natural therapeutic options are driving demand for pearl eye drops that can provide authentic conventional treatments with modern quality standards and safety assurance.
Advanced consumer education and healthcare integration enable improved understanding of traditional medicine benefits while allowing more widespread adoption and professional recognition across various healthcare settings and consumer demographics. Manufacturers are increasingly recognizing the competitive advantages of authentic traditional formulations for market expansion and consumer trust building.
Modern pearl eye drop producers are incorporating advanced e-commerce strategies and digital marketing approaches to enhance consumer accessibility, provide comprehensive product education, and ensure authentic product delivery for traditional medicine consumers.
These technologies improve market reach while enabling new distribution opportunities, including direct-to-consumer sales and international market access. Advanced digital integration also allows manufacturers to support consumer education and product authenticity verification beyond traditional retail distribution methods.
| Country | CAGR (2025 to 2035) |
|---|---|
| China | 3.2% |
| India | 3.0% |
| Germany | 2.8% |
| Brazil | 2.5% |
| USA | 2.3% |
| UK | 2.0% |
| Japan | 1.8% |
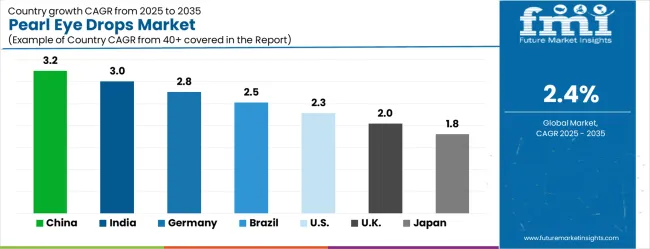
The pearl eye drops market is experiencing steady growth globally, with China leading at a 3.2% CAGR through 2035, driven by the strong traditional medicine heritage, established consumer acceptance, and significant domestic production capabilities for pearl-based therapeutic products. India follows at 3.0%, supported by growing interest in natural wellness products, increasing awareness of alternative medicine, and an expanding middle-class consumer base seeking natural health solutions.
Germany shows growth at 2.8%, prioritizing natural health product adoption and alternative medicine integration. Brazil records 2.5%, focusing on natural product market expansion and wellness trend adoption. The USA demonstrates 2.3% growth, driven by increasing consumer interest in natural eye care and alternative wellness products. The UK exhibits 2.0% growth, supported by natural health product acceptance and wellness market development. Japan shows 1.8% growth, prioritizing traditional wellness practices and natural healthcare integration.
The report covers an in-depth analysis of 40+ countries, Top-performing countries are highlighted below.
China leads the market with a 3.2% CAGR from 2025 to 2035, above several major economies. Adoption is concentrated in Guangdong, Jiangsu, and Zhejiang, where pharmaceutical distribution networks and ophthalmic clinics are highly developed. Local and international manufacturers, including Alcon, Santen, and Chong Kun Dang, provide eye drops formulated for moisture retention, irritation relief, and lens wearer comfort.
Rising screen time among urban professionals and students drives demand. Retail pharmacy chains and e-commerce platforms account for 45% of sales, while hospital-based ophthalmology departments represent 38% of demand. Increasing preference for preservative-free formulations is influencing product portfolios, and seasonal allergy periods contribute to short-term demand spikes.
India records a 3.0% CAGR, slightly below China but above Japan and the UK. Adoption is concentrated in Maharashtra, Karnataka, and Tamil Nadu, where ophthalmology clinics, hospitals, and optical stores are expanding. Suppliers like Alcon, Cipla, and Sun Pharma provide lubricating and anti-allergy eye drops.
High incidence of digital eye strain among professionals and students drives growth. Urban retail pharmacies account for 42% of demand, while hospital prescriptions contribute 35%. Awareness campaigns for eye health and rising disposable healthcare spending are supporting market expansion. Seasonal demand for anti-allergy drops peaks during spring and monsoon months, influencing production cycles.
Germany exhibits a 2.8% CAGR, slightly below China and India but above the USA Adoption is concentrated in North Rhine-Westphalia, Bavaria, and Baden-Württemberg, where ophthalmic care facilities and optometry chains are highly developed.
Suppliers including Alcon, Bausch + Lomb, and Ursapharm provide preservative-free, lubricating, and anti-allergy eye drops. Digital eye strain and aging population contribute to steady demand. Pharmacies account for 48% of sales, while clinics and hospitals contribute 35%. Regulatory compliance ensures high-quality production standards, while branded products dominate 60% of retail channels. Increasing focus on ocular wellness products is influencing market expansion.
Brazil grows at 2.5% CAGR, slightly below global 3.2%. Adoption is concentrated in São Paulo, Rio de Janeiro, and Minas Gerais, where urban ophthalmology clinics and optical stores are expanding. Suppliers like Alcon, Bausch + Lomb, and Cristália provide formulations for moisture retention, redness relief, and lens wearer comfort.
Retail pharmacy chains contribute 40% of sales, while hospital prescriptions represent 32%. High prevalence of digital eye strain, seasonal allergies, and dry eye conditions drive adoption. Product packaging innovation and convenience formats, such as single-use vials, are increasingly preferred.
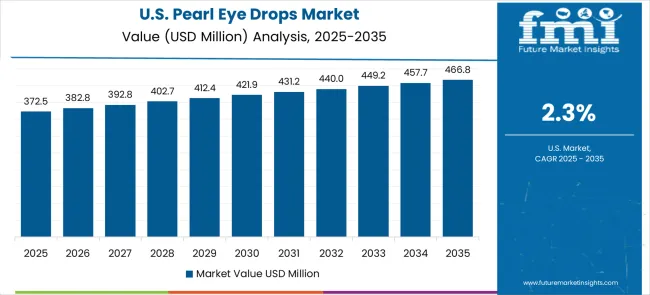
The USA records a 2.3% CAGR, slightly below the global 3.2%. Adoption is concentrated in California, New York, and Texas, where ophthalmology clinics, hospitals, and optical retail chains dominate. Suppliers including Alcon, Bausch + Lomb, and Johnson & Johnson provide preservative-free, lubricating, and anti-allergy eye drops. High screen exposure, contact lens use, and seasonal allergies drive demand.
Retail pharmacies account for 45% of sales, hospital prescriptions 30%, and e-commerce platforms 25%. Increasing focus on eye wellness and premium formulations supports steady market growth.
The UK exhibits a 2.0% CAGR, below global 3.2%. Adoption is concentrated in London, Manchester, and Birmingham, where ophthalmology clinics and retail optometry chains are established. Suppliers including Alcon, Bausch + Lomb, and Alliance Pharmaceuticals provide lubricating, anti-allergy, and lens-care eye drops.
Retail pharmacies contribute 47% of sales, hospitals 33%, and online channels 20%. Rising screen time and seasonal allergies drive moderate demand. Regulatory compliance ensures product safety and quality standards. Increasing consumer preference for preservative-free and multi-symptom formulations influences supplier strategies.
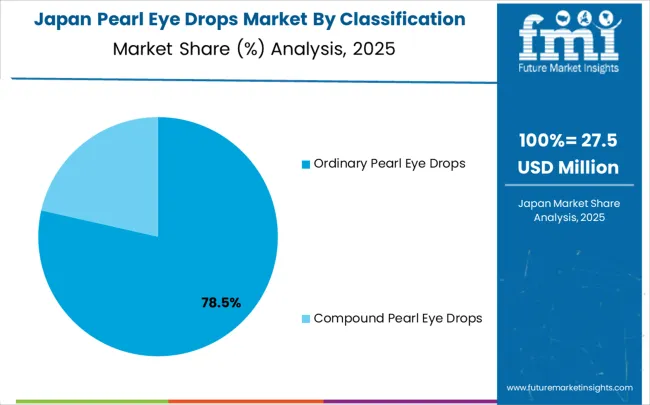
Japan records a 1.8% CAGR, the lowest among major markets. Adoption is concentrated in Tokyo, Osaka, and Fukuoka, where ophthalmology clinics, hospitals, and pharmacies are present. Suppliers such as Santen, Alcon, and Rohto provide lubricating and anti-allergy formulations. Retail pharmacies account for 50% of sales, hospitals 35%, and online platforms 15%. Aging population and digital eye strain contribute to demand. Increasing preference for preservative-free eye drops and single-use formats is observed. Limited market growth reflects mature infrastructure and slow expansion of new ophthalmic products compared with China and India.
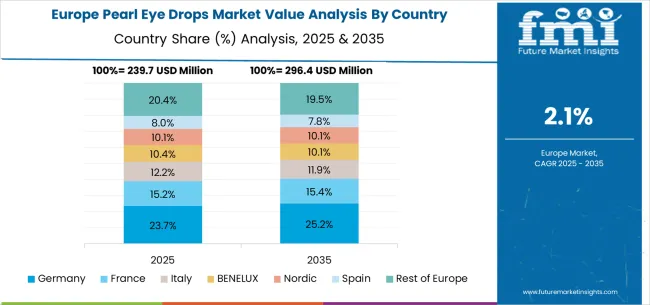
The pearl eye drops market in Europe is projected to grow from USD 212.8 million in 2025 to USD 269.9 million by 2035, registering a CAGR of 2.4% over the forecast period. Germany is expected to maintain its leadership position with a 28.4% market share in 2025, moderating slightly to 28.1% by 2035, supported by its strong natural health product market, advanced alternative medicine integration, and comprehensive wellness product networks serving major European markets.
The United Kingdom follows with a 21.7% share in 2025, projected to reach 21.9% by 2035, driven by robust natural health product acceptance, established wellness market infrastructure, and strong demand for alternative therapeutic solutions across healthcare and consumer applications.
France holds a 17.9% share in 2025, rising to 18.1% by 2035, supported by wellness market development and increasing adoption of natural health products in consumer healthcare. Italy records 13.6% in 2025, inching to 13.7% by 2035, with growth underpinned by natural product market expansion and increasing focus on traditional wellness integration. Spain contributes 10.2% in 2025, moving to 10.3% by 2035, supported by expanding wellness activities and natural health product development programs.
The Netherlands maintains a 3.4% share in 2025, growing to 3.5% by 2035. The Rest of Europe region, including Nordic countries, Eastern Europe, Belgium, Switzerland, and Austria, is anticipated to gain momentum, expanding its collective share from 4.8% to 4.4% by 2035, attributed to increasing adoption of natural wellness products in Nordic countries and growing health consciousness across Eastern European markets implementing wellness lifestyle programs.
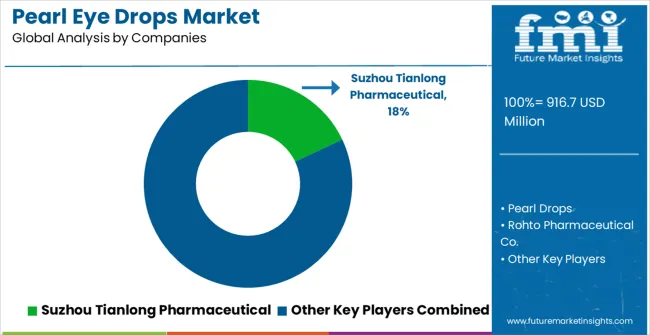
The pearl eye drops market is characterized by competition among established traditional medicine manufacturers, specialized natural health product companies, and integrated wellness solution providers. Companies are investing in conventional formulation research, quality standardization systems, modern extraction technologies, and comprehensive distribution portfolios to deliver consistent, high-quality, and authentic pearl eye drop solutions. Innovation in traditional medicine, modernization, quality assurance, and consumer accessibility is central to strengthening market position and competitive advantage.
Suzhou Tianlong Pharmaceutical leads the market with a strong market share, offering comprehensive traditional medicine solutions with a focus on authentic formulations and quality manufacturing capabilities. Pearl Drops provides specialized eye care products with a focus on conventional therapeutic benefits and consumer accessibility.
Rohto Pharmaceutical Co. delivers innovative eye care technologies with a focus on combining traditional and modern therapeutic approaches. Renhe Pharmaceutical specializes in traditional Chinese medicine products with focus on authentic formulations and quality assurance. Yunnan Baiyao Group focuses on conventional medicine manufacturing and comprehensive healthcare solutions. Taiji Group offers traditional pharmaceutical products with focus on cultural authenticity and therapeutic effectiveness.
| Items | Values |
|---|---|
| Quantitative Units (2025) | USD 916.7 million |
| Product Type | Ordinary Pearl Eye Drops, Compound Pearl Eye Drops |
| Application | Online Sales, Offline Sales |
| Regions Covered | North America, Europe, East Asia, South Asia & Pacific, Latin America, Middle East & Africa |
| Countries Covered | United States, Canada, United Kingdom, Germany, France, China, Japan, South Korea, India, Brazil, Australia and 40+ countries |
| Key Companies Profiled | Suzhou Tianlong Pharmaceutical, Pearl Drops, Rohto Pharmaceutical Co., Renhe Pharmaceutical, Yunnan Baiyao Group, and Taiji Group |
| Additional Attributes | Dollar sales by product type and application category, regional demand trends, competitive landscape, technological advancements in traditional medicine, formulation innovation, quality standardization development, and distribution optimization |
North America
Europe
East Asia
South Asia & Pacific
Latin America
Middle East & Africa
The global pearl eye drops market is estimated to be valued at USD 916.7 million in 2025.
The market size for the pearl eye drops market is projected to reach USD 1,162.0 million by 2035.
The pearl eye drops market is expected to grow at a 2.4% CAGR between 2025 and 2035.
The key product types in pearl eye drops market are ordinary pearl eye drops and compound pearl eye drops.
In terms of application, online sales segment to command 45.0% share in the pearl eye drops market in 2025.


Our Research Products

The "Full Research Suite" delivers actionable market intel, deep dives on markets or technologies, so clients act faster, cut risk, and unlock growth.

The Leaderboard benchmarks and ranks top vendors, classifying them as Established Leaders, Leading Challengers, or Disruptors & Challengers.

Locates where complements amplify value and substitutes erode it, forecasting net impact by horizon

We deliver granular, decision-grade intel: market sizing, 5-year forecasts, pricing, adoption, usage, revenue, and operational KPIs—plus competitor tracking, regulation, and value chains—across 60 countries broadly.

Spot the shifts before they hit your P&L. We track inflection points, adoption curves, pricing moves, and ecosystem plays to show where demand is heading, why it is changing, and what to do next across high-growth markets and disruptive tech

Real-time reads of user behavior. We track shifting priorities, perceptions of today’s and next-gen services, and provider experience, then pace how fast tech moves from trial to adoption, blending buyer, consumer, and channel inputs with social signals (#WhySwitch, #UX).

Partner with our analyst team to build a custom report designed around your business priorities. From analysing market trends to assessing competitors or crafting bespoke datasets, we tailor insights to your needs.
Supplier Intelligence
Discovery & Profiling
Capacity & Footprint
Performance & Risk
Compliance & Governance
Commercial Readiness
Who Supplies Whom
Scorecards & Shortlists
Playbooks & Docs
Category Intelligence
Definition & Scope
Demand & Use Cases
Cost Drivers
Market Structure
Supply Chain Map
Trade & Policy
Operating Norms
Deliverables
Buyer Intelligence
Account Basics
Spend & Scope
Procurement Model
Vendor Requirements
Terms & Policies
Entry Strategy
Pain Points & Triggers
Outputs
Pricing Analysis
Benchmarks
Trends
Should-Cost
Indexation
Landed Cost
Commercial Terms
Deliverables
Brand Analysis
Positioning & Value Prop
Share & Presence
Customer Evidence
Go-to-Market
Digital & Reputation
Compliance & Trust
KPIs & Gaps
Outputs
Full Research Suite comprises of:
Market outlook & trends analysis
Interviews & case studies
Strategic recommendations
Vendor profiles & capabilities analysis
5-year forecasts
8 regions and 60+ country-level data splits
Market segment data splits
12 months of continuous data updates
DELIVERED AS:
PDF EXCEL ONLINE
Pearl Liquid Market Size and Share Forecast Outlook 2025 to 2035
Pearlescent Pigment Market Growth - Trends & Forecast 2025 to 2035
Tapioca Pearls Market Analysis - Size, Share, and Forecast 2025 to 2035
Eye Tracking System Market Forecast and Outlook 2025 to 2035
Eye Testing Equipment Market Size and Share Forecast Outlook 2025 to 2035
Eye Health Ingredients Market Size and Share Forecast Outlook 2025 to 2035
Eye Protection Equipment Market Size and Share Forecast Outlook 2025 to 2035
Eye Shadow Stick Market Analysis - Size, Share, and Forecast 2025 to 2035
Eye Cosmetic Packaging Market Size and Share Forecast Outlook 2025 to 2035
Eye and Face Protection Market Growth - 2025 to 2035
Global Eye Infections Treatment Market Report - Trends & Forecast 2025 to 2035
Eyeliner and Kajal Sculpting Pencil Packaging Market Trends and Forecast 2025 to 2035
Eyelid Scrub Market Analysis & Forecast by Product, Application and Region 2025 to 2035
Eye Shadow Market Insights – Size, Trends & Forecast 2025 to 2035
Eye Care Supplement Analysis by Ingredients, Dosage Form, Route of Administration, Indication, Distribution channel and Region 2025 to 2035
Eyewear Market Analysis by Product Type, End Use, Sales Channel, Material Type, and Region
Evaluating Eyeliner and Kajal Sculpting Pencil Packaging Market Share & Provider Insights
Key Companies & Market Share in the Eye Shadow Stick Sector
Competitive Overview of Eyewear Packaging Companies
Market Share Insights of Eye Cosmetic Packaging Providers

Thank you!
You will receive an email from our Business Development Manager. Please be sure to check your SPAM/JUNK folder too.
Chat With
MaRIA