Reports

- Global Locations -

Headquarters

Future Market Insights, Inc.

Christiana Corporate, 200
Continental Drive, Suite 401,
Newark, Delaware - 19713,
United States

T: +1-845-579-5705

Americas

Future Market Insights, Inc.

616 Corporate Way, Suite 2-9018,
Valley Cottage, NY 10989, United States

T: +1-347-918-3531

MEA

Future Market Insights

1602-6 Jumeirah Bay X2 Tower, Plot No: JLT-PH2-X2A,
Jumeirah Lakes Towers, Dubai,
United Arab Emirates

Europe

Future Market Insights

3rd Floor, 207 Regent Street,
W1B 3HH London
United Kingdom

T: + 44 (0) 20 8123 9659
D: +44 (0) 20 3287 4268

Asia Pacific

Future Market Insights

IndiaLand Global Tech Park, Unit UG-1, Behind Grand HighStreet, Phase 1, Hinjawadi, MH, Pune – 411057, India

The Untold Insights of Businesses to Conquer the Eye Shadow Stick Market

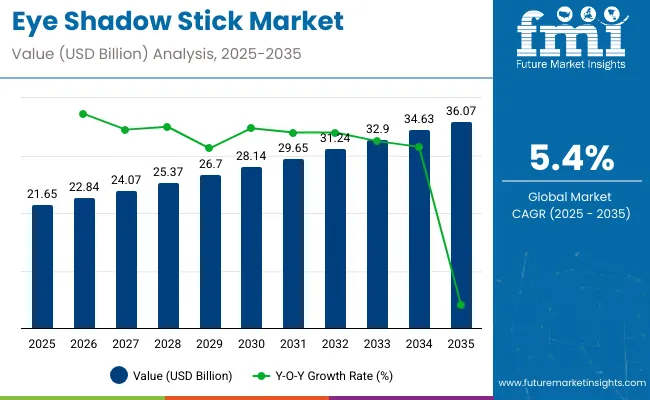
The global eye shadow stick market leads to an estimated CAGR of 5.5% in the global market, during the forecast period and registers a revenue valued at US$ 19.47 billion in 2023, and is expected to cross US$ 33.27 billion by 2033. The growing requirement for on-the-go cosmetics, which are easy and quick to apply, is likely to expand the eye shadow stick market size.

However, the “do-it-yourself” trend in the market such as the use of blush, lipstick, etc. to use as eyeshadow, is likely to hamper the market growth. On the contrary, the rapid emergence of local and regional brands in both developed and developing regions, are anticipated to create lucrative opportunities for the market share.

Attributes Details
Eye Shadow Stick Market Size (2023) US$ 19.47 billion
Eye Shadow Stick Market Size (2033) US$ 33.27 billion
Eye Shadow Stick Market CAGR (2023 to 2033) 5.5%

Natural and organic cosmetic products are growing in popularity due to the trend of using “clean make-up” products which has prompted key manufacturers to enhance research operations. This is because cosmetic brands generally incorporate harmful chemicals such as parabens, phthalates, fragrance, lead, talc, etc. to the beauty products to lessen the manufacturing costs. These ingredients can harm the skin in the long run.

‘Make-up infused with skincare’ is also a popular integrated beauty solution which is effectuating the advancement of ayurvedic beauty products and blurring the lines between makeup and skincare. These products are not only safe to use (non-toxic), but further provides skincare benefits which are expected to drive the eye shadow stick market trends.

Don't pay for what you don't need

Customize your report by selecting specific countries or regions and save 30%!

Eye Shadow Sticks are Apt for both Beginners and Professionals. Unveil Key Factors

There has been an increasing preference for premium, high-quality beauty products owing to skin awareness and rising disposable income of the middle class population. Moreover, consumers who are makeup enthusiasts, may want an eyeshadow product that does not take up a lot of time to apply. Hence, the demand for eye shadow stick is increasing as these products provide a lot of colour with minimal effort in an easy, one-swipe application.

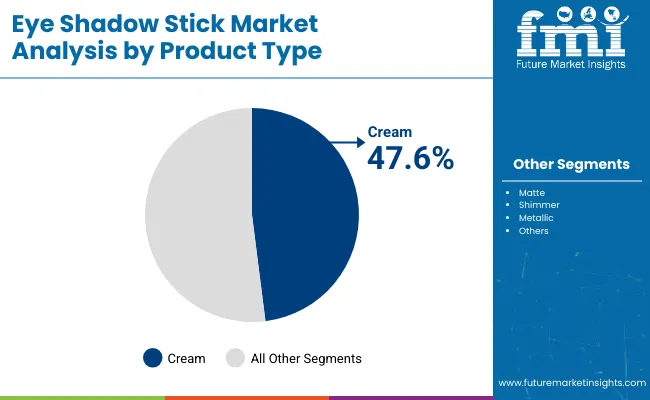
Beauty bloggers and the increasing penetration of social media, are spreading the awareness on the use and benefits of eye shadow sticks, which is expected to popularize these products. Furthermore, matte and shimmer are two different finishes of eye shadow sticks that are available in the market, that provide different eyeshadow looks. These are major drivers that are estimated to drive the market growth during the forecast period.

Another major aspect of eye shadow sticks is that it is beginner friendly. Both amateurs and professional makeup artists can use this product with ease. In addition, the sales of eye shadow stick are likely to flourish as these products are extremely versatile and can be used as an eyeliner, eyeshadow or by mixing the two as they blend easily with just a finger stroke.

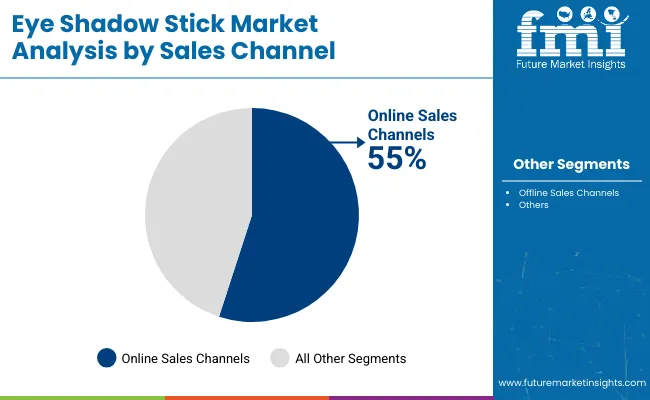
Consumers further have the options of several colours and formulas such as non-waterproof, waterproof and water resistant when purchasing eye shadow sticks. These products are also available in 24-hour long lasting formulas which do not crease, bleed or flake. Moreover, the e-commerce sector is fruitful for the eye shadow stick market share, as cosmetic product sales are the highest in the online sales platform.

Allergic Reactions and Other Restraints Along With Future Scopes of the Eye Shadow Stick Market

Strict regulatory frameworks pertaining to adopting particular pigments in the cosmetics industry enforced by the Food and Drug Administration (FDA) are likely to impede the market growth. Moreover, there may be side effects such as allergy, conjunctivitis, etc. that can arise on people with sensitive skin from using eye shadow sticks due to certain chemical ingredients, which is a major restraint for the eye shadow stick market.

Although natural and organic or clean beauty products are gaining popularity worldwide, they have a lower shelf-life compared to conventional eyeshadows, due to the absence of preservatives in the product. This factor, along with the fluctuating prices of cosmetic products, are likely to limit the global eye shadow stick market growth.

Conversely, manufacturers of luxury brands are attempting to develop eye shadow sticks in different sizes, so that the middle class population can experiment with high-end cosmetic products without having to splurge. Additionally, to attract the younger generation, several key players are focusing on digital engagement through multimedia. These are future scopes of the market, which are anticipated to increase the product demand.
Sneha Verghese
Sneha Verghese

Principal Consultant

Talk to Analyst

Find your sweet spots for generating winning opportunities in this market.

Explore How Eye Shadow Sticks are Penetrating in Beauty Industries of Different Regions: Regional Analysis

How will the North America Eye Shadow Stick Market Expand?

North America holds the largest share of the eye shadow stick market. This is attributed to the growing promotion and penetration of makeup experts and beauty bloggers in the region.

The face of skincare and cosmetics industry is changing owing to the positive impact of social media beauty influencers who are attracting numerous beauty enthusiasts on social media platforms such as Instagram, TikTok and YouTube, especially in the Unites States and Canada. These influencers are also launching their own cosmetic brands which create several opportunities for the eye shadow stick market share.

Most of these beauty influencers and bloggers engage with their viewers by creating beauty instruction or tutorial videos and content, where they also promote brands, sometimes by collaborating with them. Hence, they are successful in influencing consumer preferences by playing the important role of a mediator.

How is the Performance of the Europe Eye Shadow Stick Market?

Europe is another leading eye shadow stick market owing to the presence of several key players, beauty bloggers/influencers and the recent popular trend of using clean beauty products.

Italy is an important market for cosmetic brands as the key cosmetic manufacturers and designers are continuously focusing on incorporating fine powder and pigments in the products, in this region. Additionally, the emergence of vegan and cruelty free beauty products in this region, is growing in popularity which is consequently surging the adoption for eye shadow stick.

What is the condition of the Asia Pacific Eye Shadow Stick Market?

The Asia Pacific is a growing eye shadow stick market owing to the western influence on the significance of beauty in this region, especially in the countries China and India.

International luxury brands are entering the Indian market which is creating a dynamic change in the beauty industry of this country, and fulfilling the needs of the informed beauty consumer. Moreover, there has been a rapid emergence of national makeup brands in India. Likewise, the Chinese cosmetic industry is a profitable one as they launch affordable beauty products that popularize the art of minimal makeup.

Unveiling the Start-Up Economy Supporting the Eye Shadow Stick Market Growth

Eye shadow sticks are highly convenient for the busy consumer, and the rising trend of using cosmetics to enhance one’s features is providing creative opportunities for both key manufacturers and start-up companies to introduce innovative formulas and product designs in the eye shadow stick market share.

  • Mamaearth- It is an online retailer specializing in natural beauty and personal care products for children and adults. They experienced 400% growth through the pandemic, name their Vitamin C face washes and move towards brick-and-mortar stores as major drivers behind their success.
  • Disguise Cosmetics- It is a vegan, cruelty-free, paraben-free, and PETA-approved makeup brand. Disguise became a reality around 4 years ago, by our stunning founders Shivangi Shah, Desiree Pereira, and Lakshay Mohindroo. The 3 came together to create the 100% vegan, PETA-approved, cruelty & paraben-free cosmetic brand.
  • Plum- It is India’s first vegan beauty brand. It was founded in 2015 by Shankar Prasad, who is a double gold medallist in IIT in chemical engineering and an MBA. It sells a wide range of vegan products including skin and body products. The brand does not make any extravagant false promises or inflict insecurities through its advertisements.

Get the data you need at a Fraction of the cost

Personalize your report by choosing insights you need
and save 40%!

Top 5 Key Companies Transforming the Eye Shadow Stick Market Space

Though technological breakthroughs and numerous innovations, the global eye shadow stick market share is undergoing a transformative phase. The creativity that goes behind the development of eye shadow sticks, are expected to perpetually attract customers which provides immense opportunities for key providers to capitalize on such booming trends and introduce novel product lines.

TOP MARKET PLAYERS OF THE EYE SHADOW STICK MARKET:

  • Charlotte Tilbury- She is a British makeup artist. She is the founder, chairperson, president, and chief creative officer of the makeup and skincare brand Charlotte Tilbury Beauty Ltd. Tilbury is a contributing beauty editor for British Vogue and global ambassador for Women International.
  • Pixi Beauty– It is an international beauty brand renowned for its natural, skin-loving, youth-enhancing, multi-tasking colour and skincare products, including the iconic and award-winning Glow Tonic.
  • Bobbi Brown- She is an American professional make-up artist, author, and the founder of Bobbi Brown Cosmetics. She created ten natural-shade lipsticks which according to Entrepreneur "revolutionized the beauty industry". She has written nine books about beauty and wellness.
  • Kay Beauty by Katrina- It is a cosmetic brand launched by Bollywood actress Katrina Kaif in partnership with India’s largest beauty retailer, Nykaa.
  • M.A.C Cosmetics- It is an American cosmetics manufacturer founded in Toronto, Canada in 1984 by Frank Toskan and Frank Angelo. The company is headquartered in New York City after becoming a subsidiary of Estée Lauder Companies in 1998. MAC is an acronym for Make-Up Art Cosmetics.

OTHER MARKET PARTICPANTS OF EYE SHADOW STICK MARKET

  • Chanel
  • Dior
  • Givenchy
  • L'Oréal S.A.
  • The Estée Lauder Companies Inc.
  • Lancôme
  • Mamaearth
  • TOM FORD S.A.
  • MAYBELLINE New York
  • Yves Saint Laurent
  • NYX Professional Makeup
  • Shiseido Company
  • Sephora
  • Rimmel London
  • Laura Mercier
  • Julep Beauty

Latest developments in the eye shadow stick market are:

  • April 2023:Too Faced started Melted Matte Shadow Sticks, a new range of highly pigmented makeup sticks.
  • May 2023:Clinique opened Chubby Stick Shadow Tint for Eyes, a new collection of creamy and blendable eyeshadow sticks in matte and shimmer finishes.

Report Scope

Report Attributes Details
Growth Rate CAGR of 5.5% from 2023 to 2033
Base year for estimation 2022
Historical data 2018 to 2022
Forecast period 2023 to 2033
Quantitative units Revenue in US$ billion and CAGR from 2023 to 2033
Report coverage Revenue forecast, volume forecast, company ranking, competitive landscape, growth factors, and trends, Pricing Analysis,
Segments covered Type, Material, Mechanism, Application, and Region.
Regional scope North America; Western Europe, Eastern Europe, Middle East, Africa, ASEAN, South Asia, Rest of Asia, Australia and New Zealand
Country scope United States; Canada; Mexico; Germany; United Kingdom; France; Italy; Spain; Russia; Belgium; Poland; Czech Republic; China; India; Japan; Australia; Brazil; Argentina; Colombia; Saudi Arabia; UAE; Iran; South Africa
Key companies profiled Charlotte Tilbury, Pixi Beauty,Bobbi Brown, Kay Beauty by Katrina, M.A.C Cosmetics, Chanel, Dior Beauty, Givenchy, L'Oréal S.A., The Estée Lauder Companies Inc.,Lancôme, Mamaearth, TOM FORD S.A., MAYBELLINE New York, Yves Saint Laurent, NYX Professional Makeup, Shiseido Company, Sephora, Rimmel London, Laura Mercier, Julep Beauty, etc.
Customization scope Free report customization (equivalent to up to 8 analysts working days) with purchase. Addition or alteration to country, regional & segment scope.
Pricing and purchase options Avail customized purchase options to meet your exact research needs.

Key Segments Profiled in the Eye Shadow Stick Market Survey

By Type:

  • Round Eyeshadow Stick
  • Pointed Eyeshadow Stick

By Material:

  • Plastic
  • Wood
  • Metal

By Mechanism:

  • Retractable
  • Push-up
  • Wooden Pencil with Sharpener

By Application:

  • Online Sales
  • Offline Sales

By Region:

  • North America
  • Latin America
  • Asia Pacific
  • MEA
  • Europe

Frequently Asked Questions

How big is the Eye Shadow market?

The market is expected to witness US$ 19.47 billion in 2023.

What is the estimated value of the Eye Shadow market by 2033?

The market is estimated to be valued at US$ 33.27 billion by 2033.

What is the projected CAGR from 2023 to 2033?

The market is expected to witness a 5.5% CAGR by 2033.

Which application segment is expected to lead the market?

Online sales are expected to lead the market.

Which region is likely to dominate the market?

North America is expected to dominate the market.

Table of Content

1. Executive Summary

    1.1. Global Market Outlook

    1.2. Demand-side Trends

    1.3. Supply-side Trends

    1.4. Technology Roadmap Analysis

    1.5. Analysis and Recommendations

2. Market Overview

    2.1. Market Coverage / Taxonomy

    2.2. Market Definition / Scope / Limitations

3. Market Background

    3.1. Market Dynamics

        3.1.1. Drivers

        3.1.2. Restraints

        3.1.3. Opportunity

        3.1.4. Trends

    3.2. Scenario Forecast

        3.2.1. Demand in Optimistic Scenario

        3.2.2. Demand in Likely Scenario

        3.2.3. Demand in Conservative Scenario

    3.3. Opportunity Map Analysis

    3.4. Product Life Cycle Analysis

    3.5. Supply Chain Analysis

        3.5.1. Supply Side Participants and their Roles

            3.5.1.1. Producers

            3.5.1.2. Mid-Level Participants (Traders/ Agents/ Brokers)

            3.5.1.3. Wholesalers and Distributors

        3.5.2. Value Added and Value Created at Node in the Supply Chain

        3.5.3. List of Raw Material Suppliers

        3.5.4. List of Existing and Potential Buyer’s

    3.6. Investment Feasibility Matrix

    3.7. Value Chain Analysis

        3.7.1. Profit Margin Analysis

        3.7.2. Wholesalers and Distributors

        3.7.3. Retailers

    3.8. PESTLE and Porter’s Analysis

    3.9. Regulatory Landscape

        3.9.1. By Key Regions

        3.9.2. By Key Countries

    3.10. Regional Parent Market Outlook

    3.11. Production and Consumption Statistics

    3.12. Import and Export Statistics

4. Global Market Analysis 2018 to 2022 and Forecast, 2023 to 2033

    4.1. Historical Market Size Value (US$ Million) & Volume (Units) Analysis, 2018 to 2022

    4.2. Current and Future Market Size Value (US$ Million) & Volume (Units) Projections, 2023 to 2033

        4.2.1. Y-o-Y Growth Trend Analysis

        4.2.2. Absolute $ Opportunity Analysis

5. Global Market Analysis 2018 to 2022 and Forecast 2023 to 2033, By Type

    5.1. Introduction / Key Findings

    5.2. Historical Market Size Value (US$ Million) & Volume (Units) Analysis By Type, 2018 to 2022

    5.3. Current and Future Market Size Value (US$ Million) & Volume (Units) Analysis and Forecast By Type, 2023 to 2033

        5.3.1. Round

        5.3.2. Pointed

    5.4. Y-o-Y Growth Trend Analysis By Type, 2018 to 2022

    5.5. Absolute $ Opportunity Analysis By Type, 2023 to 2033

6. Global Market Analysis 2018 to 2022 and Forecast 2023 to 2033, By Material

    6.1. Introduction / Key Findings

    6.2. Historical Market Size Value (US$ Million) & Volume (Units) Analysis By Material, 2018 to 2022

    6.3. Current and Future Market Size Value (US$ Million) & Volume (Units) Analysis and Forecast By Material, 2023 to 2033

        6.3.1. Plastic

        6.3.2. Wood

        6.3.3. Metal

    6.4. Y-o-Y Growth Trend Analysis By Material, 2018 to 2022

    6.5. Absolute $ Opportunity Analysis By Material, 2023 to 2033

7. Global Market Analysis 2018 to 2022 and Forecast 2023 to 2033, By Mechanism

    7.1. Introduction / Key Findings

    7.2. Historical Market Size Value (US$ Million) & Volume (Units) Analysis By Mechanism, 2018 to 2022

    7.3. Current and Future Market Size Value (US$ Million) & Volume (Units) Analysis and Forecast By Mechanism, 2023 to 2033

        7.3.1. Retractable

        7.3.2. Push-up

        7.3.3. Wooden Pencil with Sharpener

    7.4. Y-o-Y Growth Trend Analysis By Mechanism, 2018 to 2022

    7.5. Absolute $ Opportunity Analysis By Mechanism, 2023 to 2033

8. Global Market Analysis 2018 to 2022 and Forecast 2023 to 2033, By Application

    8.1. Introduction / Key Findings

    8.2. Historical Market Size Value (US$ Million) & Volume (Units) Analysis By Application, 2018 to 2022

    8.3. Current and Future Market Size Value (US$ Million) & Volume (Units) Analysis and Forecast By Application, 2023 to 2033

        8.3.1. Online

        8.3.2. Offline

    8.4. Y-o-Y Growth Trend Analysis By Application, 2018 to 2022

    8.5. Absolute $ Opportunity Analysis By Application, 2023 to 2033

9. Global Market Analysis 2018 to 2022 and Forecast 2023 to 2033, By Region

    9.1. Introduction

    9.2. Historical Market Size Value (US$ Million) & Volume (Units) Analysis By Region, 2018 to 2022

    9.3. Current Market Size Value (US$ Million) & Volume (Units) Analysis and Forecast By Region, 2023 to 2033

        9.3.1. North America

        9.3.2. Latin America

        9.3.3. Western Europe

        9.3.4. Eastern Europe

        9.3.5. South Asia and Pacific

        9.3.6. East Asia

        9.3.7. Middle East and Africa

    9.4. Market Attractiveness Analysis By Region

10. North America Market Analysis 2018 to 2022 and Forecast 2023 to 2033, By Country

    10.1. Historical Market Size Value (US$ Million) & Volume (Units) Trend Analysis By Market Taxonomy, 2018 to 2022

    10.2. Market Size Value (US$ Million) & Volume (Units) Forecast By Market Taxonomy, 2023 to 2033

        10.2.1. By Country

            10.2.1.1. U.S.

            10.2.1.2. Canada

        10.2.2. By Type

        10.2.3. By Material

        10.2.4. By Mechanism

        10.2.5. By Application

    10.3. Market Attractiveness Analysis

        10.3.1. By Country

        10.3.2. By Type

        10.3.3. By Material

        10.3.4. By Mechanism

        10.3.5. By Application

    10.4. Key Takeaways

11. Latin America Market Analysis 2018 to 2022 and Forecast 2023 to 2033, By Country

    11.1. Historical Market Size Value (US$ Million) & Volume (Units) Trend Analysis By Market Taxonomy, 2018 to 2022

    11.2. Market Size Value (US$ Million) & Volume (Units) Forecast By Market Taxonomy, 2023 to 2033

        11.2.1. By Country

            11.2.1.1. Brazil

            11.2.1.2. Mexico

            11.2.1.3. Rest of Latin America

        11.2.2. By Type

        11.2.3. By Material

        11.2.4. By Mechanism

        11.2.5. By Application

    11.3. Market Attractiveness Analysis

        11.3.1. By Country

        11.3.2. By Type

        11.3.3. By Material

        11.3.4. By Mechanism

        11.3.5. By Application

    11.4. Key Takeaways

12. Western Europe Market Analysis 2018 to 2022 and Forecast 2023 to 2033, By Country

    12.1. Historical Market Size Value (US$ Million) & Volume (Units) Trend Analysis By Market Taxonomy, 2018 to 2022

    12.2. Market Size Value (US$ Million) & Volume (Units) Forecast By Market Taxonomy, 2023 to 2033

        12.2.1. By Country

            12.2.1.1. Germany

            12.2.1.2. U.K.

            12.2.1.3. France

            12.2.1.4. Spain

            12.2.1.5. Italy

            12.2.1.6. Rest of Western Europe

        12.2.2. By Type

        12.2.3. By Material

        12.2.4. By Mechanism

        12.2.5. By Application

    12.3. Market Attractiveness Analysis

        12.3.1. By Country

        12.3.2. By Type

        12.3.3. By Material

        12.3.4. By Mechanism

        12.3.5. By Application

    12.4. Key Takeaways

13. Eastern Europe Market Analysis 2018 to 2022 and Forecast 2023 to 2033, By Country

    13.1. Historical Market Size Value (US$ Million) & Volume (Units) Trend Analysis By Market Taxonomy, 2018 to 2022

    13.2. Market Size Value (US$ Million) & Volume (Units) Forecast By Market Taxonomy, 2023 to 2033

        13.2.1. By Country

            13.2.1.1. Poland

            13.2.1.2. Russia

            13.2.1.3. Czech Republic

            13.2.1.4. Romania

            13.2.1.5. Rest of Eastern Europe

        13.2.2. By Type

        13.2.3. By Material

        13.2.4. By Mechanism

        13.2.5. By Application

    13.3. Market Attractiveness Analysis

        13.3.1. By Country

        13.3.2. By Type

        13.3.3. By Material

        13.3.4. By Mechanism

        13.3.5. By Application

    13.4. Key Takeaways

14. South Asia and Pacific Market Analysis 2018 to 2022 and Forecast 2023 to 2033, By Country

    14.1. Historical Market Size Value (US$ Million) & Volume (Units) Trend Analysis By Market Taxonomy, 2018 to 2022

    14.2. Market Size Value (US$ Million) & Volume (Units) Forecast By Market Taxonomy, 2023 to 2033

        14.2.1. By Country

            14.2.1.1. India

            14.2.1.2. Bangladesh

            14.2.1.3. Australia

            14.2.1.4. New Zealand

            14.2.1.5. Rest of South Asia and Pacific

        14.2.2. By Type

        14.2.3. By Material

        14.2.4. By Mechanism

        14.2.5. By Application

    14.3. Market Attractiveness Analysis

        14.3.1. By Country

        14.3.2. By Type

        14.3.3. By Material

        14.3.4. By Mechanism

        14.3.5. By Application

    14.4. Key Takeaways

15. East Asia Market Analysis 2018 to 2022 and Forecast 2023 to 2033, By Country

    15.1. Historical Market Size Value (US$ Million) & Volume (Units) Trend Analysis By Market Taxonomy, 2018 to 2022

    15.2. Market Size Value (US$ Million) & Volume (Units) Forecast By Market Taxonomy, 2023 to 2033

        15.2.1. By Country

            15.2.1.1. China

            15.2.1.2. Japan

            15.2.1.3. South Korea

        15.2.2. By Type

        15.2.3. By Material

        15.2.4. By Mechanism

        15.2.5. By Application

    15.3. Market Attractiveness Analysis

        15.3.1. By Country

        15.3.2. By Type

        15.3.3. By Material

        15.3.4. By Mechanism

        15.3.5. By Application

    15.4. Key Takeaways

16. Middle East and Africa Market Analysis 2018 to 2022 and Forecast 2023 to 2033, By Country

    16.1. Historical Market Size Value (US$ Million) & Volume (Units) Trend Analysis By Market Taxonomy, 2018 to 2022

    16.2. Market Size Value (US$ Million) & Volume (Units) Forecast By Market Taxonomy, 2023 to 2033

        16.2.1. By Country

            16.2.1.1. GCC Countries

            16.2.1.2. South Africa

            16.2.1.3. Israel

            16.2.1.4. Rest of MEA

        16.2.2. By Type

        16.2.3. By Material

        16.2.4. By Mechanism

        16.2.5. By Application

    16.3. Market Attractiveness Analysis

        16.3.1. By Country

        16.3.2. By Type

        16.3.3. By Material

        16.3.4. By Mechanism

        16.3.5. By Application

    16.4. Key Takeaways

17. Key Countries Market Analysis

    17.1. U.S.

        17.1.1. Pricing Analysis

        17.1.2. Market Share Analysis, 2022

            17.1.2.1. By Type

            17.1.2.2. By Material

            17.1.2.3. By Mechanism

            17.1.2.4. By Application

    17.2. Canada

        17.2.1. Pricing Analysis

        17.2.2. Market Share Analysis, 2022

            17.2.2.1. By Type

            17.2.2.2. By Material

            17.2.2.3. By Mechanism

            17.2.2.4. By Application

    17.3. Brazil

        17.3.1. Pricing Analysis

        17.3.2. Market Share Analysis, 2022

            17.3.2.1. By Type

            17.3.2.2. By Material

            17.3.2.3. By Mechanism

            17.3.2.4. By Application

    17.4. Mexico

        17.4.1. Pricing Analysis

        17.4.2. Market Share Analysis, 2022

            17.4.2.1. By Type

            17.4.2.2. By Material

            17.4.2.3. By Mechanism

            17.4.2.4. By Application

    17.5. Germany

        17.5.1. Pricing Analysis

        17.5.2. Market Share Analysis, 2022

            17.5.2.1. By Type

            17.5.2.2. By Material

            17.5.2.3. By Mechanism

            17.5.2.4. By Application

    17.6. U.K.

        17.6.1. Pricing Analysis

        17.6.2. Market Share Analysis, 2022

            17.6.2.1. By Type

            17.6.2.2. By Material

            17.6.2.3. By Mechanism

            17.6.2.4. By Application

    17.7. France

        17.7.1. Pricing Analysis

        17.7.2. Market Share Analysis, 2022

            17.7.2.1. By Type

            17.7.2.2. By Material

            17.7.2.3. By Mechanism

            17.7.2.4. By Application

    17.8. Spain

        17.8.1. Pricing Analysis

        17.8.2. Market Share Analysis, 2022

            17.8.2.1. By Type

            17.8.2.2. By Material

            17.8.2.3. By Mechanism

            17.8.2.4. By Application

    17.9. Italy

        17.9.1. Pricing Analysis

        17.9.2. Market Share Analysis, 2022

            17.9.2.1. By Type

            17.9.2.2. By Material

            17.9.2.3. By Mechanism

            17.9.2.4. By Application

    17.10. Poland

        17.10.1. Pricing Analysis

        17.10.2. Market Share Analysis, 2022

            17.10.2.1. By Type

            17.10.2.2. By Material

            17.10.2.3. By Mechanism

            17.10.2.4. By Application

    17.11. Russia

        17.11.1. Pricing Analysis

        17.11.2. Market Share Analysis, 2022

            17.11.2.1. By Type

            17.11.2.2. By Material

            17.11.2.3. By Mechanism

            17.11.2.4. By Application

    17.12. Czech Republic

        17.12.1. Pricing Analysis

        17.12.2. Market Share Analysis, 2022

            17.12.2.1. By Type

            17.12.2.2. By Material

            17.12.2.3. By Mechanism

            17.12.2.4. By Application

    17.13. Romania

        17.13.1. Pricing Analysis

        17.13.2. Market Share Analysis, 2022

            17.13.2.1. By Type

            17.13.2.2. By Material

            17.13.2.3. By Mechanism

            17.13.2.4. By Application

    17.14. India

        17.14.1. Pricing Analysis

        17.14.2. Market Share Analysis, 2022

            17.14.2.1. By Type

            17.14.2.2. By Material

            17.14.2.3. By Mechanism

            17.14.2.4. By Application

    17.15. Bangladesh

        17.15.1. Pricing Analysis

        17.15.2. Market Share Analysis, 2022

            17.15.2.1. By Type

            17.15.2.2. By Material

            17.15.2.3. By Mechanism

            17.15.2.4. By Application

    17.16. Australia

        17.16.1. Pricing Analysis

        17.16.2. Market Share Analysis, 2022

            17.16.2.1. By Type

            17.16.2.2. By Material

            17.16.2.3. By Mechanism

            17.16.2.4. By Application

    17.17. New Zealand

        17.17.1. Pricing Analysis

        17.17.2. Market Share Analysis, 2022

            17.17.2.1. By Type

            17.17.2.2. By Material

            17.17.2.3. By Mechanism

            17.17.2.4. By Application

    17.18. China

        17.18.1. Pricing Analysis

        17.18.2. Market Share Analysis, 2022

            17.18.2.1. By Type

            17.18.2.2. By Material

            17.18.2.3. By Mechanism

            17.18.2.4. By Application

    17.19. Japan

        17.19.1. Pricing Analysis

        17.19.2. Market Share Analysis, 2022

            17.19.2.1. By Type

            17.19.2.2. By Material

            17.19.2.3. By Mechanism

            17.19.2.4. By Application

    17.20. South Korea

        17.20.1. Pricing Analysis

        17.20.2. Market Share Analysis, 2022

            17.20.2.1. By Type

            17.20.2.2. By Material

            17.20.2.3. By Mechanism

            17.20.2.4. By Application

    17.21. GCC Countries

        17.21.1. Pricing Analysis

        17.21.2. Market Share Analysis, 2022

            17.21.2.1. By Type

            17.21.2.2. By Material

            17.21.2.3. By Mechanism

            17.21.2.4. By Application

    17.22. South Africa

        17.22.1. Pricing Analysis

        17.22.2. Market Share Analysis, 2022

            17.22.2.1. By Type

            17.22.2.2. By Material

            17.22.2.3. By Mechanism

            17.22.2.4. By Application

    17.23. Israel

        17.23.1. Pricing Analysis

        17.23.2. Market Share Analysis, 2022

            17.23.2.1. By Type

            17.23.2.2. By Material

            17.23.2.3. By Mechanism

            17.23.2.4. By Application

18. Market Structure Analysis

    18.1. Competition Dashboard

    18.2. Competition Benchmarking

    18.3. Market Share Analysis of Top Players

        18.3.1. By Regional

        18.3.2. By Type

        18.3.3. By Material

        18.3.4. By Mechanism

        18.3.5. By Application

19. Competition Analysis

    19.1. Competition Deep Dive

        19.1.1. Charlotte Tilbury

            19.1.1.1. Overview

            19.1.1.2. Product Portfolio

            19.1.1.3. Profitability by Market Segments

            19.1.1.4. Sales Footprint

            19.1.1.5. Strategy Overview

                19.1.1.5.1. Marketing Strategy

                19.1.1.5.2. Product Strategy

                19.1.1.5.3. Channel Strategy

        19.1.2. Pixi Beauty

            19.1.2.1. Overview

            19.1.2.2. Product Portfolio

            19.1.2.3. Profitability by Market Segments

            19.1.2.4. Sales Footprint

            19.1.2.5. Strategy Overview

                19.1.2.5.1. Marketing Strategy

                19.1.2.5.2. Product Strategy

                19.1.2.5.3. Channel Strategy

        19.1.3. Bobbi Brown

            19.1.3.1. Overview

            19.1.3.2. Product Portfolio

            19.1.3.3. Profitability by Market Segments

            19.1.3.4. Sales Footprint

            19.1.3.5. Strategy Overview

                19.1.3.5.1. Marketing Strategy

                19.1.3.5.2. Product Strategy

                19.1.3.5.3. Channel Strategy

        19.1.4. M.A.C Cosmetics

            19.1.4.1. Overview

            19.1.4.2. Product Portfolio

            19.1.4.3. Profitability by Market Segments

            19.1.4.4. Sales Footprint

            19.1.4.5. Strategy Overview

                19.1.4.5.1. Marketing Strategy

                19.1.4.5.2. Product Strategy

                19.1.4.5.3. Channel Strategy

        19.1.5. Dior Beauty

            19.1.5.1. Overview

            19.1.5.2. Product Portfolio

            19.1.5.3. Profitability by Market Segments

            19.1.5.4. Sales Footprint

            19.1.5.5. Strategy Overview

                19.1.5.5.1. Marketing Strategy

                19.1.5.5.2. Product Strategy

                19.1.5.5.3. Channel Strategy

        19.1.6. Givenchy

            19.1.6.1. Overview

            19.1.6.2. Product Portfolio

            19.1.6.3. Profitability by Market Segments

            19.1.6.4. Sales Footprint

            19.1.6.5. Strategy Overview

                19.1.6.5.1. Marketing Strategy

                19.1.6.5.2. Product Strategy

                19.1.6.5.3. Channel Strategy

        19.1.7. L'Oréal S.A

            19.1.7.1. Overview

            19.1.7.2. Product Portfolio

            19.1.7.3. Profitability by Market Segments

            19.1.7.4. Sales Footprint

            19.1.7.5. Strategy Overview

                19.1.7.5.1. Marketing Strategy

                19.1.7.5.2. Product Strategy

                19.1.7.5.3. Channel Strategy

        19.1.8. The Estée Lauder Companies Inc

            19.1.8.1. Overview

            19.1.8.2. Product Portfolio

            19.1.8.3. Profitability by Market Segments

            19.1.8.4. Sales Footprint

            19.1.8.5. Strategy Overview

                19.1.8.5.1. Marketing Strategy

                19.1.8.5.2. Product Strategy

                19.1.8.5.3. Channel Strategy

        19.1.9. Lancôme

            19.1.9.1. Overview

            19.1.9.2. Product Portfolio

            19.1.9.3. Profitability by Market Segments

            19.1.9.4. Sales Footprint

            19.1.9.5. Strategy Overview

                19.1.9.5.1. Marketing Strategy

                19.1.9.5.2. Product Strategy

                19.1.9.5.3. Channel Strategy

        19.1.10. Mamaearth

            19.1.10.1. Overview

            19.1.10.2. Product Portfolio

            19.1.10.3. Profitability by Market Segments

            19.1.10.4. Sales Footprint

            19.1.10.5. Strategy Overview

                19.1.10.5.1. Marketing Strategy

                19.1.10.5.2. Product Strategy

                19.1.10.5.3. Channel Strategy

20. Assumptions & Acronyms Used

21. Research Methodology

Don't pay for what you don't need

Customize your report by selecting specific countries or regions and save 30%!

List of Tables

Table 1: Global Market Value (US$ Million) Forecast by Region, 2018 to 2033

Table 2: Global Market Volume (Units) Forecast by Region, 2018 to 2033

Table 3: Global Market Value (US$ Million) Forecast by Type, 2018 to 2033

Table 4: Global Market Volume (Units) Forecast by Type, 2018 to 2033

Table 5: Global Market Value (US$ Million) Forecast by Material, 2018 to 2033

Table 6: Global Market Volume (Units) Forecast by Material, 2018 to 2033

Table 7: Global Market Value (US$ Million) Forecast by Mechanism, 2018 to 2033

Table 8: Global Market Volume (Units) Forecast by Mechanism, 2018 to 2033

Table 9: Global Market Value (US$ Million) Forecast by Application, 2018 to 2033

Table 10: Global Market Volume (Units) Forecast by Application, 2018 to 2033

Table 11: North America Market Value (US$ Million) Forecast by Country, 2018 to 2033

Table 12: North America Market Volume (Units) Forecast by Country, 2018 to 2033

Table 13: North America Market Value (US$ Million) Forecast by Type, 2018 to 2033

Table 14: North America Market Volume (Units) Forecast by Type, 2018 to 2033

Table 15: North America Market Value (US$ Million) Forecast by Material, 2018 to 2033

Table 16: North America Market Volume (Units) Forecast by Material, 2018 to 2033

Table 17: North America Market Value (US$ Million) Forecast by Mechanism, 2018 to 2033

Table 18: North America Market Volume (Units) Forecast by Mechanism, 2018 to 2033

Table 19: North America Market Value (US$ Million) Forecast by Application, 2018 to 2033

Table 20: North America Market Volume (Units) Forecast by Application, 2018 to 2033

Table 21: Latin America Market Value (US$ Million) Forecast by Country, 2018 to 2033

Table 22: Latin America Market Volume (Units) Forecast by Country, 2018 to 2033

Table 23: Latin America Market Value (US$ Million) Forecast by Type, 2018 to 2033

Table 24: Latin America Market Volume (Units) Forecast by Type, 2018 to 2033

Table 25: Latin America Market Value (US$ Million) Forecast by Material, 2018 to 2033

Table 26: Latin America Market Volume (Units) Forecast by Material, 2018 to 2033

Table 27: Latin America Market Value (US$ Million) Forecast by Mechanism, 2018 to 2033

Table 28: Latin America Market Volume (Units) Forecast by Mechanism, 2018 to 2033

Table 29: Latin America Market Value (US$ Million) Forecast by Application, 2018 to 2033

Table 30: Latin America Market Volume (Units) Forecast by Application, 2018 to 2033

Table 31: Western Europe Market Value (US$ Million) Forecast by Country, 2018 to 2033

Table 32: Western Europe Market Volume (Units) Forecast by Country, 2018 to 2033

Table 33: Western Europe Market Value (US$ Million) Forecast by Type, 2018 to 2033

Table 34: Western Europe Market Volume (Units) Forecast by Type, 2018 to 2033

Table 35: Western Europe Market Value (US$ Million) Forecast by Material, 2018 to 2033

Table 36: Western Europe Market Volume (Units) Forecast by Material, 2018 to 2033

Table 37: Western Europe Market Value (US$ Million) Forecast by Mechanism, 2018 to 2033

Table 38: Western Europe Market Volume (Units) Forecast by Mechanism, 2018 to 2033

Table 39: Western Europe Market Value (US$ Million) Forecast by Application, 2018 to 2033

Table 40: Western Europe Market Volume (Units) Forecast by Application, 2018 to 2033

Table 41: Eastern Europe Market Value (US$ Million) Forecast by Country, 2018 to 2033

Table 42: Eastern Europe Market Volume (Units) Forecast by Country, 2018 to 2033

Table 43: Eastern Europe Market Value (US$ Million) Forecast by Type, 2018 to 2033

Table 44: Eastern Europe Market Volume (Units) Forecast by Type, 2018 to 2033

Table 45: Eastern Europe Market Value (US$ Million) Forecast by Material, 2018 to 2033

Table 46: Eastern Europe Market Volume (Units) Forecast by Material, 2018 to 2033

Table 47: Eastern Europe Market Value (US$ Million) Forecast by Mechanism, 2018 to 2033

Table 48: Eastern Europe Market Volume (Units) Forecast by Mechanism, 2018 to 2033

Table 49: Eastern Europe Market Value (US$ Million) Forecast by Application, 2018 to 2033

Table 50: Eastern Europe Market Volume (Units) Forecast by Application, 2018 to 2033

Table 51: South Asia and Pacific Market Value (US$ Million) Forecast by Country, 2018 to 2033

Table 52: South Asia and Pacific Market Volume (Units) Forecast by Country, 2018 to 2033

Table 53: South Asia and Pacific Market Value (US$ Million) Forecast by Type, 2018 to 2033

Table 54: South Asia and Pacific Market Volume (Units) Forecast by Type, 2018 to 2033

Table 55: South Asia and Pacific Market Value (US$ Million) Forecast by Material, 2018 to 2033

Table 56: South Asia and Pacific Market Volume (Units) Forecast by Material, 2018 to 2033

Table 57: South Asia and Pacific Market Value (US$ Million) Forecast by Mechanism, 2018 to 2033

Table 58: South Asia and Pacific Market Volume (Units) Forecast by Mechanism, 2018 to 2033

Table 59: South Asia and Pacific Market Value (US$ Million) Forecast by Application, 2018 to 2033

Table 60: South Asia and Pacific Market Volume (Units) Forecast by Application, 2018 to 2033

Table 61: East Asia Market Value (US$ Million) Forecast by Country, 2018 to 2033

Table 62: East Asia Market Volume (Units) Forecast by Country, 2018 to 2033

Table 63: East Asia Market Value (US$ Million) Forecast by Type, 2018 to 2033

Table 64: East Asia Market Volume (Units) Forecast by Type, 2018 to 2033

Table 65: East Asia Market Value (US$ Million) Forecast by Material, 2018 to 2033

Table 66: East Asia Market Volume (Units) Forecast by Material, 2018 to 2033

Table 67: East Asia Market Value (US$ Million) Forecast by Mechanism, 2018 to 2033

Table 68: East Asia Market Volume (Units) Forecast by Mechanism, 2018 to 2033

Table 69: East Asia Market Value (US$ Million) Forecast by Application, 2018 to 2033

Table 70: East Asia Market Volume (Units) Forecast by Application, 2018 to 2033

Table 71: Middle East and Africa Market Value (US$ Million) Forecast by Country, 2018 to 2033

Table 72: Middle East and Africa Market Volume (Units) Forecast by Country, 2018 to 2033

Table 73: Middle East and Africa Market Value (US$ Million) Forecast by Type, 2018 to 2033

Table 74: Middle East and Africa Market Volume (Units) Forecast by Type, 2018 to 2033

Table 75: Middle East and Africa Market Value (US$ Million) Forecast by Material, 2018 to 2033

Table 76: Middle East and Africa Market Volume (Units) Forecast by Material, 2018 to 2033

Table 77: Middle East and Africa Market Value (US$ Million) Forecast by Mechanism, 2018 to 2033

Table 78: Middle East and Africa Market Volume (Units) Forecast by Mechanism, 2018 to 2033

Table 79: Middle East and Africa Market Value (US$ Million) Forecast by Application, 2018 to 2033

Table 80: Middle East and Africa Market Volume (Units) Forecast by Application, 2018 to 2033
Sneha Verghese
Sneha Verghese

Principal Consultant

Talk to Analyst

Find your sweet spots for generating winning opportunities in this market.

List of Charts

Figure 1: Global Market Value (US$ Million) by Type, 2023 to 2033

Figure 2: Global Market Value (US$ Million) by Material, 2023 to 2033

Figure 3: Global Market Value (US$ Million) by Mechanism, 2023 to 2033

Figure 4: Global Market Value (US$ Million) by Application, 2023 to 2033

Figure 5: Global Market Value (US$ Million) by Region, 2023 to 2033

Figure 6: Global Market Value (US$ Million) Analysis by Region, 2018 to 2033

Figure 7: Global Market Volume (Units) Analysis by Region, 2018 to 2033

Figure 8: Global Market Value Share (%) and BPS Analysis by Region, 2023 to 2033

Figure 9: Global Market Y-o-Y Growth (%) Projections by Region, 2023 to 2033

Figure 10: Global Market Value (US$ Million) Analysis by Type, 2018 to 2033

Figure 11: Global Market Volume (Units) Analysis by Type, 2018 to 2033

Figure 12: Global Market Value Share (%) and BPS Analysis by Type, 2023 to 2033

Figure 13: Global Market Y-o-Y Growth (%) Projections by Type, 2023 to 2033

Figure 14: Global Market Value (US$ Million) Analysis by Material, 2018 to 2033

Figure 15: Global Market Volume (Units) Analysis by Material, 2018 to 2033

Figure 16: Global Market Value Share (%) and BPS Analysis by Material, 2023 to 2033

Figure 17: Global Market Y-o-Y Growth (%) Projections by Material, 2023 to 2033

Figure 18: Global Market Value (US$ Million) Analysis by Mechanism, 2018 to 2033

Figure 19: Global Market Volume (Units) Analysis by Mechanism, 2018 to 2033

Figure 20: Global Market Value Share (%) and BPS Analysis by Mechanism, 2023 to 2033

Figure 21: Global Market Y-o-Y Growth (%) Projections by Mechanism, 2023 to 2033

Figure 22: Global Market Value (US$ Million) Analysis by Application, 2018 to 2033

Figure 23: Global Market Volume (Units) Analysis by Application, 2018 to 2033

Figure 24: Global Market Value Share (%) and BPS Analysis by Application, 2023 to 2033

Figure 25: Global Market Y-o-Y Growth (%) Projections by Application, 2023 to 2033

Figure 26: Global Market Attractiveness by Type, 2023 to 2033

Figure 27: Global Market Attractiveness by Material, 2023 to 2033

Figure 28: Global Market Attractiveness by Mechanism, 2023 to 2033

Figure 29: Global Market Attractiveness by Application, 2023 to 2033

Figure 30: Global Market Attractiveness by Region, 2023 to 2033

Figure 31: North America Market Value (US$ Million) by Type, 2023 to 2033

Figure 32: North America Market Value (US$ Million) by Material, 2023 to 2033

Figure 33: North America Market Value (US$ Million) by Mechanism, 2023 to 2033

Figure 34: North America Market Value (US$ Million) by Application, 2023 to 2033

Figure 35: North America Market Value (US$ Million) by Country, 2023 to 2033

Figure 36: North America Market Value (US$ Million) Analysis by Country, 2018 to 2033

Figure 37: North America Market Volume (Units) Analysis by Country, 2018 to 2033

Figure 38: North America Market Value Share (%) and BPS Analysis by Country, 2023 to 2033

Figure 39: North America Market Y-o-Y Growth (%) Projections by Country, 2023 to 2033

Figure 40: North America Market Value (US$ Million) Analysis by Type, 2018 to 2033

Figure 41: North America Market Volume (Units) Analysis by Type, 2018 to 2033

Figure 42: North America Market Value Share (%) and BPS Analysis by Type, 2023 to 2033

Figure 43: North America Market Y-o-Y Growth (%) Projections by Type, 2023 to 2033

Figure 44: North America Market Value (US$ Million) Analysis by Material, 2018 to 2033

Figure 45: North America Market Volume (Units) Analysis by Material, 2018 to 2033

Figure 46: North America Market Value Share (%) and BPS Analysis by Material, 2023 to 2033

Figure 47: North America Market Y-o-Y Growth (%) Projections by Material, 2023 to 2033

Figure 48: North America Market Value (US$ Million) Analysis by Mechanism, 2018 to 2033

Figure 49: North America Market Volume (Units) Analysis by Mechanism, 2018 to 2033

Figure 50: North America Market Value Share (%) and BPS Analysis by Mechanism, 2023 to 2033

Figure 51: North America Market Y-o-Y Growth (%) Projections by Mechanism, 2023 to 2033

Figure 52: North America Market Value (US$ Million) Analysis by Application, 2018 to 2033

Figure 53: North America Market Volume (Units) Analysis by Application, 2018 to 2033

Figure 54: North America Market Value Share (%) and BPS Analysis by Application, 2023 to 2033

Figure 55: North America Market Y-o-Y Growth (%) Projections by Application, 2023 to 2033

Figure 56: North America Market Attractiveness by Type, 2023 to 2033

Figure 57: North America Market Attractiveness by Material, 2023 to 2033

Figure 58: North America Market Attractiveness by Mechanism, 2023 to 2033

Figure 59: North America Market Attractiveness by Application, 2023 to 2033

Figure 60: North America Market Attractiveness by Country, 2023 to 2033

Figure 61: Latin America Market Value (US$ Million) by Type, 2023 to 2033

Figure 62: Latin America Market Value (US$ Million) by Material, 2023 to 2033

Figure 63: Latin America Market Value (US$ Million) by Mechanism, 2023 to 2033

Figure 64: Latin America Market Value (US$ Million) by Application, 2023 to 2033

Figure 65: Latin America Market Value (US$ Million) by Country, 2023 to 2033

Figure 66: Latin America Market Value (US$ Million) Analysis by Country, 2018 to 2033

Figure 67: Latin America Market Volume (Units) Analysis by Country, 2018 to 2033

Figure 68: Latin America Market Value Share (%) and BPS Analysis by Country, 2023 to 2033

Figure 69: Latin America Market Y-o-Y Growth (%) Projections by Country, 2023 to 2033

Figure 70: Latin America Market Value (US$ Million) Analysis by Type, 2018 to 2033

Figure 71: Latin America Market Volume (Units) Analysis by Type, 2018 to 2033

Figure 72: Latin America Market Value Share (%) and BPS Analysis by Type, 2023 to 2033

Figure 73: Latin America Market Y-o-Y Growth (%) Projections by Type, 2023 to 2033

Figure 74: Latin America Market Value (US$ Million) Analysis by Material, 2018 to 2033

Figure 75: Latin America Market Volume (Units) Analysis by Material, 2018 to 2033

Figure 76: Latin America Market Value Share (%) and BPS Analysis by Material, 2023 to 2033

Figure 77: Latin America Market Y-o-Y Growth (%) Projections by Material, 2023 to 2033

Figure 78: Latin America Market Value (US$ Million) Analysis by Mechanism, 2018 to 2033

Figure 79: Latin America Market Volume (Units) Analysis by Mechanism, 2018 to 2033

Figure 80: Latin America Market Value Share (%) and BPS Analysis by Mechanism, 2023 to 2033

Figure 81: Latin America Market Y-o-Y Growth (%) Projections by Mechanism, 2023 to 2033

Figure 82: Latin America Market Value (US$ Million) Analysis by Application, 2018 to 2033

Figure 83: Latin America Market Volume (Units) Analysis by Application, 2018 to 2033

Figure 84: Latin America Market Value Share (%) and BPS Analysis by Application, 2023 to 2033

Figure 85: Latin America Market Y-o-Y Growth (%) Projections by Application, 2023 to 2033

Figure 86: Latin America Market Attractiveness by Type, 2023 to 2033

Figure 87: Latin America Market Attractiveness by Material, 2023 to 2033

Figure 88: Latin America Market Attractiveness by Mechanism, 2023 to 2033

Figure 89: Latin America Market Attractiveness by Application, 2023 to 2033

Figure 90: Latin America Market Attractiveness by Country, 2023 to 2033

Figure 91: Western Europe Market Value (US$ Million) by Type, 2023 to 2033

Figure 92: Western Europe Market Value (US$ Million) by Material, 2023 to 2033

Figure 93: Western Europe Market Value (US$ Million) by Mechanism, 2023 to 2033

Figure 94: Western Europe Market Value (US$ Million) by Application, 2023 to 2033

Figure 95: Western Europe Market Value (US$ Million) by Country, 2023 to 2033

Figure 96: Western Europe Market Value (US$ Million) Analysis by Country, 2018 to 2033

Figure 97: Western Europe Market Volume (Units) Analysis by Country, 2018 to 2033

Figure 98: Western Europe Market Value Share (%) and BPS Analysis by Country, 2023 to 2033

Figure 99: Western Europe Market Y-o-Y Growth (%) Projections by Country, 2023 to 2033

Figure 100: Western Europe Market Value (US$ Million) Analysis by Type, 2018 to 2033

Figure 101: Western Europe Market Volume (Units) Analysis by Type, 2018 to 2033

Figure 102: Western Europe Market Value Share (%) and BPS Analysis by Type, 2023 to 2033

Figure 103: Western Europe Market Y-o-Y Growth (%) Projections by Type, 2023 to 2033

Figure 104: Western Europe Market Value (US$ Million) Analysis by Material, 2018 to 2033

Figure 105: Western Europe Market Volume (Units) Analysis by Material, 2018 to 2033

Figure 106: Western Europe Market Value Share (%) and BPS Analysis by Material, 2023 to 2033

Figure 107: Western Europe Market Y-o-Y Growth (%) Projections by Material, 2023 to 2033

Figure 108: Western Europe Market Value (US$ Million) Analysis by Mechanism, 2018 to 2033

Figure 109: Western Europe Market Volume (Units) Analysis by Mechanism, 2018 to 2033

Figure 110: Western Europe Market Value Share (%) and BPS Analysis by Mechanism, 2023 to 2033

Figure 111: Western Europe Market Y-o-Y Growth (%) Projections by Mechanism, 2023 to 2033

Figure 112: Western Europe Market Value (US$ Million) Analysis by Application, 2018 to 2033

Figure 113: Western Europe Market Volume (Units) Analysis by Application, 2018 to 2033

Figure 114: Western Europe Market Value Share (%) and BPS Analysis by Application, 2023 to 2033

Figure 115: Western Europe Market Y-o-Y Growth (%) Projections by Application, 2023 to 2033

Figure 116: Western Europe Market Attractiveness by Type, 2023 to 2033

Figure 117: Western Europe Market Attractiveness by Material, 2023 to 2033

Figure 118: Western Europe Market Attractiveness by Mechanism, 2023 to 2033

Figure 119: Western Europe Market Attractiveness by Application, 2023 to 2033

Figure 120: Western Europe Market Attractiveness by Country, 2023 to 2033

Figure 121: Eastern Europe Market Value (US$ Million) by Type, 2023 to 2033

Figure 122: Eastern Europe Market Value (US$ Million) by Material, 2023 to 2033

Figure 123: Eastern Europe Market Value (US$ Million) by Mechanism, 2023 to 2033

Figure 124: Eastern Europe Market Value (US$ Million) by Application, 2023 to 2033

Figure 125: Eastern Europe Market Value (US$ Million) by Country, 2023 to 2033

Figure 126: Eastern Europe Market Value (US$ Million) Analysis by Country, 2018 to 2033

Figure 127: Eastern Europe Market Volume (Units) Analysis by Country, 2018 to 2033

Figure 128: Eastern Europe Market Value Share (%) and BPS Analysis by Country, 2023 to 2033

Figure 129: Eastern Europe Market Y-o-Y Growth (%) Projections by Country, 2023 to 2033

Figure 130: Eastern Europe Market Value (US$ Million) Analysis by Type, 2018 to 2033

Figure 131: Eastern Europe Market Volume (Units) Analysis by Type, 2018 to 2033

Figure 132: Eastern Europe Market Value Share (%) and BPS Analysis by Type, 2023 to 2033

Figure 133: Eastern Europe Market Y-o-Y Growth (%) Projections by Type, 2023 to 2033

Figure 134: Eastern Europe Market Value (US$ Million) Analysis by Material, 2018 to 2033

Figure 135: Eastern Europe Market Volume (Units) Analysis by Material, 2018 to 2033

Figure 136: Eastern Europe Market Value Share (%) and BPS Analysis by Material, 2023 to 2033

Figure 137: Eastern Europe Market Y-o-Y Growth (%) Projections by Material, 2023 to 2033

Figure 138: Eastern Europe Market Value (US$ Million) Analysis by Mechanism, 2018 to 2033

Figure 139: Eastern Europe Market Volume (Units) Analysis by Mechanism, 2018 to 2033

Figure 140: Eastern Europe Market Value Share (%) and BPS Analysis by Mechanism, 2023 to 2033

Figure 141: Eastern Europe Market Y-o-Y Growth (%) Projections by Mechanism, 2023 to 2033

Figure 142: Eastern Europe Market Value (US$ Million) Analysis by Application, 2018 to 2033

Figure 143: Eastern Europe Market Volume (Units) Analysis by Application, 2018 to 2033

Figure 144: Eastern Europe Market Value Share (%) and BPS Analysis by Application, 2023 to 2033

Figure 145: Eastern Europe Market Y-o-Y Growth (%) Projections by Application, 2023 to 2033

Figure 146: Eastern Europe Market Attractiveness by Type, 2023 to 2033

Figure 147: Eastern Europe Market Attractiveness by Material, 2023 to 2033

Figure 148: Eastern Europe Market Attractiveness by Mechanism, 2023 to 2033

Figure 149: Eastern Europe Market Attractiveness by Application, 2023 to 2033

Figure 150: Eastern Europe Market Attractiveness by Country, 2023 to 2033

Figure 151: South Asia and Pacific Market Value (US$ Million) by Type, 2023 to 2033

Figure 152: South Asia and Pacific Market Value (US$ Million) by Material, 2023 to 2033

Figure 153: South Asia and Pacific Market Value (US$ Million) by Mechanism, 2023 to 2033

Figure 154: South Asia and Pacific Market Value (US$ Million) by Application, 2023 to 2033

Figure 155: South Asia and Pacific Market Value (US$ Million) by Country, 2023 to 2033

Figure 156: South Asia and Pacific Market Value (US$ Million) Analysis by Country, 2018 to 2033

Figure 157: South Asia and Pacific Market Volume (Units) Analysis by Country, 2018 to 2033

Figure 158: South Asia and Pacific Market Value Share (%) and BPS Analysis by Country, 2023 to 2033

Figure 159: South Asia and Pacific Market Y-o-Y Growth (%) Projections by Country, 2023 to 2033

Figure 160: South Asia and Pacific Market Value (US$ Million) Analysis by Type, 2018 to 2033

Figure 161: South Asia and Pacific Market Volume (Units) Analysis by Type, 2018 to 2033

Figure 162: South Asia and Pacific Market Value Share (%) and BPS Analysis by Type, 2023 to 2033

Figure 163: South Asia and Pacific Market Y-o-Y Growth (%) Projections by Type, 2023 to 2033

Figure 164: South Asia and Pacific Market Value (US$ Million) Analysis by Material, 2018 to 2033

Figure 165: South Asia and Pacific Market Volume (Units) Analysis by Material, 2018 to 2033

Figure 166: South Asia and Pacific Market Value Share (%) and BPS Analysis by Material, 2023 to 2033

Figure 167: South Asia and Pacific Market Y-o-Y Growth (%) Projections by Material, 2023 to 2033

Figure 168: South Asia and Pacific Market Value (US$ Million) Analysis by Mechanism, 2018 to 2033

Figure 169: South Asia and Pacific Market Volume (Units) Analysis by Mechanism, 2018 to 2033

Figure 170: South Asia and Pacific Market Value Share (%) and BPS Analysis by Mechanism, 2023 to 2033

Figure 171: South Asia and Pacific Market Y-o-Y Growth (%) Projections by Mechanism, 2023 to 2033

Figure 172: South Asia and Pacific Market Value (US$ Million) Analysis by Application, 2018 to 2033

Figure 173: South Asia and Pacific Market Volume (Units) Analysis by Application, 2018 to 2033

Figure 174: South Asia and Pacific Market Value Share (%) and BPS Analysis by Application, 2023 to 2033

Figure 175: South Asia and Pacific Market Y-o-Y Growth (%) Projections by Application, 2023 to 2033

Figure 176: South Asia and Pacific Market Attractiveness by Type, 2023 to 2033

Figure 177: South Asia and Pacific Market Attractiveness by Material, 2023 to 2033

Figure 178: South Asia and Pacific Market Attractiveness by Mechanism, 2023 to 2033

Figure 179: South Asia and Pacific Market Attractiveness by Application, 2023 to 2033

Figure 180: South Asia and Pacific Market Attractiveness by Country, 2023 to 2033

Figure 181: East Asia Market Value (US$ Million) by Type, 2023 to 2033

Figure 182: East Asia Market Value (US$ Million) by Material, 2023 to 2033

Figure 183: East Asia Market Value (US$ Million) by Mechanism, 2023 to 2033

Figure 184: East Asia Market Value (US$ Million) by Application, 2023 to 2033

Figure 185: East Asia Market Value (US$ Million) by Country, 2023 to 2033

Figure 186: East Asia Market Value (US$ Million) Analysis by Country, 2018 to 2033

Figure 187: East Asia Market Volume (Units) Analysis by Country, 2018 to 2033

Figure 188: East Asia Market Value Share (%) and BPS Analysis by Country, 2023 to 2033

Figure 189: East Asia Market Y-o-Y Growth (%) Projections by Country, 2023 to 2033

Figure 190: East Asia Market Value (US$ Million) Analysis by Type, 2018 to 2033

Figure 191: East Asia Market Volume (Units) Analysis by Type, 2018 to 2033

Figure 192: East Asia Market Value Share (%) and BPS Analysis by Type, 2023 to 2033

Figure 193: East Asia Market Y-o-Y Growth (%) Projections by Type, 2023 to 2033

Figure 194: East Asia Market Value (US$ Million) Analysis by Material, 2018 to 2033

Figure 195: East Asia Market Volume (Units) Analysis by Material, 2018 to 2033

Figure 196: East Asia Market Value Share (%) and BPS Analysis by Material, 2023 to 2033

Figure 197: East Asia Market Y-o-Y Growth (%) Projections by Material, 2023 to 2033

Figure 198: East Asia Market Value (US$ Million) Analysis by Mechanism, 2018 to 2033

Figure 199: East Asia Market Volume (Units) Analysis by Mechanism, 2018 to 2033

Figure 200: East Asia Market Value Share (%) and BPS Analysis by Mechanism, 2023 to 2033

Figure 201: East Asia Market Y-o-Y Growth (%) Projections by Mechanism, 2023 to 2033

Figure 202: East Asia Market Value (US$ Million) Analysis by Application, 2018 to 2033

Figure 203: East Asia Market Volume (Units) Analysis by Application, 2018 to 2033

Figure 204: East Asia Market Value Share (%) and BPS Analysis by Application, 2023 to 2033

Figure 205: East Asia Market Y-o-Y Growth (%) Projections by Application, 2023 to 2033

Figure 206: East Asia Market Attractiveness by Type, 2023 to 2033

Figure 207: East Asia Market Attractiveness by Material, 2023 to 2033

Figure 208: East Asia Market Attractiveness by Mechanism, 2023 to 2033

Figure 209: East Asia Market Attractiveness by Application, 2023 to 2033

Figure 210: East Asia Market Attractiveness by Country, 2023 to 2033

Figure 211: Middle East and Africa Market Value (US$ Million) by Type, 2023 to 2033

Figure 212: Middle East and Africa Market Value (US$ Million) by Material, 2023 to 2033

Figure 213: Middle East and Africa Market Value (US$ Million) by Mechanism, 2023 to 2033

Figure 214: Middle East and Africa Market Value (US$ Million) by Application, 2023 to 2033

Figure 215: Middle East and Africa Market Value (US$ Million) by Country, 2023 to 2033

Figure 216: Middle East and Africa Market Value (US$ Million) Analysis by Country, 2018 to 2033

Figure 217: Middle East and Africa Market Volume (Units) Analysis by Country, 2018 to 2033

Figure 218: Middle East and Africa Market Value Share (%) and BPS Analysis by Country, 2023 to 2033

Figure 219: Middle East and Africa Market Y-o-Y Growth (%) Projections by Country, 2023 to 2033

Figure 220: Middle East and Africa Market Value (US$ Million) Analysis by Type, 2018 to 2033

Figure 221: Middle East and Africa Market Volume (Units) Analysis by Type, 2018 to 2033

Figure 222: Middle East and Africa Market Value Share (%) and BPS Analysis by Type, 2023 to 2033

Figure 223: Middle East and Africa Market Y-o-Y Growth (%) Projections by Type, 2023 to 2033

Figure 224: Middle East and Africa Market Value (US$ Million) Analysis by Material, 2018 to 2033

Figure 225: Middle East and Africa Market Volume (Units) Analysis by Material, 2018 to 2033

Figure 226: Middle East and Africa Market Value Share (%) and BPS Analysis by Material, 2023 to 2033

Figure 227: Middle East and Africa Market Y-o-Y Growth (%) Projections by Material, 2023 to 2033

Figure 228: Middle East and Africa Market Value (US$ Million) Analysis by Mechanism, 2018 to 2033

Figure 229: Middle East and Africa Market Volume (Units) Analysis by Mechanism, 2018 to 2033

Figure 230: Middle East and Africa Market Value Share (%) and BPS Analysis by Mechanism, 2023 to 2033

Figure 231: Middle East and Africa Market Y-o-Y Growth (%) Projections by Mechanism, 2023 to 2033

Figure 232: Middle East and Africa Market Value (US$ Million) Analysis by Application, 2018 to 2033

Figure 233: Middle East and Africa Market Volume (Units) Analysis by Application, 2018 to 2033

Figure 234: Middle East and Africa Market Value Share (%) and BPS Analysis by Application, 2023 to 2033

Figure 235: Middle East and Africa Market Y-o-Y Growth (%) Projections by Application, 2023 to 2033

Figure 236: Middle East and Africa Market Attractiveness by Type, 2023 to 2033

Figure 237: Middle East and Africa Market Attractiveness by Material, 2023 to 2033

Figure 238: Middle East and Africa Market Attractiveness by Mechanism, 2023 to 2033

Figure 239: Middle East and Africa Market Attractiveness by Application, 2023 to 2033

Figure 240: Middle East and Africa Market Attractiveness by Country, 2023 to 2033

Recommendations

Consumer Product

Eye Shadow Market

Published : May 2023

Explore Consumer Product Insights

View Reports