Native Starch Market Forecast and Outlook 2025 to 2035

The global native starch market is valued at USD 1.8 billion in 2025 and is expected to reach USD 2.9 billion by 2035, reflecting a CAGR of 5.7%. This growth is driven by increasing demand for clean-label and minimally processed ingredients, especially in food and beverage applications.
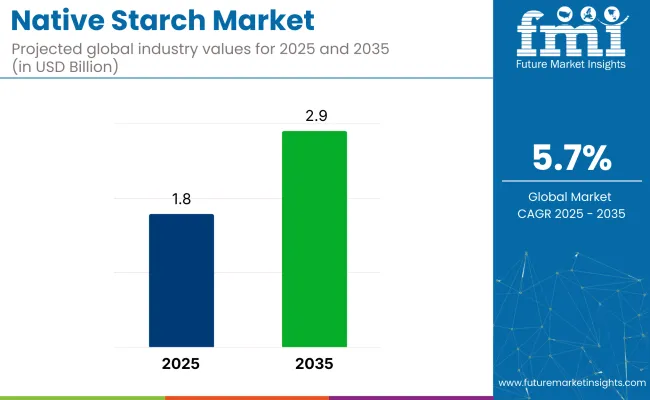
Quick Stats Of Native Starch Market

  • Market Value (2025): USD 1.8 billion
  • Forecast Value (2035): USD 2.9 billion
  • Forecast CAGR: 5.7%
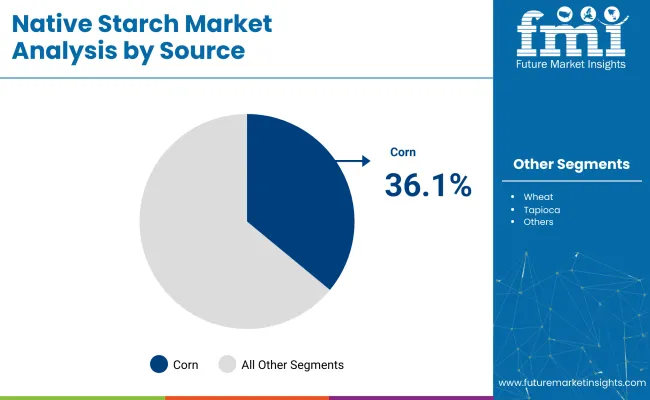
  • Source Leader in 2025: Corn Starch (36.1% market share)
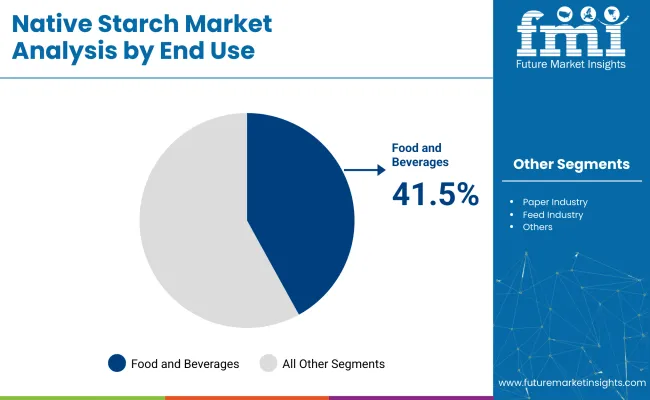
  • Top End Use Segment: Food and Beverages (41.5% market share)
  • Key Growth Country: Japan (fastest-growing at 5.5% CAGR)

Native Starches Market

Metric Value
Estimated Size (2025) USD 1.8 billion
Projected Size (2035) USD 2.9 billion
CAGR (2025 to 2035) 5.7%

Native starches, which are derived from natural sources like corn, wheat, potato, and tapioca, are gaining popularity due to their role in thickening, stabilizing, and texturizing. Enhanced consumer awareness around health and wellness, combined with the rising trend of vegan and allergen-free diets, is expected to further support demand across both developed and emerging markets.

North America is expected to dominate the global native starch market by 2025, owing to strong demand for gluten-free, vegan, and allergen-friendly food products, especially with the USA growing at a CAGR of 5.1%. In contrast, Japan and the UK closely follow this growth with prominent CAGRs of 5.5% and 4.6% respectively. With around 36.1% market share, corn starch will continue to be the leading source segment. The food and beverages industry will remain the top application area with a projected 41.5% share.

The native starch market holds a significant but niche share within its broader parent categories. It accounts for approximately 18-22% of the overall starch and derivatives market, given its use across food, pharma, and industrial sectors. Within the functional food ingredients market, native starch represents around 8-10%, primarily driven by its role in clean-label and allergen-free products.

In the clean label ingredients market, native starch contributes about 12-15% owing to its unmodified, natural profile. Though smaller in share within the plant-based and specialty ingredients markets (roughly 5-7%), it remains a fast-growing segment due to rising health and transparency trends.

Native Starch Market Analysis by Top Investment Segments

The global native starch market is segmented by source, form, end-use and region. By source, it includes corn, wheat, potatoes, tapioca, and others (rice, cassava, arrowroot). By form, it is segmented into powder and liquid.

By end use, it includes food and beverages (dairy, bakery, soups/sauces/dressings, infant formula, convenience foods, snacks and confectionery, drinks, others), the paper industry, the feed industry and others (pharmaceuticals, cosmetics, textiles).

By region, it covers North America, Latin America, Western Europe, Eastern Europe, East Asia, South Asia, the Pacific, the Middle East and Africa.

By Source, Corn Accounts for 36.1% of the Market Share in 2025

Corn is projected to remain the most lucrative source segment, accounting for approximately 36.1% of the market share in 2025. Its widespread use in processed and convenience foods is attributed to superior thickening, stabilizing, and moisture-retention capabilities.

Compared to wheat and potato starch, corn starch offers better compatibility with dry mix formulations and high-volume industrial processes, making it the preferred choice in bakery mixes, soups, and snack production. Additionally, it is cost-effective and readily available in key production regions such as the USA, China, and Brazil.
  • High demand for soups, sauces, and baked snacks
  • Preferred in dry-mix, heat-stable food applications
  • Supported by large-scale corn production economies

Native Starches Market Analysis By Source

By Form, Powdered Native Starch Accounts for a Significant Market Share of 87.2%

Powdered native starch is expected to dominate the form segment, accounting for approximately 87.2% of the market share in 2025. This dominance is driven by its superior shelf-stability, easy solubility, and high compatibility with diverse food systems. The powdered form simplifies transportation and storage while offering consistent functional performance across multiple applications.

It is widely used in dry mixes, seasoning blends, bakery premixes, and powdered sauces. Furthermore, its seamless integration with automated production lines makes it an essential component in industrial food processing.

  • Preferred for storage, solubility, and blending flexibility
  • High usage in dry food and bakery manufacturing lines
  • Growing adoption of convenience and ready-to-cook foods

By End Use, Food and Beverages to Hold the Largest Share at 41.5% in 2025

The food and beverages industry is poised to dominate end-use applications, holding 41.5% of the global market share in 2025. This is driven by growing demand for clean-label, non-GMO, and allergen-free ingredients. Within this segment, dairy, bakery, and convenience foods use native starch for texturizing, moisture retention, and improving mouthfeel. The clean label movement, coupled with plant-based diet trends, continues to accelerate starch replacement of synthetic thickeners across packaged foods.
  • High adoption in bakery, snacks, and dairy applications
  • Aligned with global clean-label and vegan trends
  • Supported by growing demand for processed and RTE foods

Native Starches Market Analysis By End Use

Top Native Starch Market Dynamics

Recent Trends in the Native Starch Market

  • Surge in demand for clean-label and non-GMO starches across bakery and snack categories.
  • Growing use of native starch in plant-based and allergen-free product formulations.
  • Advancements in enzyme and physical modification techniques to enhance starch functionality.
  • Rising popularity of native starch in pharmaceutical and cosmetic applications for natural ingredient labeling.

Challenges in the Native Starch Market

  • Limited heat and shear stability compared to modified starches restricts usage in high-intensity processes.
  • Price volatility of raw materials like corn and tapioca impacts production cost predictability.
  • Low awareness and adoption of native starch in industrial applications outside of food and beverages.
  • Supply chain disruptions and seasonal variability in crop yields affect availability and consistency.

Analyzing Top Countries Producing and Supplying Native Starch

Among the five leading countries in the native starch market, Japan is forecasted to grow the fastest with a CAGR of 5.5%, followed by the United States at 5.1% from 2025 to 2035. The United Kingdom and Germany are projected to grow at 4.6% and 4.1%, respectively, supported by rising clean-label adoption and regulatory changes.

France will see more modest expansion at 3.9% CAGR, driven by traditional food applications and growing interest in additive-free formulations. Overall, Asia and North America lead in pace, while Western Europe continues to grow steadily, focusing on reformulation and transparency.

The report covers an in-depth analysis of 40+ countries; five top-performing OECD countries are highlighted below.

USA Native Starch Market Analysis

The native starch market in the USA is projected to grow at a CAGR of 5.1% from 2025 to 2035. This growth is primarily attributed to rising consumer demand for clean-label and allergen-free ingredients, especially in the bakery, dairy, and snack segments.

The USA food processing industry continues to innovate with formulations that prioritize natural and non-GMO components, further driving starch applications.

  • Growing demand for gluten-free and natural food formulations.
  • Favorable raw material availability from extensive corn cultivation.
  • Expanding use in health-oriented processed food categories.

Native Starch Demand Analysis in the UK

The revenue from native starch in the UK is expected to register a CAGR of 4.6% from 2025 to 2035. Growth is supported by increasing regulatory pressure to replace chemically modified ingredients with natural alternatives.

British consumers show a strong preference for clean-label and organic food products, elevating the demand for native starch in sauces, soups, and ready meals.

  • Rising consumer preference for clean-label and organic foods.
  • Growing applications in sauces, gravies, and RTE meals.
  • Shift toward natural ingredients in food reformulation initiatives.

Germany Native Starch Industry Analysis

The native starch demand in Germany is anticipated to grow at a CAGR of 4.1% between 2025 and 2035. The country’s strong starch processing infrastructure and export-oriented manufacturing base play a central role in Europe’s starch supply chain.

Demand is driven by clean-label trends in bakery and infant nutrition, as well as innovations in pharmaceutical binders. Despite limited domestic crop availability, German producers focus on high-quality, precision-engineered starches tailored for advanced applications, including biodegradable materials and cosmetics.

  • Strong demand in bakery, dairy, and pharma applications.
  • Emphasis on starch-based bio-packaging and green chemistry.
  • Technological leadership in functional ingredient design.

Native Starch Sales Analysis in France

The native starch market in France is projected to expand at a CAGR of 3.9% during 2025 to 2035. France’s growth is moderate but consistent, fueled by demand for additive-free foods and traditional culinary formats.

French consumers are highly responsive to ingredient transparency, which has encouraged manufacturers to incorporate native starches into clean-label desserts, dressings, and sauces. Despite high regulatory standards and competition from modified starches, native starch adoption is rising in foodservice and gourmet retail channels.

  • Rising adoption of dairy desserts and culinary thickeners.
  • Clean-label trend strengthening retail and horeca usage.
  • Regulatory push for natural ingredient labeling and claims.

Japan Native Starch Demand Analysis

The native starch industry in Japan is forecasted to grow at a CAGR of 5.5% from 2025 to 2035. High demand stems from Japan’s precision-oriented food culture, where native starch is used extensively in traditional items like mochi and soups, as well as in modern processed foods.

The country emphasizes quality and texture, favoring native starches for their purity and performance. Additionally, Japan’s biotech and pharma sectors are utilizing native starch as a binder and excipient, expanding its role beyond food applications.

  • Strong presence in traditional foods and snacks.
  • Innovation in pharma-grade and nutraceutical starches.
  • High demand for minimally processed and pure ingredients.

Leading Native Starch Suppliers

The market is moderately consolidated, with a few global leaders-such as Ingredion Inc., Cargill Inc., Tate & Lyle PLC, Archer Daniels Midland Company (ADM), and Roquette Frères S.A., commanding a significant share of global revenues. These Tier 1 companies compete through innovation in clean-label formulations, expansion into plant-based and specialty starches, and strategic acquisitions to diversify their portfolios.

Ingredion has expanded its clean-label offerings with the launch of NOVATION® Indulge 2940, a functional native corn starch designed for dairy and alternative dairy applications. Tate & Lyle's acquisition of CP Kelco in November 2024 for USD 1.8 billion aims to strengthen its position in the specialty ingredients sector.

Roquette has introduced new tapioca-based cook-up starches, enhancing its texturizing solutions range. Meanwhile, ADM faces challenges due to accounting irregularities and profit outlook cuts, prompting a focus on cost controls and operational resilience.

Recent Native Starch Industry News

In February 2024, Ingredion launched NOVATION® Indulge 2940, a non-GMO functional native corn starch for clean-label and health-focused food applications in North America, expanding globally soon after.

Native Starch Market Report Scope

Report Attributes Details
Current Total Market Size (2025) USD 1.8 billion
Projected Market Size (2035) USD 2.9 billion
CAGR (2025 to 2035) 5.7%
Base Year for Estimation 2024
Historical Period 2020 to 2024
Projections Period 2025 to 2035
Market Analysis Parameters Revenue in USD billions/Volume in kilotons
By Source Corn, Wheat, Potatoes, Tapioca, Others (Rice, Cassava, Arrowroot)
By Form Powder, Liquid
By End Use Food and Beverages (Dairy, Bakery, Soups & Sauces, Infant Formula, Snacks, Convenience Foods, Beverages, Others), Paper Industry, Feed Industry, Others (Pharma, Cosmetics, Textiles)
Regions Covered North America, Latin America, Western Europe, Eastern Europe, East Asia, South Asia , Pacific, Middle East and Africa
Countries Covered United States, Canada, United Kingdom, Germany, France, China, Japan, South Korea, Brazil, Australia
Key Players Ingredion, Inc., Cargill, Inc., E. I. du Pont de Nemours, Tate & Lyle PLC, Archer Daniels Midland Company, Roquette Frères S.A., Euroduna Food Ingredients GmbH, BENEO GmbH, Kent Corporation, MGP Ingredients, Inc., AGRANA - Beteiligungs AG
Additional Attributes Dollar sales by value, market share analysis by region, and country-wise analysis

Key Segments of Market Report

By Source:

As per product type, the target market has been categorized into Corn, Wheat, Potatoes, Tapioca and Others

By End Use:

As per the application, the target market is sub-segmented into Food and Beverages (Dairy Products, Bakery, Soups, Sauces, and Dressings, Infant Formula, Convenience Foods, Snacks and Confectionery, Beverages Others) Paper Industry and Feed Industry

By Form:

Powder and Liquid are key two forms

By Region:

Industry analysis has been carried out in key countries of the regions such as North America, Latin America, Europe, East Asia, South Asia, Oceania, and the Middle East & Africa.

Table of Content

  1. Executive Summary
    • Global Market Outlook
    • Demand-side Trends
    • Supply-side Trends
    • Technology Roadmap Analysis
    • Analysis and Recommendations
  2. Market Overview
    • Market Coverage / Taxonomy
    • Market Definition / Scope / Limitations
  3. Market Background
    • Market Dynamics
      • Drivers
      • Restraints
      • Opportunity
      • Trends
    • Scenario Forecast
      • Demand in Optimistic Scenario
      • Demand in Likely Scenario
      • Demand in Conservative Scenario
    • Opportunity Map Analysis
    • Product Life Cycle Analysis
    • Supply Chain Analysis
      • Supply Side Participants and their Roles
        • Producers
        • Mid-Level Participants (Traders/ Agents/ Brokers)
        • Wholesalers and Distributors
      • Value Added and Value Created at Node in the Supply Chain
      • List of Raw Material Suppliers
      • List of Existing and Potential Buyer’s
    • Investment Feasibility Matrix
    • Value Chain Analysis
      • Profit Margin Analysis
      • Wholesalers and Distributors
      • Retailers
    • PESTLE and Porter’s Analysis
    • Regulatory Landscape
      • By Key Regions
      • By Key Countries
    • Regional Parent Market Outlook
    • Production and Consumption Statistics
    • Import and Export Statistics
  4. Global Market Analysis 2020 to 2024 and Forecast, 2025 to 2035
    • Historical Market Size Value (USD Billion) & Volume (Kilotons) Analysis, 2020 to 2024
    • Current and Future Market Size Value (USD Billion) & Volume (Kilotons) Projections, 2025 to 2035
      • Y-o-Y Growth Trend Analysis
      • Absolute $ Opportunity Analysis
  5. Global Market Pricing Analysis 2020 to 2024 and Forecast 2025 to 2035
  6. Global Market Analysis 2020 to 2024 and Forecast 2025 to 2035, By Source
    • Introduction / Key Findings
    • Historical Market Size Value (USD Billion) & Volume (Kilotons) Analysis By Source, 2020 to 2024
    • Current and Future Market Size Value (USD Billion) & Volume (Kilotons) Analysis and Forecast By Source, 2025 to 2035
      • Corn
      • Wheat
      • Potatoes
      • Tapioca
      • Others
    • Y-o-Y Growth Trend Analysis By Source, 2020 to 2024
    • Absolute $ Opportunity Analysis By Source, 2025 to 2035
  7. Global Market Analysis 2020 to 2024 and Forecast 2025 to 2035, By Form
    • Introduction / Key Findings
    • Historical Market Size Value (USD Billion) & Volume (Kilotons) Analysis By Form, 2020 to 2024
    • Current and Future Market Size Value (USD Billion) & Volume (Kilotons) Analysis and Forecast By Form, 2025 to 2035
      • Powder
      • Liquid
    • Y-o-Y Growth Trend Analysis By Form, 2020 to 2024
    • Absolute $ Opportunity Analysis By Form, 2025 to 2035
  8. Global Market Analysis 2020 to 2024 and Forecast 2025 to 2035, By End Use
    • Introduction / Key Findings
    • Historical Market Size Value (USD Billion) & Volume (Kilotons) Analysis By End Use, 2020 to 2024
    • Current and Future Market Size Value (USD Billion) & Volume (Kilotons) Analysis and Forecast By End Use, 2025 to 2035
      • Food and Beverages
        • Dairy Products
        • Bakery
        • Soups, Sauces, and Dressings
        • Infant Formula
        • Convenience Foods
        • Snacks and Confectionery
        • Beverages
        • Others
      • Paper Industry
      • Feed Industry
      • Others
    • Y-o-Y Growth Trend Analysis By End Use, 2020 to 2024
    • Absolute $ Opportunity Analysis By End Use, 2025 to 2035
  9. Global Market Analysis 2020 to 2024 and Forecast 2025 to 2035, By Region
    • Introduction
    • Historical Market Size Value (USD Billion) & Volume (Kilotons) Analysis By Region, 2020 to 2024
    • Current Market Size Value (USD Billion) & Volume (Kilotons) Analysis and Forecast By Region, 2025 to 2035
      • North America
      • Latin America
      • Western Europe
      • Eastern Europe
      • East Asia
      • South Asia & Pacific
      • Middle East and Africa
    • Market Attractiveness Analysis By Region
  10. North America Market Analysis 2020 to 2024 and Forecast 2025 to 2035, By Country
    • Historical Market Size Value (USD Billion) & Volume (Kilotons) Trend Analysis By Market Taxonomy, 2020 to 2024
    • Market Size Value (USD Billion) & Volume (Kilotons) Forecast By Market Taxonomy, 2025 to 2035
      • By Country
        • USA
        • Canada
        • Mexico
      • By Source
      • By Form
      • By End Use
    • Market Attractiveness Analysis
      • By Country
      • By Source
      • By Form
      • By End Use
    • Key Takeaways
  11. Latin America Market Analysis 2020 to 2024 and Forecast 2025 to 2035, By Country
    • Historical Market Size Value (USD Billion) & Volume (Kilotons) Trend Analysis By Market Taxonomy, 2020 to 2024
    • Market Size Value (USD Billion) & Volume (Kilotons) Forecast By Market Taxonomy, 2025 to 2035
      • By Country
        • Brazil
        • Argentina
        • Rest of LATAM
      • By Source
      • By Form
      • By End Use
    • Market Attractiveness Analysis
      • By Country
      • By Source
      • By Form
      • By End Use
    • Key Takeaways
  12. Western Europe Market Analysis 2020 to 2024 and Forecast 2025 to 2035, By Country
    • Historical Market Size Value (USD Billion) & Volume (Kilotons) Trend Analysis By Market Taxonomy, 2020 to 2024
    • Market Size Value (USD Billion) & Volume (Kilotons) Forecast By Market Taxonomy, 2025 to 2035
      • By Country
        • Germany
        • Italy
        • France
        • UK
        • Spain
        • BENELUX
        • Nordic
        • Rest of W.Europe
      • By Source
      • By Form
      • By End Use
    • Market Attractiveness Analysis
      • By Country
      • By Source
      • By Form
      • By End Use
    • Key Takeaways
  13. Eastern Europe Market Analysis 2020 to 2024 and Forecast 2025 to 2035, By Country
    • Historical Market Size Value (USD Billion) & Volume (Kilotons) Trend Analysis By Market Taxonomy, 2020 to 2024
    • Market Size Value (USD Billion) & Volume (Kilotons) Forecast By Market Taxonomy, 2025 to 2035
      • By Country
        • Russia
        • Hungary
        • Poland
        • Balkan & Baltics
        • Rest of E. Europe
      • By Source
      • By Form
      • By End Use
    • Market Attractiveness Analysis
      • By Country
      • By Source
      • By Form
      • By End Use
    • Key Takeaways
  14. East Asia Market Analysis 2020 to 2024 and Forecast 2025 to 2035, By Country
    • Historical Market Size Value (USD Billion) & Volume (Kilotons) Trend Analysis By Market Taxonomy, 2020 to 2024
    • Market Size Value (USD Billion) & Volume (Kilotons) Forecast By Market Taxonomy, 2025 to 2035
      • By Country
        • China
        • Japan
        • South Korea
      • By Source
      • By Form
      • By End Use
    • Market Attractiveness Analysis
      • By Country
      • By Source
      • By Form
      • By End Use
    • Key Takeaways
  15. South Asia & Pacific Market Analysis 2020 to 2024 and Forecast 2025 to 2035, By Country
    • Historical Market Size Value (USD Billion) & Volume (Kilotons) Trend Analysis By Market Taxonomy, 2020 to 2024
    • Market Size Value (USD Billion) & Volume (Kilotons) Forecast By Market Taxonomy, 2025 to 2035
      • By Country
        • India
        • Australia & New Zealand
        • ASEAN
        • Rest of SAP
      • By Source
      • By Form
      • By End Use
    • Market Attractiveness Analysis
      • By Country
      • By Source
      • By Form
      • By End Use
    • Key Takeaways
  16. Middle East and Africa Market Analysis 2020 to 2024 and Forecast 2025 to 2035, By Country
    • Historical Market Size Value (USD Billion) & Volume (Kilotons) Trend Analysis By Market Taxonomy, 2020 to 2024
    • Market Size Value (USD Billion) & Volume (Kilotons) Forecast By Market Taxonomy, 2025 to 2035
      • By Country
        • GCC Countries
        • Northern Africa
        • South Africa
        • Turkiye
        • Rest of MEA
      • By Source
      • By Form
      • By End Use
    • Market Attractiveness Analysis
      • By Country
      • By Source
      • By Form
      • By End Use
    • Key Takeaways
  17. Key Countries Market Analysis
    • USA
      • Pricing Analysis
      • Market Share Analysis, 2024
        • By Source
        • By Form
        • By End Use
    • Canada
      • Pricing Analysis
      • Market Share Analysis, 2024
        • By Source
        • By Form
        • By End Use
    • Brazil
      • Pricing Analysis
      • Market Share Analysis, 2024
        • By Source
        • By Form
        • By End Use
    • Mexico
      • Pricing Analysis
      • Market Share Analysis, 2024
        • By Source
        • By Form
        • By End Use
    • Argentina
      • Pricing Analysis
      • Market Share Analysis, 2024
        • By Source
        • By Form
        • By End Use
  18. Market Structure Analysis
    • Competition Dashboard
    • Competition Benchmarking
    • Market Share Analysis of Top Players
      • By Regional
      • By Source
      • By Form
      • By End Use
  19. Competition Analysis
    • Competition Deep Dive
      • Ingredion, Inc., Cargill, Inc.
        • Overview
        • Product Portfolio
        • Profitability by Market Segments (Product/Age /Sales Channel/Region)
        • Sales Footprint
        • Strategy Overview
          • Marketing Strategy
          • Product Strategy
          • Channel Strategy
      • E. I. du Pont de Nemours
        • Overview
        • Product Portfolio
        • Profitability by Market Segments (Product/Age /Sales Channel/Region)
        • Sales Footprint
        • Strategy Overview
          • Marketing Strategy
          • Product Strategy
          • Channel Strategy
      • Tate & Lyle PLC
        • Overview
        • Product Portfolio
        • Profitability by Market Segments (Product/Age /Sales Channel/Region)
        • Sales Footprint
        • Strategy Overview
          • Marketing Strategy
          • Product Strategy
          • Channel Strategy
      • Archer Daniels Midland Company
        • Overview
        • Product Portfolio
        • Profitability by Market Segments (Product/Age /Sales Channel/Region)
        • Sales Footprint
        • Strategy Overview
          • Marketing Strategy
          • Product Strategy
          • Channel Strategy
      • Roquette Frères S.A.
        • Overview
        • Product Portfolio
        • Profitability by Market Segments (Product/Age /Sales Channel/Region)
        • Sales Footprint
        • Strategy Overview
          • Marketing Strategy
          • Product Strategy
          • Channel Strategy
      • Euroduna Food Ingredients GmbH
        • Overview
        • Product Portfolio
        • Profitability by Market Segments (Product/Age /Sales Channel/Region)
        • Sales Footprint
        • Strategy Overview
          • Marketing Strategy
          • Product Strategy
          • Channel Strategy
      • BENEO GmbH
        • Overview
        • Product Portfolio
        • Profitability by Market Segments (Product/Age /Sales Channel/Region)
        • Sales Footprint
        • Strategy Overview
          • Marketing Strategy
          • Product Strategy
          • Channel Strategy
      • Kent Corporation
        • Overview
        • Product Portfolio
        • Profitability by Market Segments (Product/Age /Sales Channel/Region)
        • Sales Footprint
        • Strategy Overview
          • Marketing Strategy
          • Product Strategy
          • Channel Strategy
      • MGP Ingredients, Inc.
        • Overview
        • Product Portfolio
        • Profitability by Market Segments (Product/Age /Sales Channel/Region)
        • Sales Footprint
        • Strategy Overview
          • Marketing Strategy
          • Product Strategy
          • Channel Strategy
      • AGRANA - Beteiligungs AG
        • Overview
        • Product Portfolio
        • Profitability by Market Segments (Product/Age /Sales Channel/Region)
        • Sales Footprint
        • Strategy Overview
          • Marketing Strategy
          • Product Strategy
          • Channel Strategy
  20. Assumptions & Acronyms Used
  21. Research Methodology

List of Tables

  • Table 1: Global Market Value (USD billion) Forecast by Region, 2020 to 2035
  • Table 2: Global Market Volume (Kilotons) Forecast by Region, 2020 to 2035
  • Table 3: Global Market Value (USD billion) Forecast by Source, 2020 to 2035
  • Table 4: Global Market Volume (Kilotons) Forecast by Source, 2020 to 2035
  • Table 5: Global Market Value (USD billion) Forecast by Form, 2020 to 2035
  • Table 6: Global Market Volume (Kilotons) Forecast by Form, 2020 to 2035
  • Table 7: Global Market Value (USD billion) Forecast by End Use, 2020 to 2035
  • Table 8: Global Market Volume (Kilotons) Forecast by End Use, 2020 to 2035
  • Table 9: North America Market Value (USD billion) Forecast by Country, 2020 to 2035
  • Table 10: North America Market Volume (Kilotons) Forecast by Country, 2020 to 2035
  • Table 11: North America Market Value (USD billion) Forecast by Source, 2020 to 2035
  • Table 12: North America Market Volume (Kilotons) Forecast by Source, 2020 to 2035
  • Table 13: North America Market Value (USD billion) Forecast by Form, 2020 to 2035
  • Table 14: North America Market Volume (Kilotons) Forecast by Form, 2020 to 2035
  • Table 15: North America Market Value (USD billion) Forecast by End Use, 2020 to 2035
  • Table 16: North America Market Volume (Kilotons) Forecast by End Use, 2020 to 2035
  • Table 17: Latin America Market Value (USD billion) Forecast by Country, 2020 to 2035
  • Table 18: Latin America Market Volume (Kilotons) Forecast by Country, 2020 to 2035
  • Table 19: Latin America Market Value (USD billion) Forecast by Source, 2020 to 2035
  • Table 20: Latin America Market Volume (Kilotons) Forecast by Source, 2020 to 2035
  • Table 21: Latin America Market Value (USD billion) Forecast by Form, 2020 to 2035
  • Table 22: Latin America Market Volume (Kilotons) Forecast by Form, 2020 to 2035
  • Table 23: Latin America Market Value (USD billion) Forecast by End Use, 2020 to 2035
  • Table 24: Latin America Market Volume (Kilotons) Forecast by End Use, 2020 to 2035
  • Table 25: Western Europe Market Value (USD billion) Forecast by Country, 2020 to 2035
  • Table 26: Western Europe Market Volume (Kilotons) Forecast by Country, 2020 to 2035
  • Table 27: Western Europe Market Value (USD billion) Forecast by Source, 2020 to 2035
  • Table 28: Western Europe Market Volume (Kilotons) Forecast by Source, 2020 to 2035
  • Table 29: Western Europe Market Value (USD billion) Forecast by Form, 2020 to 2035
  • Table 30: Western Europe Market Volume (Kilotons) Forecast by Form, 2020 to 2035
  • Table 31: Western Europe Market Value (USD billion) Forecast by End Use, 2020 to 2035
  • Table 32: Western Europe Market Volume (Kilotons) Forecast by End Use, 2020 to 2035
  • Table 33: Eastern Europe Market Value (USD billion) Forecast by Country, 2020 to 2035
  • Table 34: Eastern Europe Market Volume (Kilotons) Forecast by Country, 2020 to 2035
  • Table 35: Eastern Europe Market Value (USD billion) Forecast by Source, 2020 to 2035
  • Table 36: Eastern Europe Market Volume (Kilotons) Forecast by Source, 2020 to 2035
  • Table 37: Eastern Europe Market Value (USD billion) Forecast by Form, 2020 to 2035
  • Table 38: Eastern Europe Market Volume (Kilotons) Forecast by Form, 2020 to 2035
  • Table 39: Eastern Europe Market Value (USD billion) Forecast by End Use, 2020 to 2035
  • Table 40: Eastern Europe Market Volume (Kilotons) Forecast by End Use, 2020 to 2035
  • Table 41: East Asia Market Value (USD billion) Forecast by Country, 2020 to 2035
  • Table 42: East Asia Market Volume (Kilotons) Forecast by Country, 2020 to 2035
  • Table 43: East Asia Market Value (USD billion) Forecast by Source, 2020 to 2035
  • Table 44: East Asia Market Volume (Kilotons) Forecast by Source, 2020 to 2035
  • Table 45: East Asia Market Value (USD billion) Forecast by Form, 2020 to 2035
  • Table 46: East Asia Market Volume (Kilotons) Forecast by Form, 2020 to 2035
  • Table 47: East Asia Market Value (USD billion) Forecast by End Use, 2020 to 2035
  • Table 48: East Asia Market Volume (Kilotons) Forecast by End Use, 2020 to 2035
  • Table 49: South Asia & Pacific Market Value (USD billion) Forecast by Country, 2020 to 2035
  • Table 50: South Asia & Pacific Market Volume (Kilotons) Forecast by Country, 2020 to 2035
  • Table 51: South Asia & Pacific Market Value (USD billion) Forecast by Source, 2020 to 2035
  • Table 52: South Asia & Pacific Market Volume (Kilotons) Forecast by Source, 2020 to 2035
  • Table 53: South Asia & Pacific Market Value (USD billion) Forecast by Form, 2020 to 2035
  • Table 54: South Asia & Pacific Market Volume (Kilotons) Forecast by Form, 2020 to 2035
  • Table 55: South Asia & Pacific Market Value (USD billion) Forecast by End Use, 2020 to 2035
  • Table 56: South Asia & Pacific Market Volume (Kilotons) Forecast by End Use, 2020 to 2035
  • Table 57: Middle East and Africa Market Value (USD billion) Forecast by Country, 2020 to 2035
  • Table 58: Middle East and Africa Market Volume (Kilotons) Forecast by Country, 2020 to 2035
  • Table 59: Middle East and Africa Market Value (USD billion) Forecast by Source, 2020 to 2035
  • Table 60: Middle East and Africa Market Volume (Kilotons) Forecast by Source, 2020 to 2035
  • Table 61: Middle East and Africa Market Value (USD billion) Forecast by Form, 2020 to 2035
  • Table 62: Middle East and Africa Market Volume (Kilotons) Forecast by Form, 2020 to 2035
  • Table 63: Middle East and Africa Market Value (USD billion) Forecast by End Use, 2020 to 2035
  • Table 64: Middle East and Africa Market Volume (Kilotons) Forecast by End Use, 2020 to 2035

List of Figures

  • Figure 1: Global Market Volume (Kilotons) Forecast 2020 to 2035
  • Figure 2: Global Market Pricing Analysis
  • Figure 3: Global Market Value (USD billion) Forecast 2020 to 2035
  • Figure 4: Global Market Value Share and BPS Analysis by Source, 2025 and 2035
  • Figure 5: Global Market Y-o-Y Growth Comparison by Source, 2025 to 2035
  • Figure 6: Global Market Attractiveness Analysis by Source
  • Figure 7: Global Market Value Share and BPS Analysis by Form, 2025 and 2035
  • Figure 8: Global Market Y-o-Y Growth Comparison by Form, 2025 to 2035
  • Figure 9: Global Market Attractiveness Analysis by Form
  • Figure 10: Global Market Value Share and BPS Analysis by End Use, 2025 and 2035
  • Figure 11: Global Market Y-o-Y Growth Comparison by End Use, 2025 to 2035
  • Figure 12: Global Market Attractiveness Analysis by End Use
  • Figure 13: Global Market Value (USD billion) Share and BPS Analysis by Region, 2025 and 2035
  • Figure 14: Global Market Y-o-Y Growth Comparison by Region, 2025 to 2035
  • Figure 15: Global Market Attractiveness Analysis by Region
  • Figure 16: North America Market Incremental $ Opportunity, 2025 to 2035
  • Figure 17: Latin America Market Incremental $ Opportunity, 2025 to 2035
  • Figure 18: Western Europe Market Incremental $ Opportunity, 2025 to 2035
  • Figure 19: Eastern Europe Market Incremental $ Opportunity, 2025 to 2035
  • Figure 20: East Asia Market Incremental $ Opportunity, 2025 to 2035
  • Figure 21: South Asia & Pacific Market Incremental $ Opportunity, 2025 to 2035
  • Figure 22: Middle East and Africa Market Incremental $ Opportunity, 2025 to 2035
  • Figure 23: North America Market Value Share and BPS Analysis by Country, 2025 and 2035
  • Figure 24: North America Market Value Share and BPS Analysis by Source, 2025 and 2035
  • Figure 25: North America Market Y-o-Y Growth Comparison by Source, 2025 to 2035
  • Figure 26: North America Market Attractiveness Analysis by Source
  • Figure 27: North America Market Value Share and BPS Analysis by Form, 2025 and 2035
  • Figure 28: North America Market Y-o-Y Growth Comparison by Form, 2025 to 2035
  • Figure 29: North America Market Attractiveness Analysis by Form
  • Figure 30: North America Market Value Share and BPS Analysis by End Use, 2025 and 2035
  • Figure 31: North America Market Y-o-Y Growth Comparison by End Use, 2025 to 2035
  • Figure 32: North America Market Attractiveness Analysis by End Use
  • Figure 33: Latin America Market Value Share and BPS Analysis by Country, 2025 and 2035
  • Figure 34: Latin America Market Value Share and BPS Analysis by Source, 2025 and 2035
  • Figure 35: Latin America Market Y-o-Y Growth Comparison by Source, 2025 to 2035
  • Figure 36: Latin America Market Attractiveness Analysis by Source
  • Figure 37: Latin America Market Value Share and BPS Analysis by Form, 2025 and 2035
  • Figure 38: Latin America Market Y-o-Y Growth Comparison by Form, 2025 to 2035
  • Figure 39: Latin America Market Attractiveness Analysis by Form
  • Figure 40: Latin America Market Value Share and BPS Analysis by End Use, 2025 and 2035
  • Figure 41: Latin America Market Y-o-Y Growth Comparison by End Use, 2025 to 2035
  • Figure 42: Latin America Market Attractiveness Analysis by End Use
  • Figure 43: Western Europe Market Value Share and BPS Analysis by Country, 2025 and 2035
  • Figure 44: Western Europe Market Value Share and BPS Analysis by Source, 2025 and 2035
  • Figure 45: Western Europe Market Y-o-Y Growth Comparison by Source, 2025 to 2035
  • Figure 46: Western Europe Market Attractiveness Analysis by Source
  • Figure 47: Western Europe Market Value Share and BPS Analysis by Form, 2025 and 2035
  • Figure 48: Western Europe Market Y-o-Y Growth Comparison by Form, 2025 to 2035
  • Figure 49: Western Europe Market Attractiveness Analysis by Form
  • Figure 50: Western Europe Market Value Share and BPS Analysis by End Use, 2025 and 2035
  • Figure 51: Western Europe Market Y-o-Y Growth Comparison by End Use, 2025 to 2035
  • Figure 52: Western Europe Market Attractiveness Analysis by End Use
  • Figure 53: Eastern Europe Market Value Share and BPS Analysis by Country, 2025 and 2035
  • Figure 54: Eastern Europe Market Value Share and BPS Analysis by Source, 2025 and 2035
  • Figure 55: Eastern Europe Market Y-o-Y Growth Comparison by Source, 2025 to 2035
  • Figure 56: Eastern Europe Market Attractiveness Analysis by Source
  • Figure 57: Eastern Europe Market Value Share and BPS Analysis by Form, 2025 and 2035
  • Figure 58: Eastern Europe Market Y-o-Y Growth Comparison by Form, 2025 to 2035
  • Figure 59: Eastern Europe Market Attractiveness Analysis by Form
  • Figure 60: Eastern Europe Market Value Share and BPS Analysis by End Use, 2025 and 2035
  • Figure 61: Eastern Europe Market Y-o-Y Growth Comparison by End Use, 2025 to 2035
  • Figure 62: Eastern Europe Market Attractiveness Analysis by End Use
  • Figure 63: East Asia Market Value Share and BPS Analysis by Country, 2025 and 2035
  • Figure 64: East Asia Market Value Share and BPS Analysis by Source, 2025 and 2035
  • Figure 65: East Asia Market Y-o-Y Growth Comparison by Source, 2025 to 2035
  • Figure 66: East Asia Market Attractiveness Analysis by Source
  • Figure 67: East Asia Market Value Share and BPS Analysis by Form, 2025 and 2035
  • Figure 68: East Asia Market Y-o-Y Growth Comparison by Form, 2025 to 2035
  • Figure 69: East Asia Market Attractiveness Analysis by Form
  • Figure 70: East Asia Market Value Share and BPS Analysis by End Use, 2025 and 2035
  • Figure 71: East Asia Market Y-o-Y Growth Comparison by End Use, 2025 to 2035
  • Figure 72: East Asia Market Attractiveness Analysis by End Use
  • Figure 73: South Asia & Pacific Market Value Share and BPS Analysis by Country, 2025 and 2035
  • Figure 74: South Asia & Pacific Market Value Share and BPS Analysis by Source, 2025 and 2035
  • Figure 75: South Asia & Pacific Market Y-o-Y Growth Comparison by Source, 2025 to 2035
  • Figure 76: South Asia & Pacific Market Attractiveness Analysis by Source
  • Figure 77: South Asia & Pacific Market Value Share and BPS Analysis by Form, 2025 and 2035
  • Figure 78: South Asia & Pacific Market Y-o-Y Growth Comparison by Form, 2025 to 2035
  • Figure 79: South Asia & Pacific Market Attractiveness Analysis by Form
  • Figure 80: South Asia & Pacific Market Value Share and BPS Analysis by End Use, 2025 and 2035
  • Figure 81: South Asia & Pacific Market Y-o-Y Growth Comparison by End Use, 2025 to 2035
  • Figure 82: South Asia & Pacific Market Attractiveness Analysis by End Use
  • Figure 83: Middle East and Africa Market Value Share and BPS Analysis by Country, 2025 and 2035
  • Figure 84: Middle East and Africa Market Value Share and BPS Analysis by Source, 2025 and 2035
  • Figure 85: Middle East and Africa Market Y-o-Y Growth Comparison by Source, 2025 to 2035
  • Figure 86: Middle East and Africa Market Attractiveness Analysis by Source
  • Figure 87: Middle East and Africa Market Value Share and BPS Analysis by Form, 2025 and 2035
  • Figure 88: Middle East and Africa Market Y-o-Y Growth Comparison by Form, 2025 to 2035
  • Figure 89: Middle East and Africa Market Attractiveness Analysis by Form
  • Figure 90: Middle East and Africa Market Value Share and BPS Analysis by End Use, 2025 and 2035
  • Figure 91: Middle East and Africa Market Y-o-Y Growth Comparison by End Use, 2025 to 2035
  • Figure 92: Middle East and Africa Market Attractiveness Analysis by End Use
  • Figure 93: Global Market - Tier Structure Analysis
  • Figure 94: Global Market - Company Share Analysis

Frequently Asked Questions

What is the projected size of the native starch market in 2025?

The market is valued at USD 1.8 billion in 2025.

What is the outlook on native starch demand by 2035?

The market is forecasted to reach USD 2.9 billion by 2035, reflecting a CAGR of 5.7%.

Which source type leads the native starch market in 2025?

Corn starch is expected to lead the market with a 36.1% share in 2025.

What is the projected share of food and beverages in the end-use segment by 2025?

Food and beverages are expected to hold a 41.5% share of the market in 2025.

Which country is projected to have the fastest-growing native starch market?

Japan is anticipated to be the fastest-growing market with a CAGR of 5.5% from 2025 to 2035.

Explore Similar Insights

Future Market Insights

Native Starch Market