The global electric sub-meter market is valued at USD 16.7 billion in 2025 and is slated to reach USD 31.9 billion by 2035, recording an absolute increase of USD 15.2 billion over the forecast period. This translates into a total growth of 91.1%, with the market forecast to expand at a compound annual growth rate (CAGR) of 6.7% between 2025 and 2035. The overall market size is expected to grow by nearly 1.9X during the same period, supported by increasing digitization of grid infrastructure, rising urbanization demands, and growing adoption of smart city programs across diverse energy management applications.
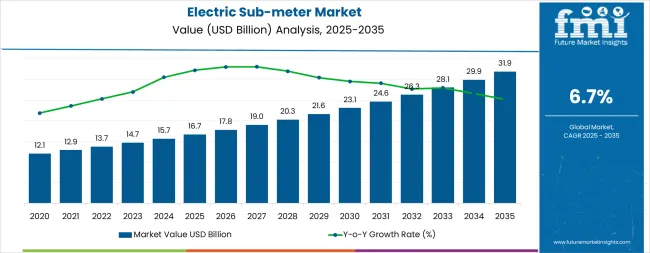
Between 2025 and 2030, the electric sub-meter market is projected to expand from USD 16.7 billion to USD 22.9 billion, resulting in a value increase of USD 6.2 billion, which represents 40.8% of the total forecast growth for the decade. This phase of development will be shaped by increasing smart grid modernization projects, rising energy efficiency mandates, and growing adoption of IoT-enabled metering solutions in commercial and residential applications. Equipment manufacturers are expanding their production capabilities to address the growing demand for intelligent energy monitoring solutions and enhanced operational transparency.
| Metric | Value |
|---|---|
| Estimated Value in (2025E) | USD 16.7 billion |
| Forecast Value in (2035F) | USD 31.9 billion |
| Forecast CAGR (2025 to 2035) | 6.7% |
From 2030 to 2035, the market is forecast to grow from USD 22.9 billion to USD 31.9 billion, adding another USD 9 billion, which constitutes 59.2% of the overall ten-year expansion. This period is expected to be characterized by the expansion of smart metering systems, the integration of advanced analytics capabilities, and the development of comprehensive energy management platforms for major commercial and industrial facilities. The growing adoption of real-time monitoring programs and building automation initiatives will drive demand for electric sub-meters with enhanced connectivity and reduced operational complexity.
Between 2020 and 2025, the electric sub-meter market experienced steady growth, driven by increasing energy efficiency requirements and growing recognition of sub-metering as essential infrastructure for accurate consumption tracking and cost allocation. The market developed as utilities and building operators recognized the potential for advanced metering systems to enhance operational transparency while reducing energy waste and improving billing accuracy. Technological advancement in IoT connectivity and wireless communication began emphasizing the critical importance of maintaining measurement precision and regulatory compliance in energy monitoring applications.
Market expansion is being supported by the increasing digitization of grid infrastructure and the corresponding need for accurate energy monitoring equipment that can maintain measurement reliability and billing transparency while supporting diverse energy management applications across various building environments. Modern utilities and building operators are increasingly focused on implementing metering solutions that can reduce operational complexity, minimize energy waste, and provide consistent performance in consumption tracking operations. Electric sub-meters' proven ability to deliver enhanced measurement accuracy, reliable data collection capabilities, and versatile energy monitoring applications make them essential equipment for contemporary energy management operations and building automation solutions.
The growing emphasis on smart grid development and operational efficiency is driving demand for electric sub-meters that can support real-time data collection, reduce billing disputes, and enable efficient energy allocation operations across varying building configurations. Building operators' preference for equipment that combines accuracy with connectivity and cost-effectiveness is creating opportunities for innovative metering implementations. The rising influence of energy efficiency regulations and building automation technologies is also contributing to increased adoption of electric sub-meters that can provide advanced monitoring control without compromising performance or regulatory compliance.
The electric sub-meter market is poised for robust growth and transformation. As utilities and building operators across both developed and emerging markets seek energy monitoring equipment that is accurate, connected, automated, and regulation-compliant, electric sub-metering systems are gaining prominence not just as measurement equipment but as strategic infrastructure for operational efficiency, cost allocation accuracy, energy management enhancement, and regulatory compliance.
Rising urbanization and smart city development in North America, Europe, and Asia Pacific amplify demand, while manufacturers are picking up on innovations in IoT connectivity and automation technologies.
Pathways like smart meter adoption, automation integration, and cloud-based analytics promise strong margin uplift, especially in developed markets. Geographic expansion and service diversification will capture volume, particularly where urbanization is growing or building infrastructure requires modernization. Energy efficiency pressures around consumption tracking, cost allocation, operational transparency, and regulatory compliance give structural support.
The market is segmented by product type, phase type, application, and region. By product type, the market is divided into socket type/electromechanical sub-meter (feed-through sub-meter and current transformer), non-socket/electronic sub-meter, and smart sub-meter. By phase type, it covers single phase and three phase. By application, it is segmented into commercial establishments (SML retail stores, data centers, and others), industrial sector, and residential sector. Regionally, the market is divided into North America, Asia Pacific, Europe, and Rest of the World.
The smart sub-meter segment is projected to register the highest growth rate at 8.6% CAGR through 2035, positioning itself as the leading product innovation category. Building operators and utilities increasingly utilize smart sub-meters for their advanced connectivity, real-time monitoring capabilities, and integration compatibility with building automation systems across commercial, industrial, and residential applications. Smart sub-meter technology's IoT connectivity and data analytics capabilities directly address the energy management requirements for accurate consumption tracking and operational optimization in diverse building environments.
This product segment forms the foundation of modern energy monitoring operations, as it represents the technology with the greatest connectivity capabilities and advanced functionality across multiple applications and building scenarios. Operator investments in enhanced smart metering systems and digital integration continue to strengthen adoption among utilities and building managers. With operators prioritizing real-time visibility and automated reporting, smart sub-meters align with both operational efficiency objectives and regulatory compliance requirements, making them the central component of comprehensive energy monitoring strategies.
Three phase sub-meters are projected to demonstrate the highest growth rate at 7.4% CAGR through 2035, underscoring their critical role as the preferred solution for high-capacity electrical applications and industrial operations. Industrial operators prefer three phase sub-meters for their enhanced accuracy, load balancing capabilities, and ability to handle complex energy distribution while supporting equipment monitoring and power quality requirements. Positioned as essential equipment for modern industrial and commercial facilities, three phase meters offer both measurement advantages and system benefits.
The segment is supported by continuous innovation in industrial facility expansion and the growing availability of specialized metering configurations that enable efficient power monitoring with enhanced operational capabilities. Commercial building operators are investing in three phase solutions to support large-scale operations and multi-circuit monitoring. As industrial development becomes more prevalent and operational efficiency requirements increase, three phase applications will continue to dominate the growth market while supporting advanced metering utilization and facility management strategies.
Commercial establishments are projected to represent the fastest growing application segment at 7.9% CAGR through 2035, underscoring their critical role as the primary driver of sub-meter demand for retail operations, data centers, and multi-tenant facilities. Commercial operators prefer electric sub-meters for their accuracy, cost allocation capabilities, and ability to handle diverse tenant requirements while supporting billing transparency and energy management initiatives. Positioned as essential equipment for modern commercial operations, sub-meters offer both operational advantages and financial benefits.
The segment is supported by continuous innovation in commercial building development and the growing availability of specialized metering configurations that enable efficient cost allocation with enhanced transparency capabilities. Commercial property managers are investing in advanced metering solutions to support large-scale operations and tenant service delivery. As commercial development becomes more prevalent and operational efficiency requirements increase, commercial establishments will continue to dominate the application market while supporting advanced metering utilization and property management strategies.
The electric sub-meter market is advancing steadily due to increasing digitization of grid infrastructure and growing adoption of operational efficiency technologies that provide enhanced energy monitoring and billing accuracy across diverse building applications. However, the market faces challenges, including high initial installation costs, specialized maintenance infrastructure requirements, and varying regulatory requirements across different regional environments. Innovation in IoT connectivity and automation technologies continues to influence equipment development and market expansion patterns.
The growing expansion of smart grid infrastructure and building automation development is enabling equipment manufacturers to develop electric sub-metering systems that provide superior measurement accuracy, enhanced connectivity capabilities, and reliable performance in high-volume energy monitoring environments. Advanced sub-metering systems provide improved operational transparency while allowing more effective cost allocation and consistent data delivery across various applications and building requirements. Manufacturers are increasingly recognizing the competitive advantages of modern sub-metering capabilities for operational efficiency and energy management positioning.
Modern electric sub-meter manufacturers are incorporating IoT connectivity and automated data collection systems to enhance measurement accuracy, reduce operational costs, and ensure consistent performance delivery to building operators. These technologies improve system integration while enabling new applications, including predictive analytics and automated reporting solutions. Advanced technology integration also allows manufacturers to support premium equipment positioning and operational optimization beyond traditional energy monitoring equipment supply.
| Country | CAGR (2025-2035) |
|---|---|
| China | 6.9% |
| United States | 5.8% |
| Germany | 5.2% |
| United Kingdom | 4.5% |
| France | 4.8% |
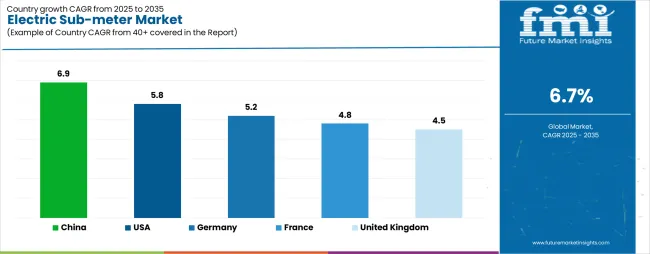
The electric sub-meter market is experiencing steady growth globally, with China leading at a 6.9% CAGR through 2035, driven by extensive smart city programs, massive urbanization projects, and significant adoption of digital metering solutions. USA follows at 5.8%, supported by federal decarbonization targets, advanced building codes, and growing adoption of energy efficiency technologies. Germany shows growth at 5.2%, emphasizing regulatory compliance and advanced manufacturing capabilities. United Kingdom records 4.5%, focusing on building efficiency standards and net-zero initiatives. France demonstrates 4.8% growth, supported by energy conservation regulations and building modernization programs.
Revenue from electric sub-meters in China is projected to exhibit exceptional growth with a CAGR of 6.9% through 2035, driven by extensive smart city infrastructure programs and rapidly growing adoption of digital metering solutions supported by urbanization initiatives and energy efficiency requirements. The country's comprehensive urban development strategy and increasing investment in building automation technologies are creating substantial demand for advanced sub-metering solutions. Major cities and industrial complexes are establishing comprehensive metering systems to serve both domestic operations and export market requirements.
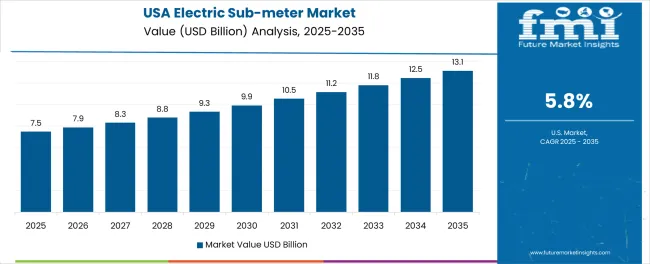
Revenue from electric sub-meters in USA is expanding at a CAGR of 5.8%, supported by the country's federal decarbonization targets, comprehensive building efficiency programs, and increasing adoption of automated energy monitoring systems. The country's advanced regulatory framework and growing commercial building demand are driving sophisticated sub-metering capabilities. Commercial property operators and utilities are establishing extensive metering operations to address the growing demand for accurate billing and operational transparency.
Revenue from electric sub-meters in Germany is expanding at a CAGR of 5.2%, supported by the country's comprehensive energy efficiency regulations, advanced technology capabilities, and extensive building modernization programs among commercial operators. The nation's mature regulatory environment and increasing emphasis on measurement accuracy are driving sophisticated sub-metering capabilities throughout the equipment market. Leading building operators and manufacturers are investing extensively in smart metering development and technology integration to serve both domestic energy needs and export markets.
Revenue from electric sub-meters in United Kingdom is growing at a CAGR of 4.5%, driven by expanding building efficiency programs, increasing regulatory compliance requirements, and growing investment in operational optimization enhancement. The country's established building standards and emphasis on net-zero initiatives are supporting demand for advanced sub-metering technologies across major commercial markets. Building operators and property managers are establishing comprehensive metering programs to serve both domestic efficiency needs and regulatory compliance requirements.
Revenue from electric sub-meters in France is expanding at a CAGR of 4.8%, supported by the country's focus on energy conservation regulations, comprehensive building modernization programs, and strategic investment in operational efficiency improvement. France's established building industry and emphasis on measurement accuracy are driving demand for specialized sub-metering technologies focusing on operational reliability and regulatory compliance. Building operators are investing in comprehensive metering modernization to serve both domestic efficiency requirements and commercial property operations.
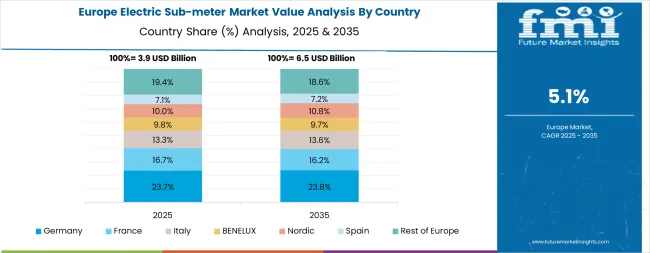
The electric sub-meter market in Europe is projected to grow from USD 4.1 billion in 2025 to USD 7.4 billion by 2035, registering a CAGR of 6.1% over the forecast period. Germany is expected to maintain its leadership position with a 29.3% market share in 2025, increasing to 29.8% by 2035, supported by its advanced regulatory framework, comprehensive energy efficiency programs, and major industrial facilities serving European and international markets.
France follows with a 19.5% share in 2025, projected to reach 19.7% by 2035, driven by energy conservation regulations, building modernization programs, and established commercial property capabilities, but facing challenges from competitive pressures and investment constraints. United Kingdom holds a 22% share in 2025, expected to decline to 20.3% by 2035, supported by building efficiency requirements and net-zero initiatives but facing challenges from regulatory adjustments and investment uncertainties. Italy commands a 12.4% share in 2025, projected to reach 12.6% by 2035, while Spain accounts for 10.2% in 2025, expected to reach 10.4% by 2035. The Rest of Europe region, including Nordic countries, Eastern European markets, Belgium, Netherlands, and other European countries, is anticipated to gain momentum, expanding its collective share from 6.6% to 7.2% by 2035, attributed to increasing building modernization across Nordic countries and growing energy efficiency initiatives across various European markets implementing infrastructure upgrade programs.
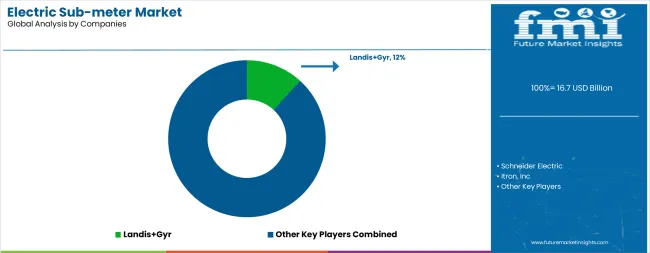
The electric sub-meter market is characterized by competition among established electrical equipment manufacturers, specialized metering technology providers, and integrated energy management service companies. Companies are investing in advanced IoT connectivity research, automation technology development, data analytics optimization, and comprehensive metering portfolios to deliver accurate, reliable, and digitally-connected electric sub-metering solutions. Innovation in wireless communication systems, automated data collection technologies, and smart building integration capabilities is central to strengthening market position and competitive advantage.
Schneider Electric leads the market with a strong presence, offering comprehensive energy management and sub-metering solutions with a focus on digital connectivity and building automation integration for commercial and industrial operations. Landis+Gyr provides specialized smart metering portfolios with an emphasis on utility-scale deployments, advanced communication technologies, and comprehensive data management services. Itron delivers innovative metering systems with focus on network connectivity and data analytics capabilities. Siemens specializes in integrated building automation solutions with emphasis on comprehensive energy monitoring and operational optimization. Honeywell International focuses on connected building systems with advanced metering integration and cybersecurity capabilities. Kamstrup provides cost-effective metering solutions with regional market leadership and specialized application capabilities.
| Items | Values |
|---|---|
| Quantitative Units (2025) | USD 16.7 billion |
| Product Type | Socket Type/Electromechanical Sub-meter (Feed-through Sub-meter, Current Transformer), Non-socket/Electronic Sub-meter, Smart Sub-meter |
| Phase Type | Single Phase, Three Phase |
| Application | Commercial Establishments (SML Retail Stores, Data Centers, Others), Industrial Sector, Residential Sector |
| Regions Covered | North America, Asia Pacific, Europe, Rest of the World |
| Countries Covered | United States, China, Germany, United Kingdom, France, and 30+ countries |
| Key Companies Profiled | Schneider Electric, Landis+Gyr, Itron, Siemens, Honeywell International, and others |
| Additional Attributes | Equipment sales by type and phase category, regional demand trends, competitive landscape, technological advancements in IoT systems, automation development, analytics innovation, and operational efficiency optimization |
The global electric sub-meter market is estimated to be valued at USD 16.7 billion in 2025.
The market size for the electric sub-meter market is projected to reach USD 31.9 billion by 2035.
The electric sub-meter market is expected to grow at a 6.7% CAGR between 2025 and 2035.
The key product types in electric sub-meter market are smart sub-meter, socket type/electromechanical sub-meter and non-socket/electronic sub-meter.
In terms of phase type, single phase segment to command 60.0% share in the electric sub-meter market in 2025.


Full Research Suite comprises of:
Market outlook & trends analysis
Interviews & case studies
Strategic recommendations
Vendor profiles & capabilities analysis
5-year forecasts
8 regions and 60+ country-level data splits
Market segment data splits
12 months of continuous data updates
DELIVERED AS:
PDF EXCEL ONLINE
Japan Electric Sub-Meter Market Analysis & Forecast by Product, Phase, Application, and Region Through 2035
Korea Electric Sub-Meter Market Analysis by Product Type, Phase, Application and Region: Forecast for 2025 to 2035
Western Europe Electric Sub-Meter Market Analysis by Product, Phase, Application and Country: Forecast for 2025 to 2035
Electric Off-Road ATVs & UTVs Market Size and Share Forecast Outlook 2025 to 2035
Electric Blind Rivet Gun Market Size and Share Forecast Outlook 2025 to 2035
Electric Fireplace Market Size and Share Forecast Outlook 2025 to 2035
Electric Glider Market Size and Share Forecast Outlook 2025 to 2035
Electric Vehicle Battery Conditioners Market Size and Share Forecast Outlook 2025 to 2035
Electric Power Steering Motors Market Size and Share Forecast Outlook 2025 to 2035
Electric Motor Market Size and Share Forecast Outlook 2025 to 2035
Electric Gripper Market Size and Share Forecast Outlook 2025 to 2035
Electric Boat Market Size and Share Forecast Outlook 2025 to 2035
Electric Bicycle Market Size and Share Forecast Outlook 2025 to 2035
Electric Vehicle Transmission Market Size and Share Forecast Outlook 2025 to 2035
Electrical Enclosure Market Size and Share Forecast Outlook 2025 to 2035
Electrical Sub Panels Market Size and Share Forecast Outlook 2025 to 2035
Electric Cargo Bike Market Size and Share Forecast Outlook 2025 to 2035
Electrical Testing Services Market Size and Share Forecast Outlook 2025 to 2035
Electric Light Commercial Vehicle Market Size and Share Forecast Outlook 2025 to 2035
Electric Vehicle Fluid Market Size and Share Forecast Outlook 2025 to 2035

Thank you!
You will receive an email from our Business Development Manager. Please be sure to check your SPAM/JUNK folder too.
Chat With
MaRIA