Reports

- Global Locations -

Headquarters

Future Market Insights, Inc.

Christiana Corporate, 200
Continental Drive, Suite 401,
Newark, Delaware - 19713,
United States

T: +1-845-579-5705

Americas

Future Market Insights, Inc.

616 Corporate Way, Suite 2-9018,
Valley Cottage, NY 10989, United States

T: +1-347-918-3531

MEA

Future Market Insights

1602-6 Jumeirah Bay X2 Tower, Plot No: JLT-PH2-X2A,
Jumeirah Lakes Towers, Dubai,
United Arab Emirates

Europe

Future Market Insights

3rd Floor, 207 Regent Street,
W1B 3HH London
United Kingdom

T: + 44 (0) 20 8123 9659
D: +44 (0) 20 3287 4268

Asia Pacific

Future Market Insights

IndiaLand Global Tech Park, Unit UG-1, Behind Grand HighStreet, Phase 1, Hinjawadi, MH, Pune – 411057, India

Electric Cargo Bike Market Snapshot (2023 to 2033)

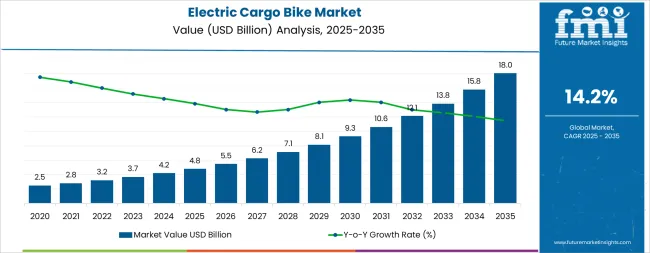
The global electric cargo bike market is expected to attain a valuation of US$ 2.1 billion in 2023 and is projected to reach US$ 6.2 billion by 2033, rising at a CAGR of 11.4% during the forecast period.

The demand for electric cargo bikes is anticipated to rise due to factors such as cost-effectiveness, eco-friendly transportation, and technological advancements in electric vehicle manufacturing. The rising popularity of e-commerce platforms, particularly in developing economies, is also contributing to the increased demand for electric cargo bikes. Additionally, consumer preferences in developed economies are shifting towards electric cargo bikes, presenting potential opportunities for growth in the future.

The demand is further expected to rise due to increasing investments in product development, aiming to create high-performance, high-load carrying capacity, and low-maintenance bikes. Technological advancements in the bike industry are also contributing to the market's expansion, serving as a notable trend driving market growth.

The growing preference among commuters for efficient and sustainable personal mobility solutions is further expected to fuel market growth. Cargo bikes are becoming increasingly popular as a convenient mode of transportation for both goods and people, promoting an active and healthy lifestyle. The rising demand for personal mobility solutions is expected to fuel the demand for electric cargo bikes, leading to industry innovations with improved features and functionalities in new models introduced by manufacturers.

Report Attribute Details
Expected Market Value (2023) US$ 2.1 billion
Anticipated Forecast Value (2033) US$ 6.2 billion
Projected Growth Rate (2023 to 2033) CAGR 11.4%

Don't pay for what you don't need

Customize your report by selecting specific countries or regions and save 30%!

2018 to 2022 Electric Cargo Bike Demand Analysis vs. Forecast 2023 to 2033

The electric cargo bike market was worth US$ 1.3 billion in 2018. It accumulated a market value of US$ 1.8 billion in 2022 while growing at a CAGR of 8.4% during the historical period. Driven by the growing requirement for transportation infrastructure in E-commerce for delivery purposes, the electric cargo bikes market rose at an 8.4% CAGR from 2018 to 2022.

Consumers with high purchasing power have fuelled the expansion of traditional and high-end electric cargo bikes on the road. A number of governments have taken steps to reduce pollution levels by placing limitations on the use of conventional motorbikes, in addition to tariffs. Regulators are also taking advantage of hybrid and electric freight bikes by providing owners with lucrative subsidies and incentives.

The use of electric cargo bikes for personal transportation and commodity deliveries has generated interest in research and development (R&D) towards performance improvements including traveling range. Several new features by emerging companies are likely to attract more e-commerce and logistic and supply chain companies, which is a driving factor for demand and sales of electric cargo bikes. Companies around the world are following this trend to keep pace with the dynamic market environment. According to the FMI analysis, the market is expected to expand at an 11.4% CAGR between 2023 and 2033.

Comparative View of Adjacent Markets

Electric Cargo Bike Market:

Attributes Electric Cargo Bike Market
CAGR (2023 to 2033) 11.4%
Market Value (2033) US$ 6.2 billion
Growth Factor The rising popularity of e-commerce platforms is expected to fuel the demand for electric cargo bikes during the forecast period.
Opportunity Technological innovations in improving the overall functionality of these bikes is expected to provide profitable opportunities for market growth.

Electric Bike Market:

Attributes Electric Bike Market
CAGR (2023 to 2033) 10%
Market Value (2033) US$ 123 billion
Growth Factor The electric bike market is expected to grow due to multiple factors, including the implementation of government regulations to promote the adoption of electric bikes and consumer preference for using e-bikes as an eco-friendly & efficient commute solution.
Opportunity The increasing adoption of e-bikes with lighter weight and greater battery life is expected to generate profitable revenue streams during the forecast period.

Cargo Bike Market:

Attributes Cargo Bike Market
CAGR (2023 to 2033) 11.7%
Market Value (2033) US$ 4.2 billion
Growth Factor Increasing demand from courier and parcel service providers and personal transportation businesses is expected to drive market growth.
Opportunity The introduction of tilting mechanism specially in three wheeled cargo bikes is expected to prove opportunistic for market expansion.
Nikhil Kaitwade
Nikhil Kaitwade

Principal Consultant

Talk to Analyst

Find your sweet spots for generating winning opportunities in this market.

What is the Commercial Potential for Electric Cargo Bikes?

With increasing investment in product development, several high-performance, low-maintenance, and high load-carrying capacity electric cargo bikes are anticipated to be introduced in the coming decade, which will benefit manufacturers.

Two wheeled cargo bikes are projected to grow rapidly, due to the ability of these cargo bikes to cover long distances with a high load carrying capacity. The number of e-commerce delivery and ride sharing rental companies is expected to expand exponentially.

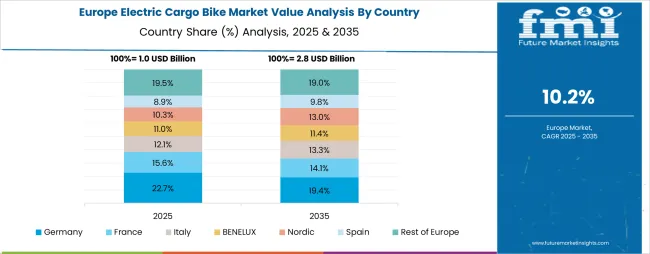
Europe is expected to display a higher consumption rate for electric cargo bikes due to strict government regulations over the use of IC engine powered two wheelers particularly in the European Union.

Which Recent Trends are Impacting Electric Cargo Bike Sales?

Major manufacturers of electric cargo bikes are involved in the production of cost-effective and lightweight vehicles to improve the overall performance parameters. Electric cargo bikes have compact bicycle frames, are light in weight and are easy to handle. When carton blocks are unloaded onto electric cargo bike, drivers can adjust the position of the bike manually. The driver can also lift the frontal portion of the electric cargo bike to facilitate easier loading of cargo.

With the technological race in the automotive sector, electric cargo bikes are also geared to gain pace in the paddle-assisted, electric mobility vehicle segment. A tilting system provides a smooth, responsive, and agile ride at the time of carrying goods, or people. The tilting mechanism is mainly seen in three-wheeled electric cargo bikes in order to improve the turn-ability and steering of these vehicles.

Get the data you need at a Fraction of the cost

Personalize your report by choosing insights you need
and save 40%!

Country-wise Insights

How big is the Opportunity for Electric Cargo Bikes in Germany?

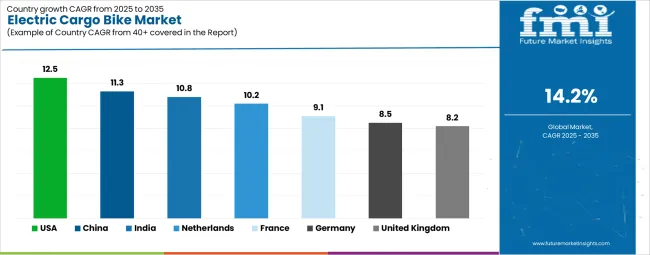
Europe is predicted to remain one of the most attractive markets for electric cargo bikes during the forecast period, according to Future Market Insights. According to the study, Germany is expected to account for over 40% of the Europe market through 2033. The market in this region is expected to grow with a CAGR of 11.6% during the forecast period.

The German Federal Government offers a subsidy of up to 25% or a maximum value of 2,500 Euros per cargo bike with a payload (cargo and rider) of at least 150kg, and 1m3 capacity.

Furthermore, Germany remains one of the world’s largest markets for e-mobility, making it a lucrative market for electric cargo bike manufacturers. Aside from this, rising concern over carbon footprints, growth of the national population and increasing traffic in Europe will drive growth in the market.

Why is the Demand for Electric Cargo Bikes Increasing in the United States?

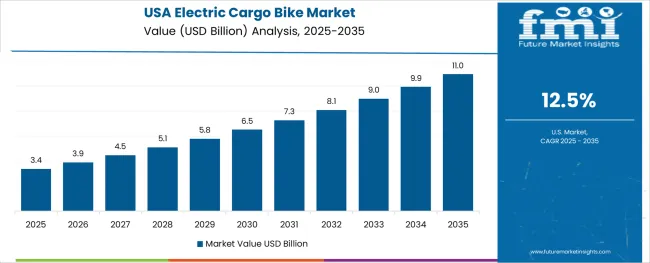
Demand in the United States is expected to rise at a 9.5% CAGR the forecast period. The country’s e-mobility industry is backed by well-developed infrastructure and it is largely supported by the government. Consequently, the USA has the most elevated level of expenditure in North America.

As per the FMI report, the United States is recognized as a primary market, and it is expected to continue exhibiting high demand for electric cargo bikes through forecast period. Moreover, rising research activities, presence of major players, and increasing investments into product pipelines are creating attractive opportunities for the electric cargo bike market in the country.

How is China Faring in the Market for Electric Cargo Bikes?

China is one of the more lucrative countries for electric cargo bike manufacturers. By 2033, it is expected to account over 52% of electric cargo bike sales within East Asia. The demand for electric cargo bikes in the region is expected to grow with a CAGR of 11.2% during the forecast period.

China has been rapidly deploying advanced digital technologies in manufacturing to optimize the potential of its manufacturing sector. Furthermore, increased investment in e-mobility sector, growing development in the battery technology to increase the range of electric vehicles are likely to have a positive impact demand for electric cargo bikes in the country.

With growing investments into infrastructure to meet the needs of the country’s vast population, changing economic regulations in terms of emission control will prove beneficial for the regional market for electric cargo bikes over the coming years.

How are Government Initiatives Aiding Electric Cargo Bike Sales in Australia & New Zealand?

In 2023, Australia & New Zealand are expected to account for over 70% of the market in the South Asia & Pacific region. The demand for electric cargo bikes in these regions is expected to grow with a CAGR of 11.5% and 11.4% respectively during the forecast period. Government initiatives undertaken to give incentives on buying electric vehicles are anticipated to supplement the development of Australia & New Zealand’s e-mobility sector.

Manufacturers in the country have a competitive advantage as they have access to cutting edge research to address previously unexplored challenges. Additionally, they are constantly investing to expand their production operations, which is resulting in a more promising product pipeline.

Category-wise Insights

Which Product Holds the Highest Growth Potential for Electric Cargo Bikes?

Based on the product type, two-wheeled electric cargo bikes are the leading category, expected to account for nearly 51% of the market by the end of 2033. The demand for two wheeled electric cargo bikes is projected to rise with a CAGR of 11.8% during the forecast period.

The driving factor behind the growth has been linked to the extensive scope of end-use and applications in large delivery volumes and personal transportation. The market is likely to see an upward trend over the coming years.

Which Battery Type is Most Commonly Used for Electric Cargo Bikes?

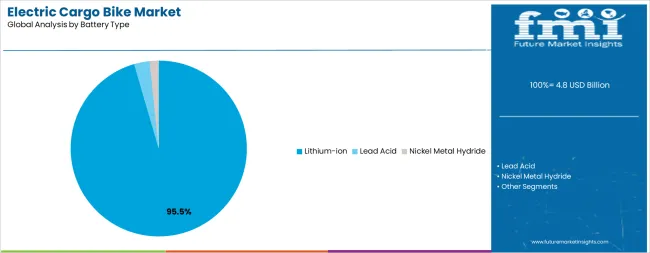
Lithium-ion batteries are used majorly owing to high charging and discharging efficiency, high charge density, and light weight compared to lead based and nickel-based batteries. Of these, lithium-ion batteries are estimated to dominate and account for over 81% of the market by 2033. The segment is expected to grow with an impressive CAGR of 12% during the forecast period.

Lithium-ion batteries provide better performance, low maintenance costs, and are also environment friendly, which is why these batteries are being incorporated in electric cargo bikes and are expected to experience high sales figures over the coming years.

Which End User Exhibits Maximum Demand for Electric Cargo Bike?

The electric cargo bike is divided into various categories based on end-use, such as courier and parcel service providers, large retail suppliers, personal transportation, service delivery, and waste, municipal services.

The courier and parcel service provider segment is notably responsible for growth in e-mobility transportation. The industry is expected to contribute a maximum revenue share of more than 46% in 2023.

This can be attributed to the rising number of e-commerce delivery and logistics purposes which is expected to drive the need of electric cargo bikes on a global scale.

Start-ups in Electric Cargo Bike Market

Start-ups are crucial in identifying growth opportunities, including the electric cargo bike market. They effectively translate inputs to outputs and adapt to market uncertainties, contributing to the industry's expansion. Some start-ups are expected to drive growth in the electric cargo bike market.

  • Cargo Bike Share is a modernized system that facilitates delivery services using cargo bikes through a user-friendly mobile application. With this app, individuals can effortlessly locate electric cargo bikes in close proximity, conveniently rent them online, and utilize them for their delivery needs.
  • Bunch Bikes manufactures electric cargo bikes designed for dog owners, families with small children, and more. They offer a variety of bike models and also provide an e-commerce platform for purchasing bikes and accessories.
  • Pure Electric is an online retailer specializing in a wide range of electric two-wheelers. Their platform allows users to purchase electric kick scooters, electric bikes, electric cargo bikes, and more.

Competitive Landscape

The market for electric cargo bike is highly competitive, with numerous prominent industry players making substantial investments in their production.

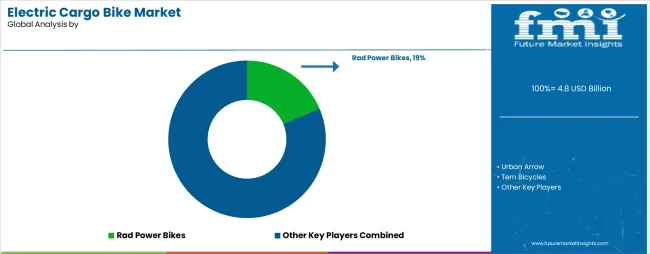
The key industry players are Jiangsu Xinri E-Vehicle Co. Ltd., Jinhua Jobo Technology Co., Ltd., CERO ELECTRIC CARGO BIKES, Worksman Cycles, DOUZE Factory SAS, XYZ CARGO, Butchers & Bicycles ApS, NIHOLA, Babboe, Yuba Electric Cargo Bikes, BODO Vehicle Group Co., Ltd. (LUXMEA), Chongqing Mobimax Technology Co., Ltd., Carqon (Accell Group N.V.), XCYC (Gemeinnützige Werkstätten und Wohnstätten GmbH ), Riese & Müller GmbH, Urban Arrow, Rad Power Bikes Inc., Tern Bicycles (Mobility Holdings, Ltd.), Pedego Electric Bikes, Xtracycle Inc, Amsterdam Bicycle Company, Triobike

Some recent developments in the electric cargo bike market are:

  • In October 2022, French company Douze Cycles introduced a series of cargo bikes comprising four models, three of which feature electric assistance. These bikes offer an impressive hauling capacity of up to 205 kg.
  • In June 2022, Tern unveiled NBD, a low-step e-bike capable of supporting a maximum gross vehicle weight of 140 kg. It features a rear rack with a capacity of up to 27 kg and a front rack that can handle up to 20 kg.
  • DOUZE Factory SAS, a French company specializing in cargo bike design and manufacturing, revealed a collaboration with Toyota on March 8, 2023. Together, they will co-develop and launch a new lineup of electric cargo bikes.
  • On November 3, 2022, Yuba Bikes from California introduced their popular non-motorized 'longtail' bicycles. These bikes have an extended deck for carrying cargo or passengers. Yuba expanded their cargo bike range with the new Fastrack model, featuring a patent-pending integrated Dual Rack System that can be adjusted in four ways to accommodate different cargo or passenger.

Report Scope

Report Attribute Details
Market Value in 2023 US$ 2.1 billion
Market Value in 2033 US$ 6.2 billion
Growth Rate CAGR of 11.4% from 2023 to 2033
Base Year for Estimation 2022
Historical Data 2018 to 2022
Forecast Period 2023 to 2033
Quantitative Units Revenue in US$ billion and CAGR from 2023 to 2033
Report Coverage Revenue Forecast, Volume Forecast, Company Ranking, Competitive Landscape, Growth Factors, Trends, and Pricing Analysis
Segments Covered
  • Product Type
  • Battery Type
  • End-Use
  • Region
Regions Covered
  • North America
  • Latin America
  • Europe
  • Asia Pacific
  • Middle East & Africa
Key Countries Profiled
  • United States
  • Canada
  • Brazil
  • Mexico
  • Germany
  • United Kingdom
  • France
  • Spain
  • Italy
  • India
  • China
  • Japan
  • Malaysia
  • Singapore
  • Thailand
  • South Korea
  • Australia
  • New Zealand
  • GCC Countries
  • South Africa
  • Israel
Key Companies Profiled
  • Jiangsu Xinri E-Vehicle Co. Ltd.
  • Jinhua Jobo Technology Co., Ltd.
  • CERO ELECTRIC CARGO BIKES
  • Worksman Cycles
  • DOUZE Factory SAS
  • XYZ CARGO
  • Butchers & Bicycles ApS
  • NIHOLA
  • Babboe
  • Yuba Electric Cargo Bikes
  • BODO Vehicle Group Co., Ltd. (LUXMEA)
  • Chongqing Mobimax Technology Co., Ltd.
  • Carqon (Accell Group N.V.)
  • XCYC (Gemeinnützige Werkstätten und Wohnstätten GmbH )
  • Riese & Müller GmbH
  • Urban Arrow
  • Rad Power Bikes Inc.
  • Tern Bicycles (Mobility Holdings, Ltd.)
  • Pedego Electric Bikes
  • Xtracycle Inc.
  • Amsterdam Bicycle Company
  • Triobike
Customization & Pricing Available Upon Request

Key Segments Profiled in the Electric Cargo Bike Industry Survey

By Product Type:

  • Two Wheeled
  • Three Wheeled
  • Four Wheeled

By Battery Type:

  • Lead-Based
  • Nickel Based
  • Lithium Ion

By End-Use:

  • Courier & Parcel Service Provider
  • Large Retail Supplier
  • Personal Transportation
  • Service Delivery
  • Waste & Municipal Services

By Region:

  • North America
  • Latin America
  • Europe
  • Asia Pacific
  • Middle East and Africa

Frequently Asked Questions

How big is the Electric Cargo Bike market?

The market is valued at US$ 2.1 billion in 2023.

Which companies dominate the Electric Cargo Bike market?

Jiangsu Xinri E-Vehicle Co. Ltd., and Jinhua Jobo Technology Co., Ltd are key market players.

How is the historical performance of the market?

The market experienced a CAGR of 8.4% between 2018 and 2022.

Which product has the potential to grow the market?

A market for two-wheeled electric cargo bikes is expected to grow the market.

How much growth is expected in the United States in 2033?

The United States is expected to record a 9.5% CAGR by 2033.

Table of Content

1. Executive Summary

    1.1. Global Market Outlook

    1.2. Demand-side Trends

    1.3. Supply-side Trends

    1.4. Technology Roadmap Analysis

    1.5. Analysis and Recommendations

2. Market Overview

    2.1. Market Coverage / Taxonomy

    2.2. Market Definition / Scope / Limitations

3. Market Background

    3.1. Market Dynamics

        3.1.1. Drivers

        3.1.2. Restraints

        3.1.3. Opportunity

        3.1.4. Trends

    3.2. Scenario Forecast

        3.2.1. Demand in Optimistic Scenario

        3.2.2. Demand in Likely Scenario

        3.2.3. Demand in Conservative Scenario

    3.3. Opportunity Map Analysis

    3.4. Product Life Cycle Analysis

    3.5. Supply Chain Analysis

        3.5.1. Supply Side Participants and their Roles

            3.5.1.1. Producers

            3.5.1.2. Mid-Level Participants (Traders/ Agents/ Brokers)

            3.5.1.3. Wholesalers and Distributors

        3.5.2. Value Added and Value Created at Node in the Supply Chain

        3.5.3. List of Raw Material Suppliers

        3.5.4. List of Existing and Potential Buyer’s

    3.6. Investment Feasibility Matrix

    3.7. Value Chain Analysis

        3.7.1. Profit Margin Analysis

        3.7.2. Wholesalers and Distributors

        3.7.3. Retailers

    3.8. PESTLE and Porter’s Analysis

    3.9. Regulatory Landscape

        3.9.1. By Key Regions

        3.9.2. By Key Countries

    3.10. Regional Parent Market Outlook

    3.11. Production and Consumption Statistics

    3.12. Import and Export Statistics

4. Global Market Analysis 2018 to 2022 and Forecast, 2023 to 2033

    4.1. Historical Market Size Value (US$ Million) & Volume (Units) Analysis, 2018 to 2022

    4.2. Current and Future Market Size Value (US$ Million) & Volume (Units) Projections, 2023 to 2033

        4.2.1. Y-o-Y Growth Trend Analysis

        4.2.2. Absolute $ Opportunity Analysis

5. Global Market Analysis 2018 to 2022 and Forecast 2023 to 2033, By Product Type

    5.1. Introduction / Key Findings

    5.2. Historical Market Size Value (US$ Million) & Volume (Units) Analysis By Product Type, 2018 to 2022

    5.3. Current and Future Market Size Value (US$ Million) & Volume (Units) Analysis and Forecast By Product Type, 2023 to 2033

        5.3.1. Two Wheeled

        5.3.2. Three Wheeled

        5.3.3. Four Wheeled

    5.4. Y-o-Y Growth Trend Analysis By Product Type, 2018 to 2022

    5.5. Absolute $ Opportunity Analysis By Product Type, 2023 to 2033

6. Global Market Analysis 2018 to 2022 and Forecast 2023 to 2033, By Battery Type

    6.1. Introduction / Key Findings

    6.2. Historical Market Size Value (US$ Million) & Volume (Units) Analysis By Battery Type, 2018 to 2022

    6.3. Current and Future Market Size Value (US$ Million) & Volume (Units) Analysis and Forecast By Battery Type, 2023 to 2033

        6.3.1. Lead Based

        6.3.2. Nickel Based

        6.3.3. Lithium Ion

    6.4. Y-o-Y Growth Trend Analysis By Battery Type, 2018 to 2022

    6.5. Absolute $ Opportunity Analysis By Battery Type, 2023 to 2033

7. Global Market Analysis 2018 to 2022 and Forecast 2023 to 2033, By End Use

    7.1. Introduction / Key Findings

    7.2. Historical Market Size Value (US$ Million) & Volume (Units) Analysis By End Use, 2018 to 2022

    7.3. Current and Future Market Size Value (US$ Million) & Volume (Units) Analysis and Forecast By End Use, 2023 to 2033

        7.3.1. Courier & Parcel Service Provider

        7.3.2. Large Retail Supplier

        7.3.3. Personal Transportation

        7.3.4. Service Delivery

        7.3.5. Waste, Municipal Services

    7.4. Y-o-Y Growth Trend Analysis By End Use, 2018 to 2022

    7.5. Absolute $ Opportunity Analysis By End Use, 2023 to 2033

8. Global Market Analysis 2018 to 2022 and Forecast 2023 to 2033, By Region

    8.1. Introduction

    8.2. Historical Market Size Value (US$ Million) & Volume (Units) Analysis By Region, 2018 to 2022

    8.3. Current Market Size Value (US$ Million) & Volume (Units) Analysis and Forecast By Region, 2023 to 2033

        8.3.1. North America

        8.3.2. Latin America

        8.3.3. Europe

        8.3.4. Asia Pacific

        8.3.5. MEA

    8.4. Market Attractiveness Analysis By Region

9. North America Market Analysis 2018 to 2022 and Forecast 2023 to 2033, By Country

    9.1. Historical Market Size Value (US$ Million) & Volume (Units) Trend Analysis By Market Taxonomy, 2018 to 2022

    9.2. Market Size Value (US$ Million) & Volume (Units) Forecast By Market Taxonomy, 2023 to 2033

        9.2.1. By Country

            9.2.1.1. USA

            9.2.1.2. Canada

        9.2.2. By Product Type

        9.2.3. By Battery Type

        9.2.4. By End Use

    9.3. Market Attractiveness Analysis

        9.3.1. By Country

        9.3.2. By Product Type

        9.3.3. By Battery Type

        9.3.4. By End Use

    9.4. Key Takeaways

10. Latin America Market Analysis 2018 to 2022 and Forecast 2023 to 2033, By Country

    10.1. Historical Market Size Value (US$ Million) & Volume (Units) Trend Analysis By Market Taxonomy, 2018 to 2022

    10.2. Market Size Value (US$ Million) & Volume (Units) Forecast By Market Taxonomy, 2023 to 2033

        10.2.1. By Country

            10.2.1.1. Brazil

            10.2.1.2. Mexico

            10.2.1.3. Rest of Latin America

        10.2.2. By Product Type

        10.2.3. By Battery Type

        10.2.4. By End Use

    10.3. Market Attractiveness Analysis

        10.3.1. By Country

        10.3.2. By Product Type

        10.3.3. By Battery Type

        10.3.4. By End Use

    10.4. Key Takeaways

11. Europe Market Analysis 2018 to 2022 and Forecast 2023 to 2033, By Country

    11.1. Historical Market Size Value (US$ Million) & Volume (Units) Trend Analysis By Market Taxonomy, 2018 to 2022

    11.2. Market Size Value (US$ Million) & Volume (Units) Forecast By Market Taxonomy, 2023 to 2033

        11.2.1. By Country

            11.2.1.1. Germany

            11.2.1.2. UK

            11.2.1.3. France

            11.2.1.4. Spain

            11.2.1.5. Italy

            11.2.1.6. Rest of Europe

        11.2.2. By Product Type

        11.2.3. By Battery Type

        11.2.4. By End Use

    11.3. Market Attractiveness Analysis

        11.3.1. By Country

        11.3.2. By Product Type

        11.3.3. By Battery Type

        11.3.4. By End Use

    11.4. Key Takeaways

12. Asia Pacific Market Analysis 2018 to 2022 and Forecast 2023 to 2033, By Country

    12.1. Historical Market Size Value (US$ Million) & Volume (Units) Trend Analysis By Market Taxonomy, 2018 to 2022

    12.2. Market Size Value (US$ Million) & Volume (Units) Forecast By Market Taxonomy, 2023 to 2033

        12.2.1. By Country

            12.2.1.1. China

            12.2.1.2. Japan

            12.2.1.3. South Korea

            12.2.1.4. Singapore

            12.2.1.5. Thailand

            12.2.1.6. Indonesia

            12.2.1.7. Australia

            12.2.1.8. New Zealand

            12.2.1.9. Rest of Asia Pacific

        12.2.2. By Product Type

        12.2.3. By Battery Type

        12.2.4. By End Use

    12.3. Market Attractiveness Analysis

        12.3.1. By Country

        12.3.2. By Product Type

        12.3.3. By Battery Type

        12.3.4. By End Use

    12.4. Key Takeaways

13. MEA Market Analysis 2018 to 2022 and Forecast 2023 to 2033, By Country

    13.1. Historical Market Size Value (US$ Million) & Volume (Units) Trend Analysis By Market Taxonomy, 2018 to 2022

    13.2. Market Size Value (US$ Million) & Volume (Units) Forecast By Market Taxonomy, 2023 to 2033

        13.2.1. By Country

            13.2.1.1. GCC Countries

            13.2.1.2. South Africa

            13.2.1.3. Israel

            13.2.1.4. Rest of MEA

        13.2.2. By Product Type

        13.2.3. By Battery Type

        13.2.4. By End Use

    13.3. Market Attractiveness Analysis

        13.3.1. By Country

        13.3.2. By Product Type

        13.3.3. By Battery Type

        13.3.4. By End Use

    13.4. Key Takeaways

14. Key Countries Market Analysis

    14.1. USA

        14.1.1. Pricing Analysis

        14.1.2. Market Share Analysis, 2022

            14.1.2.1. By Product Type

            14.1.2.2. By Battery Type

            14.1.2.3. By End Use

    14.2. Canada

        14.2.1. Pricing Analysis

        14.2.2. Market Share Analysis, 2022

            14.2.2.1. By Product Type

            14.2.2.2. By Battery Type

            14.2.2.3. By End Use

    14.3. Brazil

        14.3.1. Pricing Analysis

        14.3.2. Market Share Analysis, 2022

            14.3.2.1. By Product Type

            14.3.2.2. By Battery Type

            14.3.2.3. By End Use

    14.4. Mexico

        14.4.1. Pricing Analysis

        14.4.2. Market Share Analysis, 2022

            14.4.2.1. By Product Type

            14.4.2.2. By Battery Type

            14.4.2.3. By End Use

    14.5. Germany

        14.5.1. Pricing Analysis

        14.5.2. Market Share Analysis, 2022

            14.5.2.1. By Product Type

            14.5.2.2. By Battery Type

            14.5.2.3. By End Use

    14.6. UK

        14.6.1. Pricing Analysis

        14.6.2. Market Share Analysis, 2022

            14.6.2.1. By Product Type

            14.6.2.2. By Battery Type

            14.6.2.3. By End Use

    14.7. France

        14.7.1. Pricing Analysis

        14.7.2. Market Share Analysis, 2022

            14.7.2.1. By Product Type

            14.7.2.2. By Battery Type

            14.7.2.3. By End Use

    14.8. Spain

        14.8.1. Pricing Analysis

        14.8.2. Market Share Analysis, 2022

            14.8.2.1. By Product Type

            14.8.2.2. By Battery Type

            14.8.2.3. By End Use

    14.9. Italy

        14.9.1. Pricing Analysis

        14.9.2. Market Share Analysis, 2022

            14.9.2.1. By Product Type

            14.9.2.2. By Battery Type

            14.9.2.3. By End Use

    14.10. China

        14.10.1. Pricing Analysis

        14.10.2. Market Share Analysis, 2022

            14.10.2.1. By Product Type

            14.10.2.2. By Battery Type

            14.10.2.3. By End Use

    14.11. Japan

        14.11.1. Pricing Analysis

        14.11.2. Market Share Analysis, 2022

            14.11.2.1. By Product Type

            14.11.2.2. By Battery Type

            14.11.2.3. By End Use

    14.12. South Korea

        14.12.1. Pricing Analysis

        14.12.2. Market Share Analysis, 2022

            14.12.2.1. By Product Type

            14.12.2.2. By Battery Type

            14.12.2.3. By End Use

    14.13. Singapore

        14.13.1. Pricing Analysis

        14.13.2. Market Share Analysis, 2022

            14.13.2.1. By Product Type

            14.13.2.2. By Battery Type

            14.13.2.3. By End Use

    14.14. Thailand

        14.14.1. Pricing Analysis

        14.14.2. Market Share Analysis, 2022

            14.14.2.1. By Product Type

            14.14.2.2. By Battery Type

            14.14.2.3. By End Use

    14.15. Indonesia

        14.15.1. Pricing Analysis

        14.15.2. Market Share Analysis, 2022

            14.15.2.1. By Product Type

            14.15.2.2. By Battery Type

            14.15.2.3. By End Use

    14.16. Australia

        14.16.1. Pricing Analysis

        14.16.2. Market Share Analysis, 2022

            14.16.2.1. By Product Type

            14.16.2.2. By Battery Type

            14.16.2.3. By End Use

    14.17. New Zealand

        14.17.1. Pricing Analysis

        14.17.2. Market Share Analysis, 2022

            14.17.2.1. By Product Type

            14.17.2.2. By Battery Type

            14.17.2.3. By End Use

    14.18. GCC Countries

        14.18.1. Pricing Analysis

        14.18.2. Market Share Analysis, 2022

            14.18.2.1. By Product Type

            14.18.2.2. By Battery Type

            14.18.2.3. By End Use

    14.19. South Africa

        14.19.1. Pricing Analysis

        14.19.2. Market Share Analysis, 2022

            14.19.2.1. By Product Type

            14.19.2.2. By Battery Type

            14.19.2.3. By End Use

    14.20. Israel

        14.20.1. Pricing Analysis

        14.20.2. Market Share Analysis, 2022

            14.20.2.1. By Product Type

            14.20.2.2. By Battery Type

            14.20.2.3. By End Use

15. Market Structure Analysis

    15.1. Competition Dashboard

    15.2. Competition Benchmarking

    15.3. Market Share Analysis of Top Players

        15.3.1. By Regional

        15.3.2. By Product Type

        15.3.3. By Battery Type

        15.3.4. By End Use

16. Competition Analysis

    16.1. Competition Deep Dive

        16.1.1. Jiangsu Xinri E-Vehicle Co. Ltd.

            16.1.1.1. Overview

            16.1.1.2. Product Portfolio

            16.1.1.3. Profitability by Market Segments

            16.1.1.4. Sales Footprint

            16.1.1.5. Strategy Overview

                16.1.1.5.1. Marketing Strategy

                16.1.1.5.2. Product Strategy

                16.1.1.5.3. Channel Strategy

        16.1.2. Jinhua Jobo Technology Co., Ltd.

            16.1.2.1. Overview

            16.1.2.2. Product Portfolio

            16.1.2.3. Profitability by Market Segments

            16.1.2.4. Sales Footprint

            16.1.2.5. Strategy Overview

                16.1.2.5.1. Marketing Strategy

                16.1.2.5.2. Product Strategy

                16.1.2.5.3. Channel Strategy

        16.1.3. CERO ELECTRIC CARGO BIKES

            16.1.3.1. Overview

            16.1.3.2. Product Portfolio

            16.1.3.3. Profitability by Market Segments

            16.1.3.4. Sales Footprint

            16.1.3.5. Strategy Overview

                16.1.3.5.1. Marketing Strategy

                16.1.3.5.2. Product Strategy

                16.1.3.5.3. Channel Strategy

        16.1.4. Worksman Cycles

            16.1.4.1. Overview

            16.1.4.2. Product Portfolio

            16.1.4.3. Profitability by Market Segments

            16.1.4.4. Sales Footprint

            16.1.4.5. Strategy Overview

                16.1.4.5.1. Marketing Strategy

                16.1.4.5.2. Product Strategy

                16.1.4.5.3. Channel Strategy

        16.1.5. DOUZE Factory SAS

            16.1.5.1. Overview

            16.1.5.2. Product Portfolio

            16.1.5.3. Profitability by Market Segments

            16.1.5.4. Sales Footprint

            16.1.5.5. Strategy Overview

                16.1.5.5.1. Marketing Strategy

                16.1.5.5.2. Product Strategy

                16.1.5.5.3. Channel Strategy

        16.1.6. XYZ CARGO

            16.1.6.1. Overview

            16.1.6.2. Product Portfolio

            16.1.6.3. Profitability by Market Segments

            16.1.6.4. Sales Footprint

            16.1.6.5. Strategy Overview

                16.1.6.5.1. Marketing Strategy

                16.1.6.5.2. Product Strategy

                16.1.6.5.3. Channel Strategy

        16.1.7. Butchers & Bicycles ApS

            16.1.7.1. Overview

            16.1.7.2. Product Portfolio

            16.1.7.3. Profitability by Market Segments

            16.1.7.4. Sales Footprint

            16.1.7.5. Strategy Overview

                16.1.7.5.1. Marketing Strategy

                16.1.7.5.2. Product Strategy

                16.1.7.5.3. Channel Strategy

        16.1.8. NIHOLA

            16.1.8.1. Overview

            16.1.8.2. Product Portfolio

            16.1.8.3. Profitability by Market Segments

            16.1.8.4. Sales Footprint

            16.1.8.5. Strategy Overview

                16.1.8.5.1. Marketing Strategy

                16.1.8.5.2. Product Strategy

                16.1.8.5.3. Channel Strategy

        16.1.9. Babboe

            16.1.9.1. Overview

            16.1.9.2. Product Portfolio

            16.1.9.3. Profitability by Market Segments

            16.1.9.4. Sales Footprint

            16.1.9.5. Strategy Overview

                16.1.9.5.1. Marketing Strategy

                16.1.9.5.2. Product Strategy

                16.1.9.5.3. Channel Strategy

        16.1.10. Yuba Electric Cargo Bikes

            16.1.10.1. Overview

            16.1.10.2. Product Portfolio

            16.1.10.3. Profitability by Market Segments

            16.1.10.4. Sales Footprint

            16.1.10.5. Strategy Overview

                16.1.10.5.1. Marketing Strategy

                16.1.10.5.2. Product Strategy

                16.1.10.5.3. Channel Strategy

        16.1.11. BODO Vehicle Group Co., Ltd. (LUXMEA)

            16.1.11.1. Overview

            16.1.11.2. Product Portfolio

            16.1.11.3. Profitability by Market Segments

            16.1.11.4. Sales Footprint

            16.1.11.5. Strategy Overview

                16.1.11.5.1. Marketing Strategy

                16.1.11.5.2. Product Strategy

                16.1.11.5.3. Channel Strategy

        16.1.12. Chongqing Mobimax Technology Co., Ltd.

            16.1.12.1. Overview

            16.1.12.2. Product Portfolio

            16.1.12.3. Profitability by Market Segments

            16.1.12.4. Sales Footprint

            16.1.12.5. Strategy Overview

                16.1.12.5.1. Marketing Strategy

                16.1.12.5.2. Product Strategy

                16.1.12.5.3. Channel Strategy

        16.1.13. Carqon (Accell Group N.V.)

            16.1.13.1. Overview

            16.1.13.2. Product Portfolio

            16.1.13.3. Profitability by Market Segments

            16.1.13.4. Sales Footprint

            16.1.13.5. Strategy Overview

                16.1.13.5.1. Marketing Strategy

                16.1.13.5.2. Product Strategy

                16.1.13.5.3. Channel Strategy

        16.1.14. XCYC (Gemeinnützige Werkstätten und Wohnstätten GmbH )

            16.1.14.1. Overview

            16.1.14.2. Product Portfolio

            16.1.14.3. Profitability by Market Segments

            16.1.14.4. Sales Footprint

            16.1.14.5. Strategy Overview

                16.1.14.5.1. Marketing Strategy

                16.1.14.5.2. Product Strategy

                16.1.14.5.3. Channel Strategy

        16.1.15. Riese & Müller GmbH

            16.1.15.1. Overview

            16.1.15.2. Product Portfolio

            16.1.15.3. Profitability by Market Segments

            16.1.15.4. Sales Footprint

            16.1.15.5. Strategy Overview

                16.1.15.5.1. Marketing Strategy

                16.1.15.5.2. Product Strategy

                16.1.15.5.3. Channel Strategy

        16.1.16. Urban Arrow

            16.1.16.1. Overview

            16.1.16.2. Product Portfolio

            16.1.16.3. Profitability by Market Segments

            16.1.16.4. Sales Footprint

            16.1.16.5. Strategy Overview

                16.1.16.5.1. Marketing Strategy

                16.1.16.5.2. Product Strategy

                16.1.16.5.3. Channel Strategy

        16.1.17. Rad Power Bikes Inc.

            16.1.17.1. Overview

            16.1.17.2. Product Portfolio

            16.1.17.3. Profitability by Market Segments

            16.1.17.4. Sales Footprint

            16.1.17.5. Strategy Overview

                16.1.17.5.1. Marketing Strategy

                16.1.17.5.2. Product Strategy

                16.1.17.5.3. Channel Strategy

        16.1.18. Tern Bicycles (Mobility Holdings, Ltd.)

            16.1.18.1. Overview

            16.1.18.2. Product Portfolio

            16.1.18.3. Profitability by Market Segments

            16.1.18.4. Sales Footprint

            16.1.18.5. Strategy Overview

                16.1.18.5.1. Marketing Strategy

                16.1.18.5.2. Product Strategy

                16.1.18.5.3. Channel Strategy

        16.1.19. Pedego Electric Bikes

            16.1.19.1. Overview

            16.1.19.2. Product Portfolio

            16.1.19.3. Profitability by Market Segments

            16.1.19.4. Sales Footprint

            16.1.19.5. Strategy Overview

                16.1.19.5.1. Marketing Strategy

                16.1.19.5.2. Product Strategy

                16.1.19.5.3. Channel Strategy

        16.1.20. Xtracycle Inc.

            16.1.20.1. Overview

            16.1.20.2. Product Portfolio

            16.1.20.3. Profitability by Market Segments

            16.1.20.4. Sales Footprint

            16.1.20.5. Strategy Overview

                16.1.20.5.1. Marketing Strategy

                16.1.20.5.2. Product Strategy

                16.1.20.5.3. Channel Strategy

17. Assumptions & Acronyms Used

18. Research Methodology

List of Tables

Table 1: Global Market Value (US$ Million) Forecast by Region, 2018 to 2033

Table 2: Global Market Volume (Units) Forecast by Region, 2018 to 2033

Table 3: Global Market Value (US$ Million) Forecast by Product Type, 2018 to 2033

Table 4: Global Market Volume (Units) Forecast by Product Type, 2018 to 2033

Table 5: Global Market Value (US$ Million) Forecast by Battery Type, 2018 to 2033

Table 6: Global Market Volume (Units) Forecast by Battery Type, 2018 to 2033

Table 7: Global Market Value (US$ Million) Forecast by End Use, 2018 to 2033

Table 8: Global Market Volume (Units) Forecast by End Use, 2018 to 2033

Table 9: North America Market Value (US$ Million) Forecast by Country, 2018 to 2033

Table 10: North America Market Volume (Units) Forecast by Country, 2018 to 2033

Table 11: North America Market Value (US$ Million) Forecast by Product Type, 2018 to 2033

Table 12: North America Market Volume (Units) Forecast by Product Type, 2018 to 2033

Table 13: North America Market Value (US$ Million) Forecast by Battery Type, 2018 to 2033

Table 14: North America Market Volume (Units) Forecast by Battery Type, 2018 to 2033

Table 15: North America Market Value (US$ Million) Forecast by End Use, 2018 to 2033

Table 16: North America Market Volume (Units) Forecast by End Use, 2018 to 2033

Table 17: Latin America Market Value (US$ Million) Forecast by Country, 2018 to 2033

Table 18: Latin America Market Volume (Units) Forecast by Country, 2018 to 2033

Table 19: Latin America Market Value (US$ Million) Forecast by Product Type, 2018 to 2033

Table 20: Latin America Market Volume (Units) Forecast by Product Type, 2018 to 2033

Table 21: Latin America Market Value (US$ Million) Forecast by Battery Type, 2018 to 2033

Table 22: Latin America Market Volume (Units) Forecast by Battery Type, 2018 to 2033

Table 23: Latin America Market Value (US$ Million) Forecast by End Use, 2018 to 2033

Table 24: Latin America Market Volume (Units) Forecast by End Use, 2018 to 2033

Table 25: Europe Market Value (US$ Million) Forecast by Country, 2018 to 2033

Table 26: Europe Market Volume (Units) Forecast by Country, 2018 to 2033

Table 27: Europe Market Value (US$ Million) Forecast by Product Type, 2018 to 2033

Table 28: Europe Market Volume (Units) Forecast by Product Type, 2018 to 2033

Table 29: Europe Market Value (US$ Million) Forecast by Battery Type, 2018 to 2033

Table 30: Europe Market Volume (Units) Forecast by Battery Type, 2018 to 2033

Table 31: Europe Market Value (US$ Million) Forecast by End Use, 2018 to 2033

Table 32: Europe Market Volume (Units) Forecast by End Use, 2018 to 2033

Table 33: Asia Pacific Market Value (US$ Million) Forecast by Country, 2018 to 2033

Table 34: Asia Pacific Market Volume (Units) Forecast by Country, 2018 to 2033

Table 35: Asia Pacific Market Value (US$ Million) Forecast by Product Type, 2018 to 2033

Table 36: Asia Pacific Market Volume (Units) Forecast by Product Type, 2018 to 2033

Table 37: Asia Pacific Market Value (US$ Million) Forecast by Battery Type, 2018 to 2033

Table 38: Asia Pacific Market Volume (Units) Forecast by Battery Type, 2018 to 2033

Table 39: Asia Pacific Market Value (US$ Million) Forecast by End Use, 2018 to 2033

Table 40: Asia Pacific Market Volume (Units) Forecast by End Use, 2018 to 2033

Table 41: MEA Market Value (US$ Million) Forecast by Country, 2018 to 2033

Table 42: MEA Market Volume (Units) Forecast by Country, 2018 to 2033

Table 43: MEA Market Value (US$ Million) Forecast by Product Type, 2018 to 2033

Table 44: MEA Market Volume (Units) Forecast by Product Type, 2018 to 2033

Table 45: MEA Market Value (US$ Million) Forecast by Battery Type, 2018 to 2033

Table 46: MEA Market Volume (Units) Forecast by Battery Type, 2018 to 2033

Table 47: MEA Market Value (US$ Million) Forecast by End Use, 2018 to 2033

Table 48: MEA Market Volume (Units) Forecast by End Use, 2018 to 2033

List of Charts

Figure 1: Global Market Value (US$ Million) by Product Type, 2023 to 2033

Figure 2: Global Market Value (US$ Million) by Battery Type, 2023 to 2033

Figure 3: Global Market Value (US$ Million) by End Use, 2023 to 2033

Figure 4: Global Market Value (US$ Million) by Region, 2023 to 2033

Figure 5: Global Market Value (US$ Million) Analysis by Region, 2018 to 2033

Figure 6: Global Market Volume (Units) Analysis by Region, 2018 to 2033

Figure 7: Global Market Value Share (%) and BPS Analysis by Region, 2023 to 2033

Figure 8: Global Market Y-o-Y Growth (%) Projections by Region, 2023 to 2033

Figure 9: Global Market Value (US$ Million) Analysis by Product Type, 2018 to 2033

Figure 10: Global Market Volume (Units) Analysis by Product Type, 2018 to 2033

Figure 11: Global Market Value Share (%) and BPS Analysis by Product Type, 2023 to 2033

Figure 12: Global Market Y-o-Y Growth (%) Projections by Product Type, 2023 to 2033

Figure 13: Global Market Value (US$ Million) Analysis by Battery Type, 2018 to 2033

Figure 14: Global Market Volume (Units) Analysis by Battery Type, 2018 to 2033

Figure 15: Global Market Value Share (%) and BPS Analysis by Battery Type, 2023 to 2033

Figure 16: Global Market Y-o-Y Growth (%) Projections by Battery Type, 2023 to 2033

Figure 17: Global Market Value (US$ Million) Analysis by End Use, 2018 to 2033

Figure 18: Global Market Volume (Units) Analysis by End Use, 2018 to 2033

Figure 19: Global Market Value Share (%) and BPS Analysis by End Use, 2023 to 2033

Figure 20: Global Market Y-o-Y Growth (%) Projections by End Use, 2023 to 2033

Figure 21: Global Market Attractiveness by Product Type, 2023 to 2033

Figure 22: Global Market Attractiveness by Battery Type, 2023 to 2033

Figure 23: Global Market Attractiveness by End Use, 2023 to 2033

Figure 24: Global Market Attractiveness by Region, 2023 to 2033

Figure 25: North America Market Value (US$ Million) by Product Type, 2023 to 2033

Figure 26: North America Market Value (US$ Million) by Battery Type, 2023 to 2033

Figure 27: North America Market Value (US$ Million) by End Use, 2023 to 2033

Figure 28: North America Market Value (US$ Million) by Country, 2023 to 2033

Figure 29: North America Market Value (US$ Million) Analysis by Country, 2018 to 2033

Figure 30: North America Market Volume (Units) Analysis by Country, 2018 to 2033

Figure 31: North America Market Value Share (%) and BPS Analysis by Country, 2023 to 2033

Figure 32: North America Market Y-o-Y Growth (%) Projections by Country, 2023 to 2033

Figure 33: North America Market Value (US$ Million) Analysis by Product Type, 2018 to 2033

Figure 34: North America Market Volume (Units) Analysis by Product Type, 2018 to 2033

Figure 35: North America Market Value Share (%) and BPS Analysis by Product Type, 2023 to 2033

Figure 36: North America Market Y-o-Y Growth (%) Projections by Product Type, 2023 to 2033

Figure 37: North America Market Value (US$ Million) Analysis by Battery Type, 2018 to 2033

Figure 38: North America Market Volume (Units) Analysis by Battery Type, 2018 to 2033

Figure 39: North America Market Value Share (%) and BPS Analysis by Battery Type, 2023 to 2033

Figure 40: North America Market Y-o-Y Growth (%) Projections by Battery Type, 2023 to 2033

Figure 41: North America Market Value (US$ Million) Analysis by End Use, 2018 to 2033

Figure 42: North America Market Volume (Units) Analysis by End Use, 2018 to 2033

Figure 43: North America Market Value Share (%) and BPS Analysis by End Use, 2023 to 2033

Figure 44: North America Market Y-o-Y Growth (%) Projections by End Use, 2023 to 2033

Figure 45: North America Market Attractiveness by Product Type, 2023 to 2033

Figure 46: North America Market Attractiveness by Battery Type, 2023 to 2033

Figure 47: North America Market Attractiveness by End Use, 2023 to 2033

Figure 48: North America Market Attractiveness by Country, 2023 to 2033

Figure 49: Latin America Market Value (US$ Million) by Product Type, 2023 to 2033

Figure 50: Latin America Market Value (US$ Million) by Battery Type, 2023 to 2033

Figure 51: Latin America Market Value (US$ Million) by End Use, 2023 to 2033

Figure 52: Latin America Market Value (US$ Million) by Country, 2023 to 2033

Figure 53: Latin America Market Value (US$ Million) Analysis by Country, 2018 to 2033

Figure 54: Latin America Market Volume (Units) Analysis by Country, 2018 to 2033

Figure 55: Latin America Market Value Share (%) and BPS Analysis by Country, 2023 to 2033

Figure 56: Latin America Market Y-o-Y Growth (%) Projections by Country, 2023 to 2033

Figure 57: Latin America Market Value (US$ Million) Analysis by Product Type, 2018 to 2033

Figure 58: Latin America Market Volume (Units) Analysis by Product Type, 2018 to 2033

Figure 59: Latin America Market Value Share (%) and BPS Analysis by Product Type, 2023 to 2033

Figure 60: Latin America Market Y-o-Y Growth (%) Projections by Product Type, 2023 to 2033

Figure 61: Latin America Market Value (US$ Million) Analysis by Battery Type, 2018 to 2033

Figure 62: Latin America Market Volume (Units) Analysis by Battery Type, 2018 to 2033

Figure 63: Latin America Market Value Share (%) and BPS Analysis by Battery Type, 2023 to 2033

Figure 64: Latin America Market Y-o-Y Growth (%) Projections by Battery Type, 2023 to 2033

Figure 65: Latin America Market Value (US$ Million) Analysis by End Use, 2018 to 2033

Figure 66: Latin America Market Volume (Units) Analysis by End Use, 2018 to 2033

Figure 67: Latin America Market Value Share (%) and BPS Analysis by End Use, 2023 to 2033

Figure 68: Latin America Market Y-o-Y Growth (%) Projections by End Use, 2023 to 2033

Figure 69: Latin America Market Attractiveness by Product Type, 2023 to 2033

Figure 70: Latin America Market Attractiveness by Battery Type, 2023 to 2033

Figure 71: Latin America Market Attractiveness by End Use, 2023 to 2033

Figure 72: Latin America Market Attractiveness by Country, 2023 to 2033

Figure 73: Europe Market Value (US$ Million) by Product Type, 2023 to 2033

Figure 74: Europe Market Value (US$ Million) by Battery Type, 2023 to 2033

Figure 75: Europe Market Value (US$ Million) by End Use, 2023 to 2033

Figure 76: Europe Market Value (US$ Million) by Country, 2023 to 2033

Figure 77: Europe Market Value (US$ Million) Analysis by Country, 2018 to 2033

Figure 78: Europe Market Volume (Units) Analysis by Country, 2018 to 2033

Figure 79: Europe Market Value Share (%) and BPS Analysis by Country, 2023 to 2033

Figure 80: Europe Market Y-o-Y Growth (%) Projections by Country, 2023 to 2033

Figure 81: Europe Market Value (US$ Million) Analysis by Product Type, 2018 to 2033

Figure 82: Europe Market Volume (Units) Analysis by Product Type, 2018 to 2033

Figure 83: Europe Market Value Share (%) and BPS Analysis by Product Type, 2023 to 2033

Figure 84: Europe Market Y-o-Y Growth (%) Projections by Product Type, 2023 to 2033

Figure 85: Europe Market Value (US$ Million) Analysis by Battery Type, 2018 to 2033

Figure 86: Europe Market Volume (Units) Analysis by Battery Type, 2018 to 2033

Figure 87: Europe Market Value Share (%) and BPS Analysis by Battery Type, 2023 to 2033

Figure 88: Europe Market Y-o-Y Growth (%) Projections by Battery Type, 2023 to 2033

Figure 89: Europe Market Value (US$ Million) Analysis by End Use, 2018 to 2033

Figure 90: Europe Market Volume (Units) Analysis by End Use, 2018 to 2033

Figure 91: Europe Market Value Share (%) and BPS Analysis by End Use, 2023 to 2033

Figure 92: Europe Market Y-o-Y Growth (%) Projections by End Use, 2023 to 2033

Figure 93: Europe Market Attractiveness by Product Type, 2023 to 2033

Figure 94: Europe Market Attractiveness by Battery Type, 2023 to 2033

Figure 95: Europe Market Attractiveness by End Use, 2023 to 2033

Figure 96: Europe Market Attractiveness by Country, 2023 to 2033

Figure 97: Asia Pacific Market Value (US$ Million) by Product Type, 2023 to 2033

Figure 98: Asia Pacific Market Value (US$ Million) by Battery Type, 2023 to 2033

Figure 99: Asia Pacific Market Value (US$ Million) by End Use, 2023 to 2033

Figure 100: Asia Pacific Market Value (US$ Million) by Country, 2023 to 2033

Figure 101: Asia Pacific Market Value (US$ Million) Analysis by Country, 2018 to 2033

Figure 102: Asia Pacific Market Volume (Units) Analysis by Country, 2018 to 2033

Figure 103: Asia Pacific Market Value Share (%) and BPS Analysis by Country, 2023 to 2033

Figure 104: Asia Pacific Market Y-o-Y Growth (%) Projections by Country, 2023 to 2033

Figure 105: Asia Pacific Market Value (US$ Million) Analysis by Product Type, 2018 to 2033

Figure 106: Asia Pacific Market Volume (Units) Analysis by Product Type, 2018 to 2033

Figure 107: Asia Pacific Market Value Share (%) and BPS Analysis by Product Type, 2023 to 2033

Figure 108: Asia Pacific Market Y-o-Y Growth (%) Projections by Product Type, 2023 to 2033

Figure 109: Asia Pacific Market Value (US$ Million) Analysis by Battery Type, 2018 to 2033

Figure 110: Asia Pacific Market Volume (Units) Analysis by Battery Type, 2018 to 2033

Figure 111: Asia Pacific Market Value Share (%) and BPS Analysis by Battery Type, 2023 to 2033

Figure 112: Asia Pacific Market Y-o-Y Growth (%) Projections by Battery Type, 2023 to 2033

Figure 113: Asia Pacific Market Value (US$ Million) Analysis by End Use, 2018 to 2033

Figure 114: Asia Pacific Market Volume (Units) Analysis by End Use, 2018 to 2033

Figure 115: Asia Pacific Market Value Share (%) and BPS Analysis by End Use, 2023 to 2033

Figure 116: Asia Pacific Market Y-o-Y Growth (%) Projections by End Use, 2023 to 2033

Figure 117: Asia Pacific Market Attractiveness by Product Type, 2023 to 2033

Figure 118: Asia Pacific Market Attractiveness by Battery Type, 2023 to 2033

Figure 119: Asia Pacific Market Attractiveness by End Use, 2023 to 2033

Figure 120: Asia Pacific Market Attractiveness by Country, 2023 to 2033

Figure 121: MEA Market Value (US$ Million) by Product Type, 2023 to 2033

Figure 122: MEA Market Value (US$ Million) by Battery Type, 2023 to 2033

Figure 123: MEA Market Value (US$ Million) by End Use, 2023 to 2033

Figure 124: MEA Market Value (US$ Million) by Country, 2023 to 2033

Figure 125: MEA Market Value (US$ Million) Analysis by Country, 2018 to 2033

Figure 126: MEA Market Volume (Units) Analysis by Country, 2018 to 2033

Figure 127: MEA Market Value Share (%) and BPS Analysis by Country, 2023 to 2033

Figure 128: MEA Market Y-o-Y Growth (%) Projections by Country, 2023 to 2033

Figure 129: MEA Market Value (US$ Million) Analysis by Product Type, 2018 to 2033

Figure 130: MEA Market Volume (Units) Analysis by Product Type, 2018 to 2033

Figure 131: MEA Market Value Share (%) and BPS Analysis by Product Type, 2023 to 2033

Figure 132: MEA Market Y-o-Y Growth (%) Projections by Product Type, 2023 to 2033

Figure 133: MEA Market Value (US$ Million) Analysis by Battery Type, 2018 to 2033

Figure 134: MEA Market Volume (Units) Analysis by Battery Type, 2018 to 2033

Figure 135: MEA Market Value Share (%) and BPS Analysis by Battery Type, 2023 to 2033

Figure 136: MEA Market Y-o-Y Growth (%) Projections by Battery Type, 2023 to 2033

Figure 137: MEA Market Value (US$ Million) Analysis by End Use, 2018 to 2033

Figure 138: MEA Market Volume (Units) Analysis by End Use, 2018 to 2033

Figure 139: MEA Market Value Share (%) and BPS Analysis by End Use, 2023 to 2033

Figure 140: MEA Market Y-o-Y Growth (%) Projections by End Use, 2023 to 2033

Figure 141: MEA Market Attractiveness by Product Type, 2023 to 2033

Figure 142: MEA Market Attractiveness by Battery Type, 2023 to 2033

Figure 143: MEA Market Attractiveness by End Use, 2023 to 2033

Figure 144: MEA Market Attractiveness by Country, 2023 to 2033

Recommendations

Automotive

Electric Bike Market

Published : July 2023

Automotive

Cargo Bike Market

Published : June 2023

Explore Automotive Insights

View Reports

Electric Cargo Bike Market