Reports

- Global Locations -

Headquarters

Future Market Insights, Inc.

Christiana Corporate, 200
Continental Drive, Suite 401,
Newark, Delaware - 19713,
United States

T: +1-845-579-5705

Americas

Future Market Insights, Inc.

616 Corporate Way, Suite 2-9018,
Valley Cottage, NY 10989, United States

T: +1-347-918-3531

MEA

Future Market Insights

1602-6 Jumeirah Bay X2 Tower, Plot No: JLT-PH2-X2A,
Jumeirah Lakes Towers, Dubai,
United Arab Emirates

Europe

Future Market Insights

3rd Floor, 207 Regent Street,
W1B 3HH London
United Kingdom

T: + 44 (0) 20 8123 9659
D: +44 (0) 20 3287 4268

Asia Pacific

Future Market Insights

IndiaLand Global Tech Park, Unit UG-1, Behind Grand HighStreet, Phase 1, Hinjawadi, MH, Pune – 411057, India

Analytical Study of I2C Bus in Western Europe from 2024 to 2034

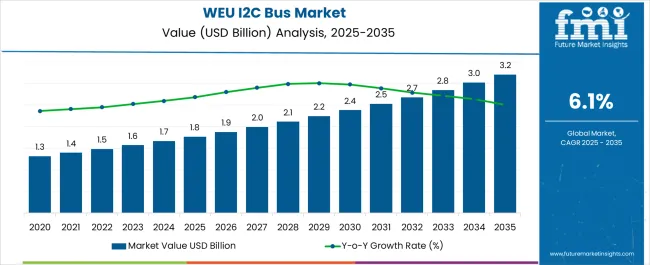
The demand for I2C bus in Western European countries is estimated to generate a revenue of around US$ 1,662.6 million in 2024. I2C bus sales in Western Europe are projected to inflate at a compound annual growth rate (CAGR) of 6.4% from 2024 to 2034. By the end of this projection period, the revenue-generating capacity of I2C bus manufacturing industries based in Western Europe is expected to reach US$ 3,078.9 million.

Attributes Details
Industry Size of Western Europe in 2024 US$ 1,662.6 million
Expected Industry Size of Western Europe by 2034 US$ 3,078.9 million
Forecasted CAGR between 2024 to 2034 6.4%

Don't pay for what you don't need

Customize your report by selecting specific countries or regions and save 30%!

Key Trends behind the Surge in Revenues of I2C Bus Industry

  • Between 2019 and 2023, the sales of I2C bus developed at a 4.1% CAGR and generated US$ 1,582.9 million in revenue in 2023.
  • The presence of a robust electronics sector in the top-performing Western European countries has played a significant role.
  • Advancements in medical devices, automotive technology, electric vehicles, IoT, and smart wearables have all contributed to the increased demand for I2C bus.

Key Insights - Highlights on the Emerging Opportunities in the I2C Bus Industry

Growing Need for IoT Devices: The I2C bus technology is in high demand as a result of recent advancements and the widespread adoption of IoT devices by residents and industries in Western European countries.

Rising Export of Automotive: The introduction of smart sensors in both passenger and commercial vehicles has increased the use of integrated circuit (I2C) buses in the automotive industry. In line with this development, the expanding electric vehicle manufacturing sector has also emerged as a key reason for the growing demand for I2C bus in Western Europe.

Role of European Regulators: Regulators in Western European countries frequently encourage and mandate the adoption of standardized communication protocols. This, in turn, has also prompted the adoption and implementation of inter-integrated circuit or I2C bus in Western Europe by electronics manufacturers.

Sudip Saha
Sudip Saha

Principal Consultant

Talk to Analyst

Find your sweet spots for generating winning opportunities in this market.

Comparative View of Adjacent I2C Bus in Key Markets

The table showcases a comparative overview of how I2C bus industries are expected to perform in Japan, Korea, and Western Europe. Several challenges and opportunities, specific to these countries, are expected to shape the growth trajectory for electronics components, including the I2C bus.

Demand for I2C Bus in Western Europe:

Attributes Demand for I2C Bus in Western Europe
CAGR (2024 to 2034) 6.4%
Valuation (2024) US$ 1,662.6 million
Key Trend Widespread use of I2C technology in medical devices, which include diagnostic tools and patient monitoring systems.
Key Challenge Manydevices and systems that are still used in some Western European countries belong to older versionsof the I2C bus standard.

Popularity of I2C Bus in Japan:

Attributes Popularity of I2C Bus in Japan
CAGR (2024 to 2034) 9.6%
Valuation (2024) US$ 653.6 million
Key Trend The proliferation of IoT devices has increased the demand for effective communication protocols involvingI2C bus.
Key Challenge Interoperability of I2C bus manufactured in Japan with devices manufactured and imported from other countries.

Adoption Scenario of I2C Bus in Korea:

Attributes Adoption Scenario of I2C Bus in Korea
CAGR (2024 to 2034) 7.1%
Valuation (2024) US$ 228.8 million
Key Trend Mounting focus on industrial automation technologies along with the emergence of world-class electronics manufacturing industries.
Key Challenge The electronics industry in Korea is experiencing shortage of semiconductor chips and other components.

Category-wise insights

Bidirectional I2C is the Preferred Technology in Industries of Western Europe

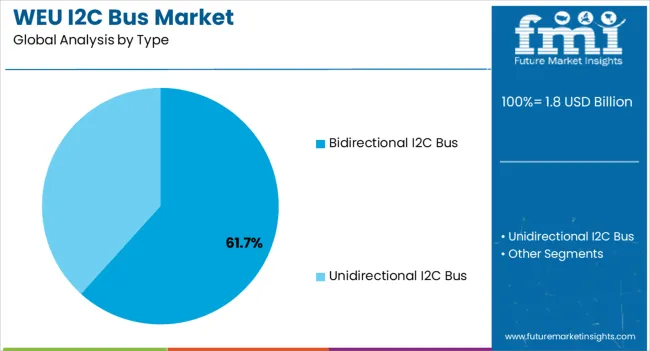
The bidirectional I2C bus segment dominates over the unidirectional I2C bus segment and is expected to capture 66.7% of the overall demand in 2024.

Leading Type for I2C Bus in Western Europe Bidirectional I2C Bus
Total Value Share (2024) 66.7%

Bidirectional I2C technology is well-known for its low energy consumption, which attracts businesses seeking to produce goods with minimal electricity use. This is also in line with Europe's focus on energy conservation goals which is expected to retain the dominance of the bidirectional I2C segment over the coming years.

I2C Bus with Fast Mode Data Transfer Technology Dominates in the Region

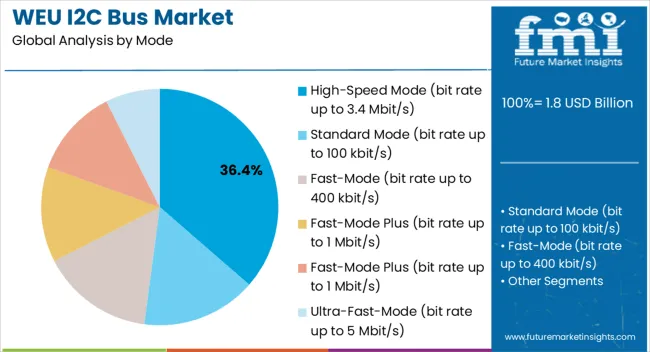
According to our survey, the demand for I2C bus with fast-mode technology is higher in Western European countries. In 2024, this segment is anticipated to garner about 29.4% of the total sales of I2C bus in the region.

Leading Data Transfer Mode Type for I2C Bus in Western Europe Fast Mode (up to 400 kbit/s)
Total Value Share (2024) 29.4%

Many businesses in Western Europe are making significant investments in research and development. This has fuelled the development of fast-mode I2C bus technology. Competitiveness, cost-cutting, and product enhancement are all driven by the use of the internal integrated circuit bus with a communication speed of 400 kbit/sec, making it the leading segment in the region.

Get the data you need at a Fraction of the cost

Personalize your report by choosing insights you need
and save 40%!

Country-wise Insights

Key Countries in Western Europe Value CAGR (2024 to 2034)
Germany 7.6%
United Kingdom 8.7%
France 5.1%

Industrial Automation has Increased the Use of I2C Bus in Germany

Germany, with a huge electronics manufacturing industry base, is the leading producer of I2C bus in Europe. Over the next ten years, this production volume is expected to increase by 7.6% per year.

Germany is now emphasizing industrial automation heavily and it could accelerate the adoption of communication devices in many industries located in the country. Given the critical role that I2C technology plays in enabling communication between components in automated systems the domestic demand for I2C bus is anticipated to soar higher.

Advancement in Medical Devices has surged the Demand in the United Kingdom

The demand for I2C bus in the United Kingdom is anticipated to witness a higher growth rate of 8.7% per year from 2024 to 2034.

The United Kingdom is renowned for having a highly developed healthcare system with hospitals and medicals equipped with advanced digital monitoring systems. With further expansion of the healthcare infrastructure and medical tourism in the country, there is a corresponding rise in the use of and demand for I2C Bus components.

The proliferation of Electronics Companies in France is Driving I2C Bus Supply

France has emerged as an important manufacturing hub of different electronics components for global players in the last few years. As per our analysis, the I2C bus production in the country is projected to witness a 5.7% CAGR through 2034.

France is hopeful to transform its national economy on the back of its rapidly developing electronics sector, encompassing semiconductor and device producers. So the regional industries are expected to experience some newfound opportunities in the country as the I2C bus is highly demanded by such industrial ecosystems.

Competitive Landscape

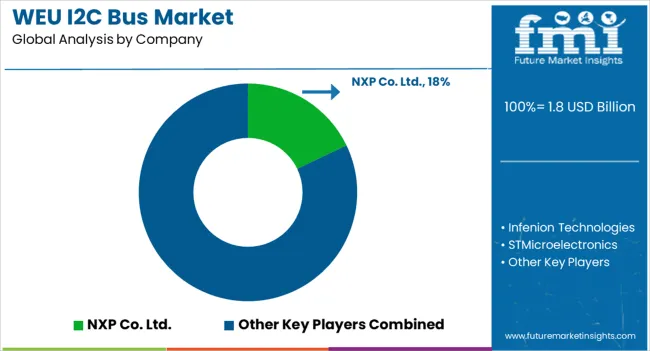
Owing to the presence of very few renowned I2C bus manufacturing companies, the competition among Western European players is relatively low. However, the emergence of many small players in recent years that design and manufacture I2C bus products has increased the competition to some degree.

European electronics and semiconductor circuit manufacturers frequently work with universities, research centers, and other tech firms. This encourages the sharing of information, creativity, and the creation of cutting-edge I2C solutions and is expected to encourage start-ups to enter the sector.

Recent Developments Observed in I2C Bus in Western Europe
  • In August 2023, Würth Elektronik released a new application note titled "ANP121 - Filter and Surge Protection for I2C-Bus," providing helpful guidance for its clients. This Application Note aims to offer an appropriate filter and protection circuit to enhance the circuit bus's immunity to noise while maintaining the signal quality of both data and clock lines. However, expanding the interface through cables or connections may expose the circuit bus to external interference, including bursts, radiated radio frequency, and electrostatic current discharge.
  • In August 2021, NXP Company released its new product 'SC18IS606,' designed to act as an interface between an SPI bus and a microcontroller's conventional I2C bus. The microcontroller's I2C-bus has been designed to establish direct communication with SPI devices, functioning as both an SPI controller and an I2C-bus target-transmitter or target-receiver. The SC18IS606 features three SPI chip select outputs that may be set as GPIO and has its own internal oscillator to manage bus-specific timing, protocol, and sequencing.

Some of the Key Players in I2C Bus in Western Europe

  • NXP Co. Ltd.
  • Infenion Technologies
  • STMicroelectronics
  • Dialog Semiconductors
  • Imagination Technologies
  • Robert Bosch GmbH
  • Siemens Inc.
  • Continental AG
  • Valeo Co. Ltd.

Scope of the Report

Attribute Details
Estimated Industry Size in 2024 US$ 1,662.6 million
Projected Industry Size by 2034 US$ 3,078.9 million
Anticipated CAGR between 2024 to 2034 6.4% CAGR
Historical Analysis of Demand for I2C Bus in Western Europe 2019 to 2023
Demand Forecast for I2C Bus in Western Europe 2024 to 2034
Report Coverage Industry Size, Industry Trends, Analysis of key factors influencing the Adoption of I2C Bus in Western Europe, Insights on Global Players and their Industry Strategy in Western Europe, Ecosystem Analysis of Local and Regional Western Europe Manufacturers
Key Countries Analyzed while Studying Opportunities in I2C Bus in Western Europe
  • Germany
  • Italy
  • France
  • Spain
  • United Kingdom
  • BENELUX
  • Rest of Western Europe
Key Companies Profiled
  • NXP Co. Ltd.
  • Infenion Technologies
  • STMicroelectronics
  • Dialog Semiconductors
  • Imagination Technologies
  • Robert Bosch GmbH
  • Siemens Inc.
  • Continental AG
  • Valeo Co. Ltd.

Key Segments Covered in the Industry Survey of I2C Bus in Western Europe

By Mode:

  • Standard mode (bit rate up to 100 kbit/s)
  • Fast-mode (bit rate up to 400 kbit/s)
  • Fast-mode Plus (bit rate up to 1 Mbit/s)
  • Fast-mode Plus (bit rate up to 1 Mbit/s)
  • High-speed mode (bit rate up to 3.4 Mbit/s)
  • Ultra-Fast-mode (bit rate up to 5 Mbit/s)

By Type:

  • Bidirectional I2C Bus
  • Unidirectional I2C Bus

By Application:

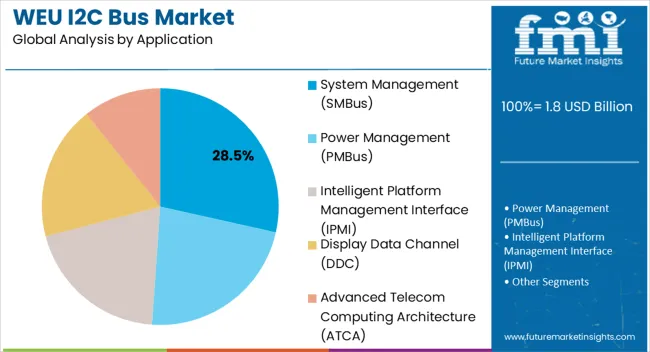
  • System Management (SMBus)
  • Power Management (PMBus)
  • Intelligent Platform Management Interface (IPMI)
  • Display Data Channel (DDC)
  • Advanced Telecom Computing Architecture (ATCA)

By Country:

  • Germany
  • Italy
  • France
  • Spain
  • United Kingdom
  • BENELUX
  • Rest of Western Europe

Frequently Asked Questions

How Rapidly is the Western Europe I2C Bus Industry likely to Grow?

The expected CAGR for the industry in Western Europe through 2034 is 6.4%.

What is the Demand Outlook for I2C Bus in Western Europe?

The demand for I2C bus in Western Europe is anticipated to reach US$ 3,078.9 million by 2034. 

Which Trends have Influenced the I2C Bus Business in Western Europe?

The rising popularity of IoT devices has increased the regional sales.

Which Mode Type of I2C Bus are Used More in Western Europe?

I2C bus products with fast mode are used more in Western European countries.

Which Segment is Driving I2C Bus Industry in Western Europe?

The bidirectional I2C segment currently accounts for 66.7% of overall industry.

Table of Content

1. Executive Summary

    1.1. Market Outlook

    1.2. Demand-side Trends

    1.3. Supply-side Trends

    1.4. Technology Roadmap Analysis

    1.5. Analysis and Recommendations

2. Market Overview

    2.1. Market Coverage / Taxonomy

    2.2. Market Definition / Scope / Limitations

3. Market Background

    3.1. Market Dynamics

        3.1.1. Drivers

        3.1.2. Restraints

        3.1.3. Opportunity

        3.1.4. Trends

    3.2. Scenario Forecast

        3.2.1. Demand in Optimistic Scenario

        3.2.2. Demand in Likely Scenario

        3.2.3. Demand in Conservative Scenario

    3.3. Opportunity Map Analysis

    3.4. Product Life Cycle Analysis

    3.5. Supply Chain Analysis

        3.5.1. Supply Side Participants and their Roles

            3.5.1.1. Producers

            3.5.1.2. Mid-Level Participants (Traders/ Agents/ Brokers)

            3.5.1.3. Wholesalers and Distributors

        3.5.2. Value Added and Value Created at Node in the Supply Chain

        3.5.3. List of Raw Material Suppliers

        3.5.4. List of Existing and Potential Buyer’s

    3.6. Investment Feasibility Matrix

    3.7. Value Chain Analysis

        3.7.1. Profit Margin Analysis

        3.7.2. Wholesalers and Distributors

        3.7.3. Retailers

    3.8. PESTLE and Porter’s Analysis

    3.9. Regulatory Landscape

        3.9.1. By Key Regions

    3.10. Regional Parent Market Outlook

    3.11. Production and Consumption Statistics

    3.12. Import and Export Statistics

4. Industry Analysis and Outlook 2018 to 2022 and Forecast, 2023 to 2033

    4.1. Historical Market Size Value (US$ Million) & Volume (Unit) Analysis, 2018 to 2022

    4.2. Current and Future Market Size Value (US$ Million) & Volume (Unit) Projections, 2023 to 2033

        4.2.1. Y-o-Y Growth Trend Analysis

        4.2.2. Absolute $ Opportunity Analysis

5. Industry Analysis and Outlook 2018 to 2022 and Forecast 2023 to 2033, By Type

    5.1. Introduction / Key Findings

    5.2. Historical Market Size Value (US$ Million) & Volume (Unit) Analysis By Type, 2018 to 2022

    5.3. Current and Future Market Size Value (US$ Million) & Volume (Unit) Analysis and Forecast By Type, 2023 to 2033

        5.3.1. Unidirectional

        5.3.2. Bidirectional

    5.4. Y-o-Y Growth Trend Analysis By Type, 2018 to 2022

    5.5. Absolute $ Opportunity Analysis By Type, 2023 to 2033

6. Industry Analysis and Outlook 2018 to 2022 and Forecast 2023 to 2033, By Data Transfer Modes

    6.1. Introduction / Key Findings

    6.2. Historical Market Size Value (US$ Million) & Volume (Unit) Analysis By Data Transfer Modes, 2018 to 2022

    6.3. Current and Future Market Size Value (US$ Million) & Volume (Unit) Analysis and Forecast By Data Transfer Modes, 2023 to 2033

        6.3.1. Standard-mode (up to 100 kbit/s)

        6.3.2. Fast-mode (up to 400 kbit/s)

        6.3.3. Fast-mode Plus (up to 1 Mbit/s)

        6.3.4. High-speed mode (up to 3.4 Mbit/s)

        6.3.5. Ultra-fast mode (up to 5 Mbit/s)

    6.4. Y-o-Y Growth Trend Analysis By Data Transfer Modes, 2018 to 2022

    6.5. Absolute $ Opportunity Analysis By Data Transfer Modes, 2023 to 2033

7. Industry Analysis and Outlook 2018 to 2022 and Forecast 2023 to 2033, By Application

    7.1. Introduction / Key Findings

    7.2. Historical Market Size Value (US$ Million) & Volume (Unit) Analysis By Application, 2018 to 2022

    7.3. Current and Future Market Size Value (US$ Million) & Volume (Unit) Analysis and Forecast By Application, 2023 to 2033

        7.3.1. System Management Bus (SMBus)

            7.3.1.1. Standard-mode (up to 100 kbit/s)

            7.3.1.2. Fast-mode (up to 400 kbit/s)

            7.3.1.3. Fast-mode Plus (up to 1 Mbit/s)

            7.3.1.4. High-speed mode (up to 3.4 Mbit/s)

            7.3.1.5. Ultra-fast mode (up to 5 Mbit/s)

        7.3.2. Power Management Bus (PMBus)

            7.3.2.1. Standard-mode (up to 100 kbit/s)

            7.3.2.2. Fast-mode (up to 400 kbit/s)

            7.3.2.3. Fast-mode Plus (up to 1 Mbit/s)

            7.3.2.4. High-speed mode (up to 3.4 Mbit/s)

            7.3.2.5. Ultra-fast mode (up to 5 Mbit/s)

        7.3.3. Intelligent Platform Management Interface (IPMI)

            7.3.3.1. Standard-mode (up to 100 kbit/s)

            7.3.3.2. Fast-mode (up to 400 kbit/s)

            7.3.3.3. Fast-mode Plus (up to 1 Mbit/s)

            7.3.3.4. High-speed mode (up to 3.4 Mbit/s)

            7.3.3.5. Ultra-fast mode (up to 5 Mbit/s)

        7.3.4. Display Data Channel (DDC)

            7.3.4.1. Standard-mode (up to 100 kbit/s)

            7.3.4.2. Fast-mode (up to 400 kbit/s)

            7.3.4.3. Fast-mode Plus (up to 1 Mbit/s)

            7.3.4.4. High-speed mode (up to 3.4 Mbit/s)

            7.3.4.5. Ultra-fast mode (up to 5 Mbit/s)

        7.3.5. Advanced Telecom Computing Architecture (ATCA)

            7.3.5.1. Standard-mode (up to 100 kbit/s)

            7.3.5.2. Fast-mode (up to 400 kbit/s)

            7.3.5.3. Fast-mode Plus (up to 1 Mbit/s)

            7.3.5.4. High-speed mode (up to 3.4 Mbit/s)

            7.3.5.5. Ultra-fast mode (up to 5 Mbit/s)

        7.3.6. Others

            7.3.6.1. Standard-mode (up to 100 kbit/s)

            7.3.6.2. Fast-mode (up to 400 kbit/s)

            7.3.6.3. Fast-mode Plus (up to 1 Mbit/s)

            7.3.6.4. High-speed mode (up to 3.4 Mbit/s)

            7.3.6.5. Ultra-fast mode (up to 5 Mbit/s)

    7.4. Y-o-Y Growth Trend Analysis By Application, 2018 to 2022

    7.5. Absolute $ Opportunity Analysis By Application, 2023 to 2033

8. Industry Analysis and Outlook 2018 to 2022 and Forecast 2023 to 2033, By Country

    8.1. Introduction

    8.2. Historical Market Size Value (US$ Million) & Volume (Unit) Analysis By Country, 2018 to 2022

    8.3. Current Market Size Value (US$ Million) & Volume (Unit) Analysis and Forecast By Country, 2023 to 2033

        8.3.1. UK

        8.3.2. Germany

        8.3.3. Italy

        8.3.4. France

        8.3.5. Spain

        8.3.6. Rest of Western Europe

    8.4. Market Attractiveness Analysis By Country

9. UK Industry Analysis and Outlook 2018 to 2022 and Forecast 2023 to 2033, By Region

    9.1. Historical Market Size Value (US$ Million) & Volume (Unit) Trend Analysis By Market Taxonomy, 2018 to 2022

    9.2. Market Size Value (US$ Million) & Volume (Unit) Forecast By Market Taxonomy, 2023 to 2033

        9.2.1. By Region

            9.2.1.1. England

            9.2.1.2. Scotland

            9.2.1.3. Wales

            9.2.1.4. Northern Ireland

        9.2.2. By Type

        9.2.3. By Data Transfer Modes

        9.2.4. By Application

    9.3. Market Attractiveness Analysis

        9.3.1. By Region

        9.3.2. By Type

        9.3.3. By Data Transfer Modes

        9.3.4. By Application

    9.4. Key Takeaways

10. Germany Industry Analysis and Outlook 2018 to 2022 and Forecast 2023 to 2033, By Region

    10.1. Historical Market Size Value (US$ Million) & Volume (Unit) Trend Analysis By Market Taxonomy, 2018 to 2022

    10.2. Market Size Value (US$ Million) & Volume (Unit) Forecast By Market Taxonomy, 2023 to 2033

        10.2.1. By Region

            10.2.1.1. North-east (Germany)

            10.2.1.2. North-west (Germany)

            10.2.1.3. Central (Germany)

            10.2.1.4. South (Germany)

            10.2.1.5. Other(Germany)

        10.2.2. By Type

        10.2.3. By Data Transfer Modes

        10.2.4. By Application

    10.3. Market Attractiveness Analysis

        10.3.1. By Region

        10.3.2. By Type

        10.3.3. By Data Transfer Modes

        10.3.4. By Application

    10.4. Key Takeaways

11. Italy Industry Analysis and Outlook 2018 to 2022 and Forecast 2023 to 2033, By Region

    11.1. Historical Market Size Value (US$ Million) & Volume (Unit) Trend Analysis By Market Taxonomy, 2018 to 2022

    11.2. Market Size Value (US$ Million) & Volume (Unit) Forecast By Market Taxonomy, 2023 to 2033

        11.2.1. By Region

            11.2.1.1. North (Italy)

            11.2.1.2. Central (Italy)

            11.2.1.3. South (Italy)

            11.2.1.4. Islands (Italy)

        11.2.2. By Type

        11.2.3. By Data Transfer Modes

        11.2.4. By Application

    11.3. Market Attractiveness Analysis

        11.3.1. By Region

        11.3.2. By Type

        11.3.3. By Data Transfer Modes

        11.3.4. By Application

    11.4. Key Takeaways

12. France Industry Analysis and Outlook 2018 to 2022 and Forecast 2023 to 2033, By Region

    12.1. Historical Market Size Value (US$ Million) & Volume (Unit) Trend Analysis By Market Taxonomy, 2018 to 2022

    12.2. Market Size Value (US$ Million) & Volume (Unit) Forecast By Market Taxonomy, 2023 to 2033

        12.2.1. By Region

            12.2.1.1. Northern (France)

            12.2.1.2. Central (France)

            12.2.1.3. Southern (France)

            12.2.1.4. Eastern (France)

        12.2.2. By Type

        12.2.3. By Data Transfer Modes

        12.2.4. By Application

    12.3. Market Attractiveness Analysis

        12.3.1. By Region

        12.3.2. By Type

        12.3.3. By Data Transfer Modes

        12.3.4. By Application

    12.4. Key Takeaways

13. Spain Industry Analysis and Outlook 2018 to 2022 and Forecast 2023 to 2033, By Region

    13.1. Historical Market Size Value (US$ Million) & Volume (Unit) Trend Analysis By Market Taxonomy, 2018 to 2022

    13.2. Market Size Value (US$ Million) & Volume (Unit) Forecast By Market Taxonomy, 2023 to 2033

        13.2.1. By Region

            13.2.1.1. Basque Country

            13.2.1.2. Andalusia

            13.2.1.3. Extremadura

            13.2.1.4. Catalonia

            13.2.1.5. Valencia

            13.2.1.6. Rest of Spain

        13.2.2. By Type

        13.2.3. By Data Transfer Modes

        13.2.4. By Application

    13.3. Market Attractiveness Analysis

        13.3.1. By Region

        13.3.2. By Type

        13.3.3. By Data Transfer Modes

        13.3.4. By Application

    13.4. Key Takeaways

14. Rest of Industry Analysis and Outlook 2018 to 2022 and Forecast 2023 to 2033

    14.1. Historical Market Size Value (US$ Million) & Volume (Unit) Trend Analysis By Market Taxonomy, 2018 to 2022

    14.2. Market Size Value (US$ Million) & Volume (Unit) Forecast By Market Taxonomy, 2023 to 2033

        14.2.1. By Type

        14.2.2. By Data Transfer Modes

        14.2.3. By Application

    14.3. Market Attractiveness Analysis

        14.3.1. By Type

        14.3.2. By Data Transfer Modes

        14.3.3. By Application

    14.4. Key Takeaways

15. Market Structure Analysis

    15.1. Competition Dashboard

    15.2. Competition Benchmarking

    15.3. Market Share Analysis of Top Players

        15.3.1. By Regional

        15.3.2. By Type

        15.3.3. By Data Transfer Modes

        15.3.4. By Application

16. Competition Analysis

    16.1. Competition Deep Dive

        16.1.1. NXP Semiconductors

            16.1.1.1. Overview

            16.1.1.2. Product Portfolio

            16.1.1.3. Profitability by Market Segments

            16.1.1.4. Sales Footprint

            16.1.1.5. Strategy Overview

                16.1.1.5.1. Marketing Strategy

                16.1.1.5.2. Product Strategy

                16.1.1.5.3. Channel Strategy

        16.1.2. Texas Instruments Incorporated

            16.1.2.1. Overview

            16.1.2.2. Product Portfolio

            16.1.2.3. Profitability by Market Segments

            16.1.2.4. Sales Footprint

            16.1.2.5. Strategy Overview

                16.1.2.5.1. Marketing Strategy

                16.1.2.5.2. Product Strategy

                16.1.2.5.3. Channel Strategy

        16.1.3. Intel Corporation

            16.1.3.1. Overview

            16.1.3.2. Product Portfolio

            16.1.3.3. Profitability by Market Segments

            16.1.3.4. Sales Footprint

            16.1.3.5. Strategy Overview

                16.1.3.5.1. Marketing Strategy

                16.1.3.5.2. Product Strategy

                16.1.3.5.3. Channel Strategy

        16.1.4. STMicroelectronics

            16.1.4.1. Overview

            16.1.4.2. Product Portfolio

            16.1.4.3. Profitability by Market Segments

            16.1.4.4. Sales Footprint

            16.1.4.5. Strategy Overview

                16.1.4.5.1. Marketing Strategy

                16.1.4.5.2. Product Strategy

                16.1.4.5.3. Channel Strategy

        16.1.5. Renesas Electronics Corporation

            16.1.5.1. Overview

            16.1.5.2. Product Portfolio

            16.1.5.3. Profitability by Market Segments

            16.1.5.4. Sales Footprint

            16.1.5.5. Strategy Overview

                16.1.5.5.1. Marketing Strategy

                16.1.5.5.2. Product Strategy

                16.1.5.5.3. Channel Strategy

        16.1.6. NEC Corporation

            16.1.6.1. Overview

            16.1.6.2. Product Portfolio

            16.1.6.3. Profitability by Market Segments

            16.1.6.4. Sales Footprint

            16.1.6.5. Strategy Overview

                16.1.6.5.1. Marketing Strategy

                16.1.6.5.2. Product Strategy

                16.1.6.5.3. Channel Strategy

        16.1.7. Nordic Semiconductor

            16.1.7.1. Overview

            16.1.7.2. Product Portfolio

            16.1.7.3. Profitability by Market Segments

            16.1.7.4. Sales Footprint

            16.1.7.5. Strategy Overview

                16.1.7.5.1. Marketing Strategy

                16.1.7.5.2. Product Strategy

                16.1.7.5.3. Channel Strategy

        16.1.8. Soliton Technologies

            16.1.8.1. Overview

            16.1.8.2. Product Portfolio

            16.1.8.3. Profitability by Market Segments

            16.1.8.4. Sales Footprint

            16.1.8.5. Strategy Overview

                16.1.8.5.1. Marketing Strategy

                16.1.8.5.2. Product Strategy

                16.1.8.5.3. Channel Strategy

        16.1.9. Analog Devices

            16.1.9.1. Overview

            16.1.9.2. Product Portfolio

            16.1.9.3. Profitability by Market Segments

            16.1.9.4. Sales Footprint

            16.1.9.5. Strategy Overview

                16.1.9.5.1. Marketing Strategy

                16.1.9.5.2. Product Strategy

                16.1.9.5.3. Channel Strategy

        16.1.10. TDK Corporation

            16.1.10.1. Overview

            16.1.10.2. Product Portfolio

            16.1.10.3. Profitability by Market Segments

            16.1.10.4. Sales Footprint

            16.1.10.5. Strategy Overview

                16.1.10.5.1. Marketing Strategy

                16.1.10.5.2. Product Strategy

                16.1.10.5.3. Channel Strategy

        16.1.11. Maxim Integrated Products Inc.

            16.1.11.1. Overview

            16.1.11.2. Product Portfolio

            16.1.11.3. Profitability by Market Segments

            16.1.11.4. Sales Footprint

            16.1.11.5. Strategy Overview

                16.1.11.5.1. Marketing Strategy

                16.1.11.5.2. Product Strategy

                16.1.11.5.3. Channel Strategy

        16.1.12. Panasonic Corporation

            16.1.12.1. Overview

            16.1.12.2. Product Portfolio

            16.1.12.3. Profitability by Market Segments

            16.1.12.4. Sales Footprint

            16.1.12.5. Strategy Overview

                16.1.12.5.1. Marketing Strategy

                16.1.12.5.2. Product Strategy

                16.1.12.5.3. Channel Strategy

        16.1.13. Silicon Laboratories

            16.1.13.1. Overview

            16.1.13.2. Product Portfolio

            16.1.13.3. Profitability by Market Segments

            16.1.13.4. Sales Footprint

            16.1.13.5. Strategy Overview

                16.1.13.5.1. Marketing Strategy

                16.1.13.5.2. Product Strategy

                16.1.13.5.3. Channel Strategy

        16.1.14. Infineon Technologies AG

            16.1.14.1. Overview

            16.1.14.2. Product Portfolio

            16.1.14.3. Profitability by Market Segments

            16.1.14.4. Sales Footprint

            16.1.14.5. Strategy Overview

                16.1.14.5.1. Marketing Strategy

                16.1.14.5.2. Product Strategy

                16.1.14.5.3. Channel Strategy

17. Assumptions & Acronyms Used

18. Research Methodology

List of Tables

Table 1: Industry Analysis and Outlook Value (US$ Million) Forecast by Country, 2018 to 2033

Table 2: Industry Analysis and Outlook Volume (Unit) Forecast by Country, 2018 to 2033

Table 3: Industry Analysis and Outlook Value (US$ Million) Forecast by Type, 2018 to 2033

Table 4: Industry Analysis and Outlook Volume (Unit) Forecast by Type, 2018 to 2033

Table 5: Industry Analysis and Outlook Value (US$ Million) Forecast by Data Transfer Modes, 2018 to 2033

Table 6: Industry Analysis and Outlook Volume (Unit) Forecast by Data Transfer Modes, 2018 to 2033

Table 7: Industry Analysis and Outlook Value (US$ Million) Forecast by Application, 2018 to 2033

Table 8: Industry Analysis and Outlook Volume (Unit) Forecast by Application, 2018 to 2033

Table 9: UK Industry Analysis and Outlook Value (US$ Million) Forecast By Region, 2018 to 2033

Table 10: UK Industry Analysis and Outlook Volume (Unit) Forecast By Region, 2018 to 2033

Table 11: UK Industry Analysis and Outlook Value (US$ Million) Forecast by Type, 2018 to 2033

Table 12: UK Industry Analysis and Outlook Volume (Unit) Forecast by Type, 2018 to 2033

Table 13: UK Industry Analysis and Outlook Value (US$ Million) Forecast by Data Transfer Modes, 2018 to 2033

Table 14: UK Industry Analysis and Outlook Volume (Unit) Forecast by Data Transfer Modes, 2018 to 2033

Table 15: UK Industry Analysis and Outlook Value (US$ Million) Forecast by Application, 2018 to 2033

Table 16: UK Industry Analysis and Outlook Volume (Unit) Forecast by Application, 2018 to 2033

Table 17: Germany Industry Analysis and Outlook Value (US$ Million) Forecast By Region, 2018 to 2033

Table 18: Germany Industry Analysis and Outlook Volume (Unit) Forecast By Region, 2018 to 2033

Table 19: Germany Industry Analysis and Outlook Value (US$ Million) Forecast by Type, 2018 to 2033

Table 20: Germany Industry Analysis and Outlook Volume (Unit) Forecast by Type, 2018 to 2033

Table 21: Germany Industry Analysis and Outlook Value (US$ Million) Forecast by Data Transfer Modes, 2018 to 2033

Table 22: Germany Industry Analysis and Outlook Volume (Unit) Forecast by Data Transfer Modes, 2018 to 2033

Table 23: Germany Industry Analysis and Outlook Value (US$ Million) Forecast by Application, 2018 to 2033

Table 24: Germany Industry Analysis and Outlook Volume (Unit) Forecast by Application, 2018 to 2033

Table 25: Italy Industry Analysis and Outlook Value (US$ Million) Forecast By Region, 2018 to 2033

Table 26: Italy Industry Analysis and Outlook Volume (Unit) Forecast By Region, 2018 to 2033

Table 27: Italy Industry Analysis and Outlook Value (US$ Million) Forecast by Type, 2018 to 2033

Table 28: Italy Industry Analysis and Outlook Volume (Unit) Forecast by Type, 2018 to 2033

Table 29: Italy Industry Analysis and Outlook Value (US$ Million) Forecast by Data Transfer Modes, 2018 to 2033

Table 30: Italy Industry Analysis and Outlook Volume (Unit) Forecast by Data Transfer Modes, 2018 to 2033

Table 31: Italy Industry Analysis and Outlook Value (US$ Million) Forecast by Application, 2018 to 2033

Table 32: Italy Industry Analysis and Outlook Volume (Unit) Forecast by Application, 2018 to 2033

Table 33: France Industry Analysis and Outlook Value (US$ Million) Forecast By Region, 2018 to 2033

Table 34: France Industry Analysis and Outlook Volume (Unit) Forecast By Region, 2018 to 2033

Table 35: France Industry Analysis and Outlook Value (US$ Million) Forecast by Type, 2018 to 2033

Table 36: France Industry Analysis and Outlook Volume (Unit) Forecast by Type, 2018 to 2033

Table 37: France Industry Analysis and Outlook Value (US$ Million) Forecast by Data Transfer Modes, 2018 to 2033

Table 38: France Industry Analysis and Outlook Volume (Unit) Forecast by Data Transfer Modes, 2018 to 2033

Table 39: France Industry Analysis and Outlook Value (US$ Million) Forecast by Application, 2018 to 2033

Table 40: France Industry Analysis and Outlook Volume (Unit) Forecast by Application, 2018 to 2033

Table 41: Spain Industry Analysis and Outlook Value (US$ Million) Forecast By Region, 2018 to 2033

Table 42: Spain Industry Analysis and Outlook Volume (Unit) Forecast By Region, 2018 to 2033

Table 43: Spain Industry Analysis and Outlook Value (US$ Million) Forecast by Type, 2018 to 2033

Table 44: Spain Industry Analysis and Outlook Volume (Unit) Forecast by Type, 2018 to 2033

Table 45: Spain Industry Analysis and Outlook Value (US$ Million) Forecast by Data Transfer Modes, 2018 to 2033

Table 46: Spain Industry Analysis and Outlook Volume (Unit) Forecast by Data Transfer Modes, 2018 to 2033

Table 47: Spain Industry Analysis and Outlook Value (US$ Million) Forecast by Application, 2018 to 2033

Table 48: Spain Industry Analysis and Outlook Volume (Unit) Forecast by Application, 2018 to 2033

Table 49: Rest of Industry Analysis and Outlook Value (US$ Million) Forecast by Type, 2018 to 2033

Table 50: Rest of Industry Analysis and Outlook Volume (Unit) Forecast by Type, 2018 to 2033

Table 51: Rest of Industry Analysis and Outlook Value (US$ Million) Forecast by Data Transfer Modes, 2018 to 2033

Table 52: Rest of Industry Analysis and Outlook Volume (Unit) Forecast by Data Transfer Modes, 2018 to 2033

Table 53: Rest of Industry Analysis and Outlook Value (US$ Million) Forecast by Application, 2018 to 2033

Table 54: Rest of Industry Analysis and Outlook Volume (Unit) Forecast by Application, 2018 to 2033

List of Charts

Figure 1: Industry Analysis and Outlook Value (US$ Million) by Type, 2023 to 2033

Figure 2: Industry Analysis and Outlook Value (US$ Million) by Data Transfer Modes, 2023 to 2033

Figure 3: Industry Analysis and Outlook Value (US$ Million) by Application, 2023 to 2033

Figure 4: Industry Analysis and Outlook Value (US$ Million) by Country, 2023 to 2033

Figure 5: Industry Analysis and Outlook Value (US$ Million) Analysis by Country, 2018 to 2033

Figure 6: Industry Analysis and Outlook Volume (Unit) Analysis by Country, 2018 to 2033

Figure 7: Industry Analysis and Outlook Value Share (%) and BPS Analysis by Country, 2023 to 2033

Figure 8: Industry Analysis and Outlook Y-o-Y Growth (%) Projections by Country, 2023 to 2033

Figure 9: Industry Analysis and Outlook Value (US$ Million) Analysis by Type, 2018 to 2033

Figure 10: Industry Analysis and Outlook Volume (Unit) Analysis by Type, 2018 to 2033

Figure 11: Industry Analysis and Outlook Value Share (%) and BPS Analysis by Type, 2023 to 2033

Figure 12: Industry Analysis and Outlook Y-o-Y Growth (%) Projections by Type, 2023 to 2033

Figure 13: Industry Analysis and Outlook Value (US$ Million) Analysis by Data Transfer Modes, 2018 to 2033

Figure 14: Industry Analysis and Outlook Volume (Unit) Analysis by Data Transfer Modes, 2018 to 2033

Figure 15: Industry Analysis and Outlook Value Share (%) and BPS Analysis by Data Transfer Modes, 2023 to 2033

Figure 16: Industry Analysis and Outlook Y-o-Y Growth (%) Projections by Data Transfer Modes, 2023 to 2033

Figure 17: Industry Analysis and Outlook Value (US$ Million) Analysis by Application, 2018 to 2033

Figure 18: Industry Analysis and Outlook Volume (Unit) Analysis by Application, 2018 to 2033

Figure 19: Industry Analysis and Outlook Value Share (%) and BPS Analysis by Application, 2023 to 2033

Figure 20: Industry Analysis and Outlook Y-o-Y Growth (%) Projections by Application, 2023 to 2033

Figure 21: Industry Analysis and Outlook Attractiveness by Type, 2023 to 2033

Figure 22: Industry Analysis and Outlook Attractiveness by Data Transfer Modes, 2023 to 2033

Figure 23: Industry Analysis and Outlook Attractiveness by Application, 2023 to 2033

Figure 24: Industry Analysis and Outlook Attractiveness by Region, 2023 to 2033

Figure 25: UK Industry Analysis and Outlook Value (US$ Million) by Type, 2023 to 2033

Figure 26: UK Industry Analysis and Outlook Value (US$ Million) by Data Transfer Modes, 2023 to 2033

Figure 27: UK Industry Analysis and Outlook Value (US$ Million) by Application, 2023 to 2033

Figure 28: UK Industry Analysis and Outlook Value (US$ Million) By Region, 2023 to 2033

Figure 29: UK Industry Analysis and Outlook Value (US$ Million) Analysis By Region, 2018 to 2033

Figure 30: UK Industry Analysis and Outlook Volume (Unit) Analysis By Region, 2018 to 2033

Figure 31: UK Industry Analysis and Outlook Value Share (%) and BPS Analysis By Region, 2023 to 2033

Figure 32: UK Industry Analysis and Outlook Y-o-Y Growth (%) Projections By Region, 2023 to 2033

Figure 33: UK Industry Analysis and Outlook Value (US$ Million) Analysis by Type, 2018 to 2033

Figure 34: UK Industry Analysis and Outlook Volume (Unit) Analysis by Type, 2018 to 2033

Figure 35: UK Industry Analysis and Outlook Value Share (%) and BPS Analysis by Type, 2023 to 2033

Figure 36: UK Industry Analysis and Outlook Y-o-Y Growth (%) Projections by Type, 2023 to 2033

Figure 37: UK Industry Analysis and Outlook Value (US$ Million) Analysis by Data Transfer Modes, 2018 to 2033

Figure 38: UK Industry Analysis and Outlook Volume (Unit) Analysis by Data Transfer Modes, 2018 to 2033

Figure 39: UK Industry Analysis and Outlook Value Share (%) and BPS Analysis by Data Transfer Modes, 2023 to 2033

Figure 40: UK Industry Analysis and Outlook Y-o-Y Growth (%) Projections by Data Transfer Modes, 2023 to 2033

Figure 41: UK Industry Analysis and Outlook Value (US$ Million) Analysis by Application, 2018 to 2033

Figure 42: UK Industry Analysis and Outlook Volume (Unit) Analysis by Application, 2018 to 2033

Figure 43: UK Industry Analysis and Outlook Value Share (%) and BPS Analysis by Application, 2023 to 2033

Figure 44: UK Industry Analysis and Outlook Y-o-Y Growth (%) Projections by Application, 2023 to 2033

Figure 45: UK Industry Analysis and Outlook Attractiveness by Type, 2023 to 2033

Figure 46: UK Industry Analysis and Outlook Attractiveness by Data Transfer Modes, 2023 to 2033

Figure 47: UK Industry Analysis and Outlook Attractiveness by Application, 2023 to 2033

Figure 48: UK Industry Analysis and Outlook Attractiveness By Region, 2023 to 2033

Figure 49: Germany Industry Analysis and Outlook Value (US$ Million) by Type, 2023 to 2033

Figure 50: Germany Industry Analysis and Outlook Value (US$ Million) by Data Transfer Modes, 2023 to 2033

Figure 51: Germany Industry Analysis and Outlook Value (US$ Million) by Application, 2023 to 2033

Figure 52: Germany Industry Analysis and Outlook Value (US$ Million) By Region, 2023 to 2033

Figure 53: Germany Industry Analysis and Outlook Value (US$ Million) Analysis By Region, 2018 to 2033

Figure 54: Germany Industry Analysis and Outlook Volume (Unit) Analysis By Region, 2018 to 2033

Figure 55: Germany Industry Analysis and Outlook Value Share (%) and BPS Analysis By Region, 2023 to 2033

Figure 56: Germany Industry Analysis and Outlook Y-o-Y Growth (%) Projections By Region, 2023 to 2033

Figure 57: Germany Industry Analysis and Outlook Value (US$ Million) Analysis by Type, 2018 to 2033

Figure 58: Germany Industry Analysis and Outlook Volume (Unit) Analysis by Type, 2018 to 2033

Figure 59: Germany Industry Analysis and Outlook Value Share (%) and BPS Analysis by Type, 2023 to 2033

Figure 60: Germany Industry Analysis and Outlook Y-o-Y Growth (%) Projections by Type, 2023 to 2033

Figure 61: Germany Industry Analysis and Outlook Value (US$ Million) Analysis by Data Transfer Modes, 2018 to 2033

Figure 62: Germany Industry Analysis and Outlook Volume (Unit) Analysis by Data Transfer Modes, 2018 to 2033

Figure 63: Germany Industry Analysis and Outlook Value Share (%) and BPS Analysis by Data Transfer Modes, 2023 to 2033

Figure 64: Germany Industry Analysis and Outlook Y-o-Y Growth (%) Projections by Data Transfer Modes, 2023 to 2033

Figure 65: Germany Industry Analysis and Outlook Value (US$ Million) Analysis by Application, 2018 to 2033

Figure 66: Germany Industry Analysis and Outlook Volume (Unit) Analysis by Application, 2018 to 2033

Figure 67: Germany Industry Analysis and Outlook Value Share (%) and BPS Analysis by Application, 2023 to 2033

Figure 68: Germany Industry Analysis and Outlook Y-o-Y Growth (%) Projections by Application, 2023 to 2033

Figure 69: Germany Industry Analysis and Outlook Attractiveness by Type, 2023 to 2033

Figure 70: Germany Industry Analysis and Outlook Attractiveness by Data Transfer Modes, 2023 to 2033

Figure 71: Germany Industry Analysis and Outlook Attractiveness by Application, 2023 to 2033

Figure 72: Germany Industry Analysis and Outlook Attractiveness By Region, 2023 to 2033

Figure 73: Italy Industry Analysis and Outlook Value (US$ Million) by Type, 2023 to 2033

Figure 74: Italy Industry Analysis and Outlook Value (US$ Million) by Data Transfer Modes, 2023 to 2033

Figure 75: Italy Industry Analysis and Outlook Value (US$ Million) by Application, 2023 to 2033

Figure 76: Italy Industry Analysis and Outlook Value (US$ Million) By Region, 2023 to 2033

Figure 77: Italy Industry Analysis and Outlook Value (US$ Million) Analysis By Region, 2018 to 2033

Figure 78: Italy Industry Analysis and Outlook Volume (Unit) Analysis By Region, 2018 to 2033

Figure 79: Italy Industry Analysis and Outlook Value Share (%) and BPS Analysis By Region, 2023 to 2033

Figure 80: Italy Industry Analysis and Outlook Y-o-Y Growth (%) Projections By Region, 2023 to 2033

Figure 81: Italy Industry Analysis and Outlook Value (US$ Million) Analysis by Type, 2018 to 2033

Figure 82: Italy Industry Analysis and Outlook Volume (Unit) Analysis by Type, 2018 to 2033

Figure 83: Italy Industry Analysis and Outlook Value Share (%) and BPS Analysis by Type, 2023 to 2033

Figure 84: Italy Industry Analysis and Outlook Y-o-Y Growth (%) Projections by Type, 2023 to 2033

Figure 85: Italy Industry Analysis and Outlook Value (US$ Million) Analysis by Data Transfer Modes, 2018 to 2033

Figure 86: Italy Industry Analysis and Outlook Volume (Unit) Analysis by Data Transfer Modes, 2018 to 2033

Figure 87: Italy Industry Analysis and Outlook Value Share (%) and BPS Analysis by Data Transfer Modes, 2023 to 2033

Figure 88: Italy Industry Analysis and Outlook Y-o-Y Growth (%) Projections by Data Transfer Modes, 2023 to 2033

Figure 89: Italy Industry Analysis and Outlook Value (US$ Million) Analysis by Application, 2018 to 2033

Figure 90: Italy Industry Analysis and Outlook Volume (Unit) Analysis by Application, 2018 to 2033

Figure 91: Italy Industry Analysis and Outlook Value Share (%) and BPS Analysis by Application, 2023 to 2033

Figure 92: Italy Industry Analysis and Outlook Y-o-Y Growth (%) Projections by Application, 2023 to 2033

Figure 93: Italy Industry Analysis and Outlook Attractiveness by Type, 2023 to 2033

Figure 94: Italy Industry Analysis and Outlook Attractiveness by Data Transfer Modes, 2023 to 2033

Figure 95: Italy Industry Analysis and Outlook Attractiveness by Application, 2023 to 2033

Figure 96: Italy Industry Analysis and Outlook Attractiveness By Region, 2023 to 2033

Figure 97: France Industry Analysis and Outlook Value (US$ Million) by Type, 2023 to 2033

Figure 98: France Industry Analysis and Outlook Value (US$ Million) by Data Transfer Modes, 2023 to 2033

Figure 99: France Industry Analysis and Outlook Value (US$ Million) by Application, 2023 to 2033

Figure 100: France Industry Analysis and Outlook Value (US$ Million) By Region, 2023 to 2033

Figure 101: France Industry Analysis and Outlook Value (US$ Million) Analysis By Region, 2018 to 2033

Figure 102: France Industry Analysis and Outlook Volume (Unit) Analysis By Region, 2018 to 2033

Figure 103: France Industry Analysis and Outlook Value Share (%) and BPS Analysis By Region, 2023 to 2033

Figure 104: France Industry Analysis and Outlook Y-o-Y Growth (%) Projections By Region, 2023 to 2033

Figure 105: France Industry Analysis and Outlook Value (US$ Million) Analysis by Type, 2018 to 2033

Figure 106: France Industry Analysis and Outlook Volume (Unit) Analysis by Type, 2018 to 2033

Figure 107: France Industry Analysis and Outlook Value Share (%) and BPS Analysis by Type, 2023 to 2033

Figure 108: France Industry Analysis and Outlook Y-o-Y Growth (%) Projections by Type, 2023 to 2033

Figure 109: France Industry Analysis and Outlook Value (US$ Million) Analysis by Data Transfer Modes, 2018 to 2033

Figure 110: France Industry Analysis and Outlook Volume (Unit) Analysis by Data Transfer Modes, 2018 to 2033

Figure 111: France Industry Analysis and Outlook Value Share (%) and BPS Analysis by Data Transfer Modes, 2023 to 2033

Figure 112: France Industry Analysis and Outlook Y-o-Y Growth (%) Projections by Data Transfer Modes, 2023 to 2033

Figure 113: France Industry Analysis and Outlook Value (US$ Million) Analysis by Application, 2018 to 2033

Figure 114: France Industry Analysis and Outlook Volume (Unit) Analysis by Application, 2018 to 2033

Figure 115: France Industry Analysis and Outlook Value Share (%) and BPS Analysis by Application, 2023 to 2033

Figure 116: France Industry Analysis and Outlook Y-o-Y Growth (%) Projections by Application, 2023 to 2033

Figure 117: France Industry Analysis and Outlook Attractiveness by Type, 2023 to 2033

Figure 118: France Industry Analysis and Outlook Attractiveness by Data Transfer Modes, 2023 to 2033

Figure 119: France Industry Analysis and Outlook Attractiveness by Application, 2023 to 2033

Figure 120: France Industry Analysis and Outlook Attractiveness By Region, 2023 to 2033

Figure 121: Spain Industry Analysis and Outlook Value (US$ Million) by Type, 2023 to 2033

Figure 122: Spain Industry Analysis and Outlook Value (US$ Million) by Data Transfer Modes, 2023 to 2033

Figure 123: Spain Industry Analysis and Outlook Value (US$ Million) by Application, 2023 to 2033

Figure 124: Spain Industry Analysis and Outlook Value (US$ Million) By Region, 2023 to 2033

Figure 125: Spain Industry Analysis and Outlook Value (US$ Million) Analysis By Region, 2018 to 2033

Figure 126: Spain Industry Analysis and Outlook Volume (Unit) Analysis By Region, 2018 to 2033

Figure 127: Spain Industry Analysis and Outlook Value Share (%) and BPS Analysis By Region, 2023 to 2033

Figure 128: Spain Industry Analysis and Outlook Y-o-Y Growth (%) Projections By Region, 2023 to 2033

Figure 129: Spain Industry Analysis and Outlook Value (US$ Million) Analysis by Type, 2018 to 2033

Figure 130: Spain Industry Analysis and Outlook Volume (Unit) Analysis by Type, 2018 to 2033

Figure 131: Spain Industry Analysis and Outlook Value Share (%) and BPS Analysis by Type, 2023 to 2033

Figure 132: Spain Industry Analysis and Outlook Y-o-Y Growth (%) Projections by Type, 2023 to 2033

Figure 133: Spain Industry Analysis and Outlook Value (US$ Million) Analysis by Data Transfer Modes, 2018 to 2033

Figure 134: Spain Industry Analysis and Outlook Volume (Unit) Analysis by Data Transfer Modes, 2018 to 2033

Figure 135: Spain Industry Analysis and Outlook Value Share (%) and BPS Analysis by Data Transfer Modes, 2023 to 2033

Figure 136: Spain Industry Analysis and Outlook Y-o-Y Growth (%) Projections by Data Transfer Modes, 2023 to 2033

Figure 137: Spain Industry Analysis and Outlook Value (US$ Million) Analysis by Application, 2018 to 2033

Figure 138: Spain Industry Analysis and Outlook Volume (Unit) Analysis by Application, 2018 to 2033

Figure 139: Spain Industry Analysis and Outlook Value Share (%) and BPS Analysis by Application, 2023 to 2033

Figure 140: Spain Industry Analysis and Outlook Y-o-Y Growth (%) Projections by Application, 2023 to 2033

Figure 141: Spain Industry Analysis and Outlook Attractiveness by Type, 2023 to 2033

Figure 142: Spain Industry Analysis and Outlook Attractiveness by Data Transfer Modes, 2023 to 2033

Figure 143: Spain Industry Analysis and Outlook Attractiveness by Application, 2023 to 2033

Figure 144: Spain Industry Analysis and Outlook Attractiveness By Region, 2023 to 2033

Figure 145: Rest of Industry Analysis and Outlook Value (US$ Million) by Type, 2023 to 2033

Figure 146: Rest of Industry Analysis and Outlook Value (US$ Million) by Data Transfer Modes, 2023 to 2033

Figure 147: Rest of Industry Analysis and Outlook Value (US$ Million) by Application, 2023 to 2033

Figure 148: Rest of Industry Analysis and Outlook Value (US$ Million) Analysis by Type, 2018 to 2033

Figure 149: Rest of Industry Analysis and Outlook Volume (Unit) Analysis by Type, 2018 to 2033

Figure 150: Rest of Industry Analysis and Outlook Value Share (%) and BPS Analysis by Type, 2023 to 2033

Figure 151: Rest of Industry Analysis and Outlook Y-o-Y Growth (%) Projections by Type, 2023 to 2033

Figure 152: Rest of Industry Analysis and Outlook Value (US$ Million) Analysis by Data Transfer Modes, 2018 to 2033

Figure 153: Rest of Industry Analysis and Outlook Volume (Unit) Analysis by Data Transfer Modes, 2018 to 2033

Figure 154: Rest of Industry Analysis and Outlook Value Share (%) and BPS Analysis by Data Transfer Modes, 2023 to 2033

Figure 155: Rest of Industry Analysis and Outlook Y-o-Y Growth (%) Projections by Data Transfer Modes, 2023 to 2033

Figure 156: Rest of Industry Analysis and Outlook Value (US$ Million) Analysis by Application, 2018 to 2033

Figure 157: Rest of Industry Analysis and Outlook Volume (Unit) Analysis by Application, 2018 to 2033

Figure 158: Rest of Industry Analysis and Outlook Value Share (%) and BPS Analysis by Application, 2023 to 2033

Figure 159: Rest of Industry Analysis and Outlook Y-o-Y Growth (%) Projections by Application, 2023 to 2033

Figure 160: Rest of Industry Analysis and Outlook Attractiveness by Type, 2023 to 2033

Figure 161: Rest of Industry Analysis and Outlook Attractiveness by Data Transfer Modes, 2023 to 2033

Figure 162: Rest of Industry Analysis and Outlook Attractiveness by Application, 2023 to 2033

Recommendations

Technology

Printed Electronics Market

Published : November 2022

Technology

I2C Bus Market

Published : June 2022

Explore Technology Insights

View Reports

I2C Bus Industry Analysis in Western Europe