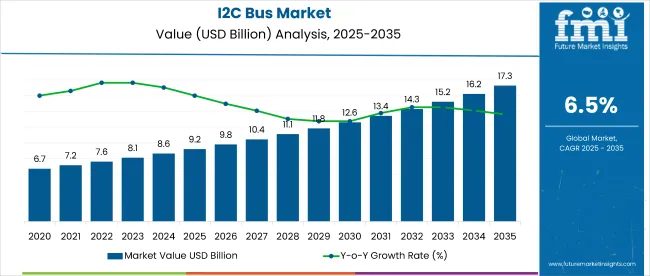
The global Inter-Integrated Circuit (I2C) Bus Market is forecast to rise from USD 9.2 billion in 2025 to USD 17.2 billion by 2035, registering a 6.5% CAGR after generating USD 8.63 billion in 2024. Annual growth of 6.2% is expected in 2025 as three structural forces converge-the proliferation of low-power IoT nodes, escalating sensor density inside electric and autonomous vehicles, and designers’ pivot toward lean, two-wire serial buses in industrial and medical electronics.
I2C’s appeal remains its elegant simplicity-two conductors, multi-master arbitration, hot-swap resilience, and minimal silicon area versus SPI or CAN. Automotive tier-ones now daisy-chain lidar, radar, inertial, and thermal modules over hardened Fast-mode Plus links; a 2024 teardown of a level-3 ADAS ECU revealed more than eighty unique I2C addresses on a single stack. In analytics, tinyML microcontrollers integrate I2C GPIO expanders and power-management ICs, trimming bill-of-materials by up to eighteen percent, according to a Journal of Embedded Systems meta-analysis published January 2025.
| Attributes | Key Insights |
|---|---|
| Estimated Size, 2025 | USD 9.2 billion |
| Projected Size, 2035 | USD 17.2 billion |
| Value-based CAGR (2025 to 2035) | 6.5% |
Asia Pacific will record the fastest expansion, exceeding seven percent CAGR, as Chinese and South Korean foundries ramp 28-65 nm mixed-signal lines optimized for advanced silicon. North America retains leadership, buoyed by medical imaging, aerospace, and defense programs that prize deterministic arbitration plus IEC 60601 isolation.
EU Chips Act grants are catalyzing new interface capacity in Germany and France, securing automotive supply chains and reinforcing Europe’s mid-decade rebound. An IEEE Transactions on Electronics Packaging study (2024) calculated that consolidating four discrete SPI nets into one I2C rail can cut PCB copper area fifteen percent and reduce embodied carbon eight percent, supporting Scope 3 targets under forthcoming CSRD rules.
Competition remains intense. NXP, Texas Instruments, STMicroelectronics, and Microchip collectively command sixty percent of unit shipments, yet specialists including ABLIC, ROHM, and Silergy gain share with ultra-low-leakage, 400-nanoamp standby devices for coin-cell wearables.
Reflecting sector optimism, Microchip CEO Ganesh Moorthy remarked in March 2025, “The exploding variety of connected endpoints lets us blend microcontrollers and interface solutions in ways that multiply growth across fragmented markets.” With sensor fusion rising and edge-AI footprints widening, I2C is poised to remain the linchpin of affordable, low-pin-count connectivity through 2035.
The I2C Bus Market is expanding rapidly in the IoT sensors segment, driven by regional priorities in automation, energy efficiency, and embedded system innovation. Both developed and developing economies are accelerating adoption, but with distinct focus areas shaped by their industrial and digital maturity.
The I2C Bus Market is navigating an increasingly complex regulatory landscape, where compliance frameworks are shaping design, sourcing, and manufacturing practices. Distinct regulatory approaches in developed and developing economies are influencing how companies align with environmental and quality standards.
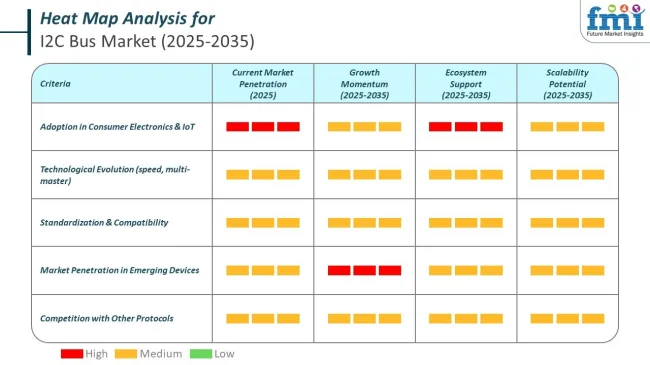
The below table presents the expected CAGR for the global I2C Bus market over several semi-annual periods spanning from 2025 to 2035. In the first half H1 of the year from 2024 to 2034, the business is predicted to surge at a CAGR of 5.3%, followed by a slightly higher growth rate of 5.6% in the second half H2 of the same year.
| Particular | Value CAGR |
|---|---|
| H1, 2024 | 5.3% (2024 to 2034) |
| H2, 2024 | 5.6% (2024 to 2034) |
| H1, 2025 | 6.2% (2025 to 2035) |
| H2, 2025 | 6.5% (2025 to 2035) |
Moving into the subsequent period, from H1 2024 to H2 2034, the CAGR is projected to increase slightly to 6.2% in the first half and remain relatively moderate at 5.5% in the second half. In the first half H1 the market witnessed a decrease of 30 BPS while in the second half H2, the market witnessed an increase of 30 BPS.
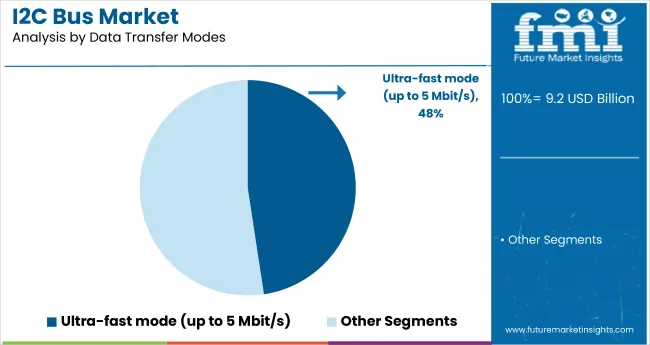
The Fast-mode Plus (up to 1 Mbit/s) segment of the I2C bus market is projected to grow significantly, registering a CAGR of 7.2% from 2025 to 2035. This growth is primarily attributed to increased demand for higher data transfer speeds across multiple applications, including automotive electronics, industrial automation, and advanced consumer devices. Modern vehicles, featuring numerous electronic control units (ECUs), rely heavily on efficient and rapid data communication. Likewise, industrial automation systems require fast data transfers to enhance operational efficiency, accuracy, and real-time monitoring capabilities.
Consumer electronics, such as smartphones, smart home devices, and wearables, also depend on quicker data rates for seamless user experiences. Fast-mode Plus meets these requirements by delivering data transfer speeds significantly higher than standard I2C protocols, offering improved system performance, reduced latency, and enhanced reliability.
Leading electronics manufacturers, such as NXP Semiconductors and Texas Instruments, prioritize developing solutions supporting Fast-mode Plus to accommodate evolving technological standards. Consequently, ongoing innovation in high-speed communication requirements drives sustained market expansion for the Fast-mode Plus segment globally.
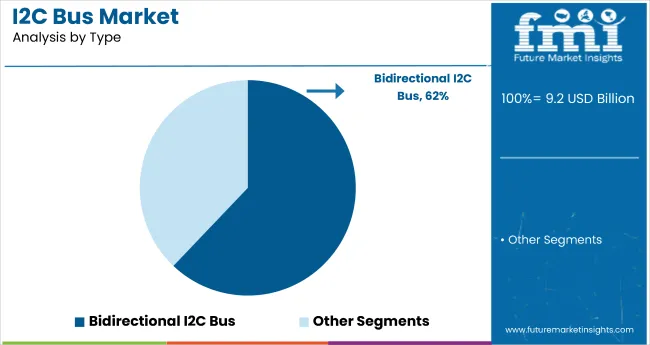
The bidirectional I2C bus segment is expected to dominate the market, capturing a significant market share of approximately 62.1% in 2025. Its market dominance stems from extensive application across diverse industries due to its versatile two-way communication capabilities.
Bidirectional buses allow efficient, real-time data exchange between devices, essential for complex electronic systems, including automotive control units, consumer electronics, and industrial machinery. This ability to manage bidirectional data flow makes it ideal for sophisticated systems that require continuous interaction between multiple components, such as advanced driver-assistance systems (ADAS), smart home appliances, and industrial control networks.
Prominent players in the electronics sector, such as Analog Devices, Microchip Technology, and Infineon Technologies, continue to enhance bidirectional I2C solutions to support increasing demand for sophisticated communication protocols. Additionally, rising adoption in IoT-enabled devices and smart city applications further solidifies its significance in future technology infrastructures. The broad applicability, reliability, and flexibility of bidirectional I2C buses thus drive its sustained market leadership and substantial adoption across various global industries.
Increase in highly-connected ‘Internet of Things’ (IoT) Networks Driving Market Demand.
The core components of the highly connected "Internet of Things" (IoT) networks, which are increasingly being employed in smart city and smart grid designs, are digital devices like sensors. Digital interfaces for the newest sensors, such as temperature, pressure, and humidity sensors, are streamlining the IoT interface to increase system reliability and functionality.
The basis for control and optimization is the ability to access data from devices located anywhere in the globe that are connected to "big data" information systems via the internet. This is at the core of global innovations in smart grid and smart cities. In certain situations, connecting sensors to the internet of things is rather straightforward, but in others, it requires more consideration.
I2C and SPI interfaces are two commonly used interfaces that serve as a bridge between digital devices and the internet of things. I2C bus is frequently used for communication between microcontrollers and sensor arrays, displays, internet of things (IoT) devices, EEPROMs, etc., due to its simplicity. Thus, an increase in the adoption of IoT devices has fueled the demand for the I2C bus market.
Evolution and Expansion of Consumer Electronics, Telecommunications, and Industrial Electronics Sectors to Boost Sales of I2C Bus.
As electronics, telecommunications, and consumer electronics fields grow, they shape the world around us. A digital revolution is sweeping the globe driving up demand for electronics and telecommunications. This leads to more people using electronic devices. The semiconductor market has been changing and growing worldwide. The huge demand for cutting-edge smart devices and related tech improvements has a big impact on this growth.
A dependable interface to transmit data plays a crucial role in industrial, telecommunications, and electronics fields to enable low-speed close-range communication. The inter-integrated circuit bus is a 2-wire, two-way bus. I2C proves to be a solid option for projects that need simple setup at a low price tag rather than high speeds. It has an impact on sending and managing user-driven actions getting data from hardware sensors and interacting with multiple micro-controllers.
This means the quick expansion of areas such as telecommunications and electronics, has resulted in I2C buses gaining wide acceptance.
Scarcity of Skilled Professionals for Design and Repairs of I2C to Hinder Market Growth
The need for skilled workers is growing in the ICT field and other parts of the digital economy due to cutting-edge digital tech. A worldwide lack of qualified experts and workers might slow down economic growth.
The I2C bus field is moving toward modernization by adding smart tech. I2C links microcontrollers EEPROMs, I/O ports, and other devices in embedded systems. Often, a microcontroller acts as the master device, while various peripheral devices serve as slaves.
The creation, fixing, and use of I2C systems need know-how, which is hard to find in the industry right now. Not having enough skilled workers to manage and fix these circuits between chips is a big problem for operations.
I2C has some downsides. It makes circuits more complex with extra master/slave setups. This makes them harder to run and means you need designers who know their stuff. So, not having enough of these skilled designers is slowing down how fast the market can grow.
Limitations of I2C Bus Affecting Market Growth
The I2C Bus works well for projects that need to be set up and rather than ones that need high speed. You can choose from a few very limited communication speeds, and many devices can't send data at higher speeds. You have to provide some support for each speed on the bus to stop slower devices from getting incomplete messages, which could cause problems.
Also, because of how the communication lines are set up (open-drain), I2C uses more power than other ways of sending data. Several slave devices share an I2C bus; if any one of these slaves acts up (keeps SCL or SDA low for too long), the bus will stop working. No more messages will be sent back and forth.
The market has also been held back by its role, which boosts protocol overhead and cuts throughput. This means these shortcomings of the I2C bus have an impact on the I2C bus market.
The global I2C Bus industry recorded a CAGR of 6.5% during the historical period between 2020 and 2024. The growth of I2C Bus industry share was positive as it reached a value of USD 8,629.2 million in 2024 from USD 6,710.2 million in 2020.
From 2020 to 2024 global I2C bus sales kept going up showing how they're used more in consumer electronics, cars, and factories. More smart devices and the need to connect devices better led to higher demand for I2C buses during this time.
For 2025 to 2035, experts think the I2C bus market will grow a lot. This growth will happen because more people will use them in Internet of Things devices smart home tech, and newer car systems. During this time, we'll see more people want I2C buses because of new improvements. These include faster data speeds and using less power. All this puts the industry in a good spot to grow big matching the wider trends of more digital connections and smart device use.
Tier1: Texas Instruments Incorporated, NXP Semiconductors, Microchip Technology Inc., Renesas Electronics Corporation, and Infineon Technologies They are the dominant players in the industry and have influence on the semiconductor, which consists of I2C bus options. They are very competitive as a result of their cutting-edge technology, broad product portfolio, and wide geographic coverage. Doing so puts them in a position to create new ideas and satisfy a range of application needs.
Tier 2: STMicroelectronics, Analog Devices, Inc., Silicon Laboratories Inc. The I2C bus market is heavily influenced by these companies and their offerings and technologies that compete against each other and, more importantly, with the big guys. They specialize in providing high-quality solutions that address unique needs in consumer electronics, automobiles, and industrial applications, focusing on niche applications and innovations.
Tier 3: Semiconductors Components Industries, LLC Intel Corporation Panasonic Corporation These firms shape the larger semiconductor and electronics ecosphere, but I2C bus solutions are a small portion of those companies. They do a lot but do not impact the I2C bus market like Tier 1, Tier 2, keeps their participate.
The section below covers the industry analysis for the I2C Bus market for different countries. The market demand analysis on key countries in several countries of the globe, including USA, Germany, UK, China and India are provided.
The united states are expected to remains at the forefront in North America, with a value share of 61.2% in 2025. In South Asia & Pacific, India is projected to witness a CAGR of 7.4% during the forecasted period.
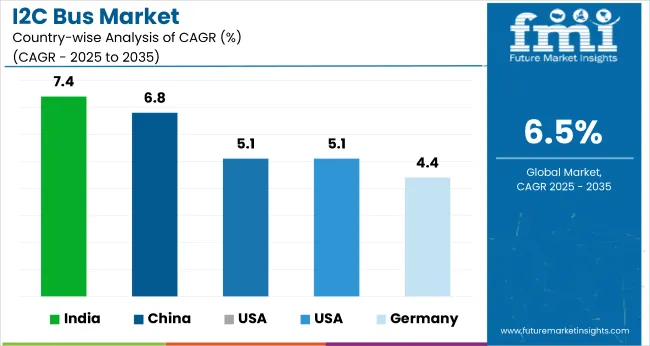
| Countries | Value CAGR (2025 to 2035) |
|---|---|
| USA | 5.1% |
| Germany | 4.4% |
| UK | 5.1% |
| China | 6.8% |
| india | 7.4% |
The need for I2C bus solutions in the United States is growing as more people buy smart home gadgets, wearables, and car electronics. The USA government's efforts to build smart infrastructure and start IoT projects have created a bigger need for I2C, which is good at communicating with low power use.
The USA Department of Energy says that money put into smart grid tech and smart home systems is making this happen. They've set aside a lot of cash to develop advanced electronic parts and systems.
In the UK, I2C bus solutions have good sales prospects because of the growing focus on smart manufacturing and Industry 4.0. The UK government's Industrial Strategy aims to increase automation and digitalization in manufacturing creating a good environment for I2C bus solutions to thrive.
The UK's Department for Business, Energy & Industrial Strategy (BEIS) reports on the rising investments in digital infrastructure. These investments will boost the demand to use efficient communication protocols in industrial and consumer applications.
In India, there's a big chance for adopting the I2C bus technology. This is because electronics manufacturing is growing fast and smart city projects are expanding. The Indian Ministry of Electronics and Information Technology (MeitY) helps programs to make electronic component manufacturing better.
This includes putting I2C technology into different devices. People think India's electronics sector will grow a lot. Because of this more people will want I2C solutions. The government's Production Linked Incentive (PLI) plan backs this up. This plan tries to make more electronics in India.
The I2C bus market has a lot of competition, with big names like Texas Instruments, NXP Semiconductors, and Microchip Technology leading the pack. These companies stand out because they offer a wide range of products and cutting-edge tech solutions. They're all trying to get a bigger piece of the market pie by coming up with new ideas for I2C bus tech, like making data move faster and using less power.
Companies such as STMicroelectronics and Analog Devices also play a big role in this market. They focus on special uses and new trends like the Internet of Things and car electronics. The market moves fast, with tech always getting better. There's also a big push to put I2C solutions into the newest electronic gadgets.
Recent Industry Developments in I2C Bus Market:
| Report Attributes | Details |
|---|---|
| Current Total Market Size (2022) | USD 9.2 billion |
| Projected Market Size (2032) | USD 17.2 billion |
| CAGR (2022 to 2032) | 6.5% |
| Base Year for Estimation | 2024 |
| Historical Period | 2020 to 2024 |
| Forecast Period | 2025 to 2035 |
| Quantitative Units | Revenue in USD billion; million interface units for volume |
| Mode Types Analyzed (Segment 1) | Standard-Mode (Up to 100 kbit/s), Fast-Mode (Up to 400 kbit/s), Fast-Mode Plus (Up to 1 Mbit/s), High-Speed Mode (Up to 3.4 Mbit/s), Ultra-Fast Mode (Up to 5 Mbit/s) |
| Bus Types Analyzed (Segment 2) | Bidirectional Bus, Unidirectional Bus |
| Applications Analyzed (Segment 3) | System Management Bus (SMBus), Power Management Bus (PMBus), Intelligent Platform Management Interface (IPMI), Display Data Channel (DDC), Advanced Telecom Computing Architecture (ATCA) |
| Regions Covered | North America; Latin America; Western Europe; Eastern Europe; South Asia and Pacific; East Asia; Middle East & Africa |
| Countries Covered | United States, Canada, Germany, France, United Kingdom, Italy, Spain, China, India, Japan, South Korea, Australia, Brazil, Mexico, South Africa |
| Key Players Influencing the I2C Bus Market | NXP Semiconductors N.V.; Renesas Electronics Corporation; Texas Instruments Incorporated; STMicroelectronics N.V.; Microchip Technology Inc.; Analog Devices, Inc.; Infineon Technologies AG; ROHM Semiconductor; Cypress Semiconductor Corporation |
| Additional Attributes | Market segmentation by mode type, bus type, and application; analysis of adoption trends in various industries; overview of technological advancements in I2C bus implementations; regional market trends and growth opportunities |
In terms of Type, the segment is segregated into Unidirectional I2C Bus and Bidirectional I2C Buss.
In terms of Data Transfer Modes is distributed into Standard-mode (up to 100 kbit/s), Fast-mode (up to 400 kbit/s), Fast-mode Plus (up to 1 Mbit/s), High-speed mode (up to 3.4 Mbit/s) and Ultra-fast mode (up to 5 Mbit/s).
In terms of Application is distributed into System Management Bus (SMBus), Power Management Bus (PMBus), Intelligent Platform Management Interface (IPMI), Display Data Channel (DDC) and Advanced Telecom Computing Architecture (ATCA).
Key countries of North America, Latin America, Western Europe, Eastern Europe, East Asia, South Asia & pacific, Middle East and Africa (MEA) have been covered in the report.
The global I2C Bus industry is projected to witness CAGR of 6.5% between 2025 and 2035.
The global I2C Bus industry stood at USD 9.2 billion in 2025.
The global I2C Bus industry is anticipated to reach USD 17.2 billion by 2035 end.
East Asia is set to record the highest CAGR of 7.1% in the assessment period.
The key players operating in the global I2C Bus industry include Texas Instruments Incorporated, NXP Semiconductors, Semiconductor Components Industries, LLC, Microchip Technology Inc., Renesas Electronics Corporation and Infineon Technologies and others.


Our Research Products

The "Full Research Suite" delivers actionable market intel, deep dives on markets or technologies, so clients act faster, cut risk, and unlock growth.

The Leaderboard benchmarks and ranks top vendors, classifying them as Established Leaders, Leading Challengers, or Disruptors & Challengers.

Locates where complements amplify value and substitutes erode it, forecasting net impact by horizon

We deliver granular, decision-grade intel: market sizing, 5-year forecasts, pricing, adoption, usage, revenue, and operational KPIs—plus competitor tracking, regulation, and value chains—across 60 countries broadly.

Spot the shifts before they hit your P&L. We track inflection points, adoption curves, pricing moves, and ecosystem plays to show where demand is heading, why it is changing, and what to do next across high-growth markets and disruptive tech

Real-time reads of user behavior. We track shifting priorities, perceptions of today’s and next-gen services, and provider experience, then pace how fast tech moves from trial to adoption, blending buyer, consumer, and channel inputs with social signals (#WhySwitch, #UX).

Partner with our analyst team to build a custom report designed around your business priorities. From analysing market trends to assessing competitors or crafting bespoke datasets, we tailor insights to your needs.
Supplier Intelligence
Discovery & Profiling
Capacity & Footprint
Performance & Risk
Compliance & Governance
Commercial Readiness
Who Supplies Whom
Scorecards & Shortlists
Playbooks & Docs
Category Intelligence
Definition & Scope
Demand & Use Cases
Cost Drivers
Market Structure
Supply Chain Map
Trade & Policy
Operating Norms
Deliverables
Buyer Intelligence
Account Basics
Spend & Scope
Procurement Model
Vendor Requirements
Terms & Policies
Entry Strategy
Pain Points & Triggers
Outputs
Pricing Analysis
Benchmarks
Trends
Should-Cost
Indexation
Landed Cost
Commercial Terms
Deliverables
Brand Analysis
Positioning & Value Prop
Share & Presence
Customer Evidence
Go-to-Market
Digital & Reputation
Compliance & Trust
KPIs & Gaps
Outputs
Full Research Suite comprises of:
Market outlook & trends analysis
Interviews & case studies
Strategic recommendations
Vendor profiles & capabilities analysis
5-year forecasts
8 regions and 60+ country-level data splits
Market segment data splits
12 months of continuous data updates
DELIVERED AS:
PDF EXCEL ONLINE
I2C Bus Industry Analysis in Western Europe Size and Share Forecast Outlook 2025 to 2035
Understanding Market Share Trends in the I2C Bus Sector
Japan I2C Bus Market - Trends & Forecast 2025 to 2035
Korea I2C Bus Market Trends & Forecast 2025 to 2035
Busbar for Industrial Market Size and Share Forecast Outlook 2025 to 2035
Bus Isolator Market Size and Share Forecast Outlook 2025 to 2035
Busbars Market Size and Share Forecast Outlook 2025 to 2035
Business Jet Market Size and Share Forecast Outlook 2025 to 2035
Business Storage Units Market Size and Share Forecast Outlook 2025 to 2035
Business as a Service Market Size and Share Forecast Outlook 2025 to 2035
Business Cloud VoIP & UC Services Market Size and Share Forecast Outlook 2025 to 2035
Business Intelligence Market Size and Share Forecast Outlook 2025 to 2035
Business Process Automation (BPA) Market Size and Share Forecast Outlook 2025 to 2035
Business Analytics BPO Services Market Analysis – Size, Share & Forecast 2025 to 2035
Business Value Dashboard Market Size and Share Forecast Outlook 2025 to 2035
Bus Flooring Market Growth – Trends & Forecast 2025 to 2035
Bus Bellows Market Insights – Growth & Forecast 2025 to 2035
Business Email Market Analysis by Channel, Deployment, and Region Through 2035
Business Process as a Service (BPaaS) Market Analysis by Process and Region Through 2035
Competitive Overview of Business Analytics BPO Services Companies

Thank you!
You will receive an email from our Business Development Manager. Please be sure to check your SPAM/JUNK folder too.
Chat With
MaRIA