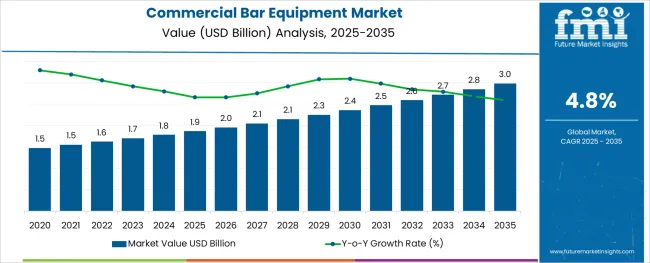
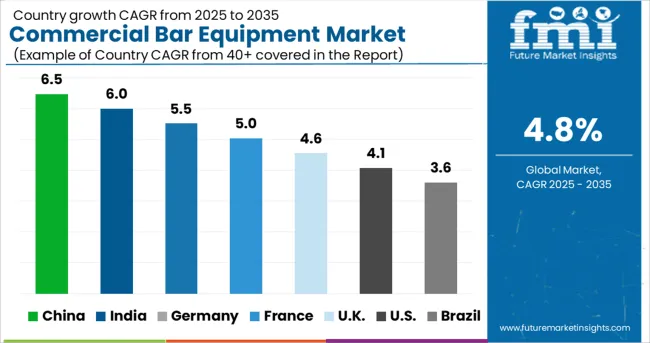
The Commercial Bar Equipment Market is estimated to be valued at USD 1.9 billion in 2025 and is projected to reach USD 3.0 billion by 2035, registering a compound annual growth rate (CAGR) of 4.8% over the forecast period.
The alginic acid market is undergoing consistent growth, propelled by rising demand from food processing, pharmaceutical formulations, and cosmetic applications. A growing focus on natural and sustainable ingredients in manufacturing processes has positioned alginic acid as a preferred biopolymer across industries.
The market is further supported by its diverse functional benefits, including water retention, gelling, and stabilizing properties, which make it indispensable in high-performance formulations. Increased regulatory acceptance of alginates as safe additives and the push towards cleaner labeling in food and personal care products have reinforced their adoption.
Ongoing innovation in extraction technologies and the utilization of algae as a renewable resource are paving the way for cost-effective production and expanded applications, ensuring sustained market expansion in the coming years.
The market is segmented by Type, Mode of Operation, and Sales Channel and region. By Type, the market is divided into Refrigeration Equipment, Ice Making Equipment, Mixing Equipment, Dishwashers, Beverage Dispenser Machine, and Other Types. In terms of Mode of Operation, the market is classified into Automatic and Semi-automatic. Based on Sales Channel, the market is segmented into Direct Channel and Retail Channel. Regionally, the market is classified into North America, Latin America, Western Europe, Eastern Europe, Balkan & Baltic Countries, Russia & Belarus, Central Asia, East Asia, South Asia & Pacific, and the Middle East & Africa.
The market is segmented by Type, Mode of Operation, and Sales Channel and region. By Type, the market is divided into Refrigeration Equipment, Ice Making Equipment, Mixing Equipment, Dishwashers, Beverage Dispenser Machine, and Other Types. In terms of Mode of Operation, the market is classified into Automatic and Semi-automatic. Based on Sales Channel, the market is segmented into Direct Channel and Retail Channel. Regionally, the market is classified into North America, Latin America, Western Europe, Eastern Europe, Balkan & Baltic Countries, Russia & Belarus, Central Asia, East Asia, South Asia & Pacific, and the Middle East & Africa.
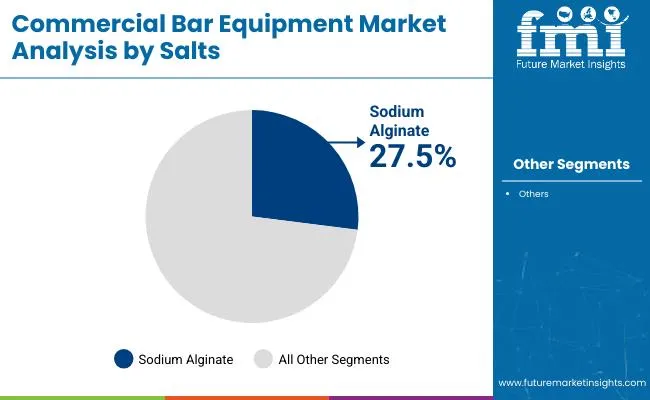
When segmented by salts, sodium alginate is expected to command 27.5% of the market revenue in 2025, marking it as the leading subsegment in this category. This leadership has been driven by its superior solubility, ease of incorporation into formulations, and versatility in a wide range of applications.
Its ability to form stable gels and maintain viscosity under varying conditions has made it highly sought after in both food and pharmaceutical sectors. Manufacturers have prioritized sodium alginate due to its consistent performance, cost-effectiveness, and regulatory acceptance, which have collectively strengthened its position.
The segment’s prominence has also been enhanced by its adaptability to evolving consumer preferences for plant-derived and sustainable ingredients, reinforcing its market share.
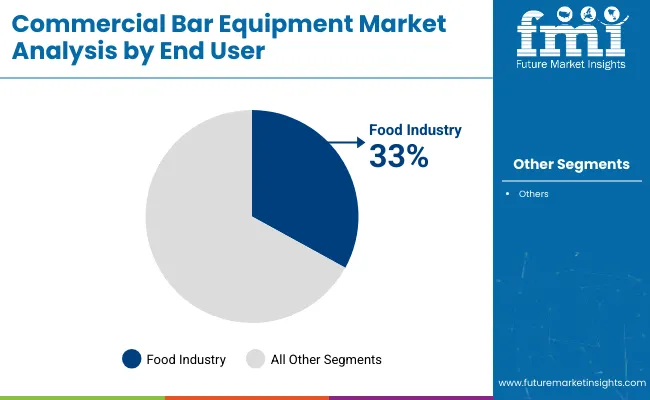
Segmented by end user industry, the food industry is projected to hold 33.0 % of the market revenue in 2025, positioning it as the most prominent sector. This dominance has been shaped by the industry’s increasing reliance on alginic acid and its derivatives to deliver desirable textures, stabilize emulsions, and improve shelf life of processed foods.
As consumer demand for clean label and natural additives has intensified, the food sector has responded by integrating alginates into bakery, dairy, and confectionery products. Enhanced production efficiency and compliance with food safety standards have further encouraged widespread use.
The segment’s leadership has also been supported by product differentiation strategies where alginates contribute to premium quality and innovation, securing their role in modern food formulations.
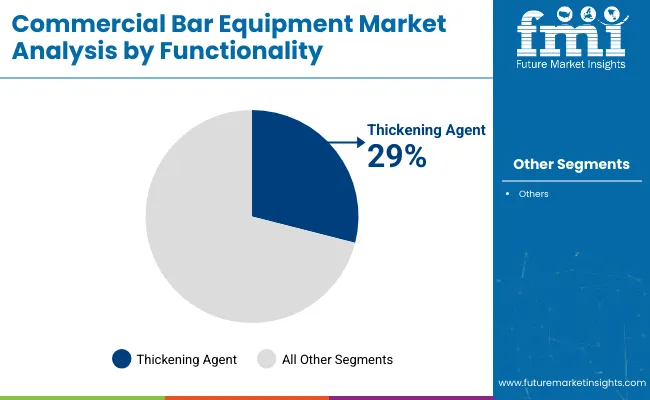
When analyzed by functionality, thickening agents are forecast to account for 29.0% of the market revenue in 2025, establishing themselves as the dominant functional category. This preeminence has been underpinned by the growing need for consistent texture and viscosity in a wide array of end products.
Alginic acid’s natural origin and high efficiency in creating uniform, stable thickness without altering taste or color have solidified its appeal. The demand for thickeners in both edible and topical applications has expanded, with manufacturers leveraging its rheological properties to meet performance and regulatory requirements.
The functionality’s leading share has also been reinforced by the ability to deliver cost savings through lower dosages and its compatibility with other ingredients, securing its position as an indispensable component in formulation strategies.
The demand for alcoholic beverages has increased exponentially as a result of rising affluence and increasing urbanization. According to research, alcohol consumption in emerging countries has climbed from 5.5 liters per person in 2020 to 7 liters per person in 2024, with approximately 30% of men in the 19 to 65-year-old age range being addicted to drinking. Alcohol use is also encouraged by active domestic and international trade.
With increasing product premiumization, consumption by middle- and low-income customers has increased dramatically, and as a result, the sales of commercial bar equipment are expected to increase.
| Attribute | Details |
|---|---|
| Commercial Bar Equipment Market Estimated Size (2025) | USD 1.7 billion |
| Commercial Bar Equipment Market CAGR (2025 to 2035) | 4.8% |
| Commercial Bar Equipment Market Forecasted Size (2035) | USD 2.7 billion |
According to FMI, the growing craft brewing business is a key contributor to the rise in sales of commercial bar equipment. The market is expanding due to rising demand for premium, low-alcohol beer as well as the emergence of taprooms and microbreweries. In addition, innovations in commercial bar equipment are being brought about by the deployment of new technology, as craft beer manufacturers look for cutting-edge tools and new technologies.
The importance of process automation is implied by the necessity of cleanliness and quality requirements for commercial bar equipment. Thus, for the contemporary brewing sector, AI, the Internet of Things (IoT), automated systems, robots, and sensors are increasingly crucial.
The high cost of installation and acquiring commercial bar equipment is a major factor limiting the market growth. Manufacturers of commercial bar equipment need to invest significant resources to install various forms of equipment. These require regular maintenance, which adds expense and reduces operating margins for beverage producers. They also have significant installation costs.
Manufacturers of commercial bar equipment search for less expensive choices, such as renting out equipment. Renting processing equipment saves on yearly maintenance costs, which are often handled by rental providers, and also need less capital expenditure.
Modern large-scale brewers employ high-tech facilities with automatic technology to produce consistently high-quality beer. Strict hygiene requirements are met by the brewing thanks to the semi-automatic commercial bar equipment. Brewhouse, filtration, cellar, and energy production are just a few examples of the numerous locations and phases that may be controlled concurrently owing to automation technology.
The brewers can control and run the pumps, valves, measured values, and controllers effectively as well as swiftly spot and resolve issues thanks to process automation. The semi-automatic technology also allows flexible recipe control in the case of artisan brewers.
Commercial bar refrigerators are used in the wholesale food and beverage sector, which includes supermarkets, specialty shops, and convenience stores. A significant driver of the demand for refrigeration equipment is thought to be the growing need for energy-efficient refrigeration in the business sector.
Manufacturers must adhere to the regulations established by the Federal Energy Management Program (FEMP) to provide ENERGY-STAR-certified commercial bar refrigeration equipment to end customers. Commercial bar refrigeration equipment that uses less energy has several advantages, including improved efficiency and lower utility and maintenance expenses for end users. Shortly, the market is anticipated to be driven by this as well.
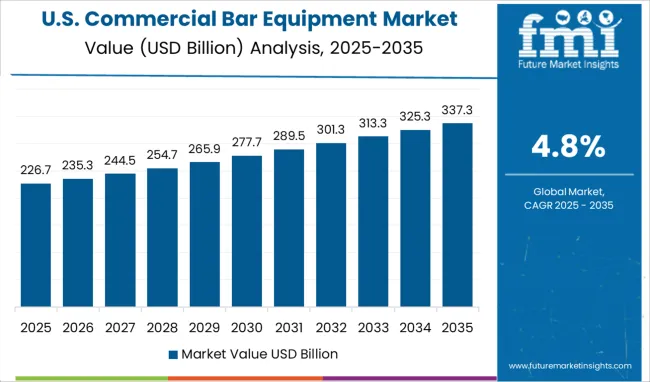
The USA commercial bar equipment industry is predicted to hold USD 3 million by 2035. The market is predicted to grow at a CAGR of 4.0% from 2025 to 2035. Currently, the USA accounts for around 50% of the North American commercial bar equipment market. This is mostly due to the industry's firms' wide range of product offerings and a vast nationwide network of distribution channels.
In addition to companies, a sizeable portion of the country's population consumes alcohol, which greatly boosts the demand for commercial bar equipment, especially in the country's residential regions.
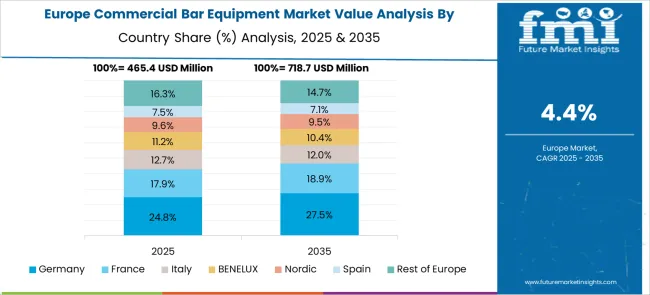
Europe's commercial bar equipment industry is well-established and home to numerous well-known brands. Consumer tastes are, nevertheless, changing in the nation. Customers have switched from regular beer supplied by large corporations to craft beer. Customers are more eager to sample the high-end beer brands that brewpubs and microbreweries provide. Additionally, France, a former wine-consuming nation, is now seeing a switch from wine to beer consumption which is anticipated to boost the demand for commercial bar equipment in the region.
Beer is widely accessible in supermarkets because of the region's well-structured retail channels. Additionally, several craft beer labels have begun occupying supermarket shelf space, making it simple for the general public to select and taste new regional brands.
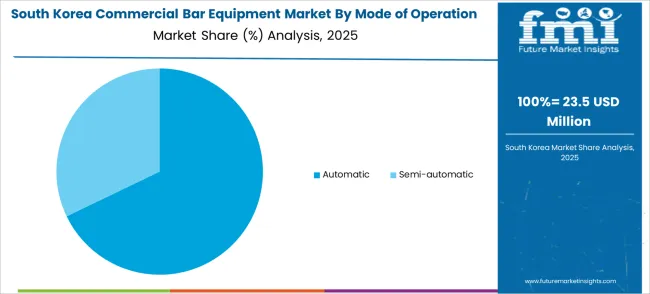
During the forecast period, the market for commercial bar equipment in Korea is anticipated to expand slowly at a CAGR of 1.8%. This results from the recent decade's moderate economic growth. By 2035, the South Korean market is projected to be worth USD 84.4 million. The development of the region's economy has also been significantly influenced by the alcoholic beverage sector.
Due to the areas' growing populations, rising incomes, and quick urbanization, alcohol consumption is also progressively rising in the regions. The increasing demand for wine and beer, as well as the government of Korea's drive toward industrialization, are both responsible for this growth.
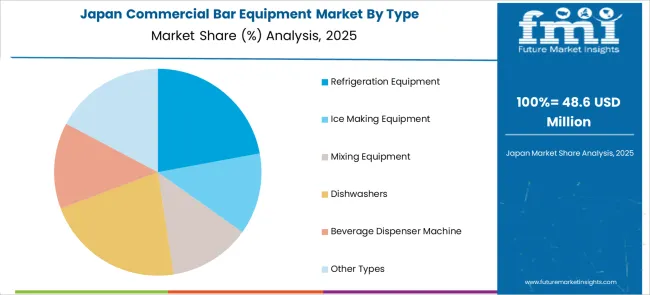
The Japan commercial bar equipment market is expected to be valued at USD 146.8 million and grow at a sluggish 2.8% CAGR during the forecast period. Throughout the forecast period, the rising urbanization and population are projected to be the primary drivers of the market for commercial bar equipment in Japan.
Due to the growing popularity of bars among millennials, the commercial bar equipment market in Japan is predicted to increase significantly in the forecast period. Over the projected period, an increase in the consumption of alcoholic drinks including wine and whiskey is anticipated to drive demand for commercial bar equipment.
Start-ups in the commercial bar equipment industry have a focus on the wine sector and have slowly emerged over the past several years, working on anything from linked corks to tech-enabled wine preservation. Additionally, a large number of digital companies have emerged that are using cutting-edge technology to disrupt the long-established wine industry.
Commercial bar equipment made by the American start-up Plum keeps wine refrigerated for up to 90 days while being able to identify and store it. The equipment, which can hold up to two different bottles of wine, uses argon gas and a motorized needle to avoid wine oxidation. Once the bottles are in the device, users may pour wine. The system may use reusable argon gas canisters, which cost around USD 29 each. Additionally, Plum provides hotels with a special service.
Using its core technologies for heat transfer, separation, and fluid management, Alfa Laval is one of the top providers of specialized products, commercial bar equipment, and engineered solutions worldwide. The Alfa Laval CarbosetTM and CarbosetTM Mini are two outstanding beer carbonation systems that can accurately, automatically, and with little maintenance carbonate both beer and other liquids, such as soft drinks. This beer carbonation machine is made to accommodate the required amount of nitrogen in beer as well as the desired level of carbon dioxide in beer to meet ideal recipes.
The company's tools, programs, and services are all intended to help clients improve the efficiency of their operations. In the food and beverage, chemical and petrochemical, pharmaceutical, starch, sugar, and ethanol sectors, the solutions assist them in heating, cooling, separating, and transporting products.
Additionally, Alfa Laval's equipment is utilized in wastewater treatment, comfort climate and refrigeration applications, ships, power plants, the mining industry, oil and gas exploration, and the mechanical engineering sector. To stay ahead in the international arena, Alfa Laval's global organization closely collaborates with clients in close to 100 countries. The Nasdaq OMX-listed Alfa Laval reported yearly sales of roughly SEK 1.5 billion in 2020. (approx. 4.0 billion Euros).
Alfa Laval released Foodec Hygiene Plus, its cleanest decanters, in February 2024. It had several elements designed to raise the bar for cleanliness. Cleaning every part of the frame's interior and exterior was made easy by the frame's integrated cleaning-in-place (CIP) bar. Alfa Laval and BenLink joined together in January 2025 to increase the scope of their service offerings for the food and energy industries.
BenLink's network of service specialists can offer real-time maintenance and assistance while being monitored by technical experts, which is advantageous for Alfa Laval's service business. Alfa Laval bought Scanjet (Sweden) in August 2025.
Scanjet is another leading supplier of commercial bar equipment, tank cleaning equipment, and solutions for use in the beverage, pharmaceutical, food, energy, pulp & paper, and transportation industries. The acquisition is anticipated to increase Alfa Laval's wide range of tanker options and broaden its selection of cargo tanks. Scanjet will also encourage client effectiveness throughout the whole freight handling procedure.
In April 2020, GE Additive (USA) and KASPAR SCHULZ Brauereimaschinenfabrik & Apparatebauanstalt GmbH teamed together to find 3D printing additive manufacturing applications in the beverage sector that would increase the expected time and yield for commercial bar equipment.
In terms of building and maintaining an infrastructure with flexibility in capacity and the potential to satisfy customer needs on a regular, and occasionally immediate, basis, the commercial bar equipment industry is very volatile. The buildings, machinery, and logistical systems needed to create and deliver high-quality, marketable goods make up the infrastructure.
Developing such an operational model needs financial investments, constant maintenance, and keeping up with technological advancements. Limitations on depreciation periods might render an asset with significant book value for a product no longer feasible. This can affect equipment acquisition decisions since they frequently depend on their capacity to fulfill relatively quick ROI needs.
Some of the Key Players Operating in the Commercial Bar Equipment Market Include:
| Attribute | Details |
|---|---|
| Growth Rate | CAGR of 4.8% from 2025 to 2035 |
| Base Year of Estimation | 2025 |
| Historical Data | 2020 to 2025 |
| Forecast Period | 2025 to 2035 |
| Quantitative Units | Revenue in billion and Volume in Units and F-CAGR from 2025 to 2035 |
| Report Coverage | Revenue Forecast, Volume Forecast, Company Ranking, Competitive Landscape, growth factors, Trends, and Pricing Analysis |
| Key Segments Covered | Operation, Type, Sales Channel |
| Regions Covered | North America; Latin America; Europe; East Asia; South Asia; Middle East & Africa; Oceania |
| Key Countries Profiled | The USA, Canada, Brazil, Mexico, Germany, Italy, France, The United Kingdom, Spain, Russia, China, Japan, India, GCC Countries, Australia |
| Key Companies Profiled | Continental Refrigerator; ONNERA GROUP; Ali; TURBO AIR; Valpro Refrigeration |
| Customization & Pricing | Available upon Request |
The global commercial bar equipment market is estimated to be valued at USD 1.9 billion in 2025.
It is projected to reach USD 3.0 billion by 2035.
The market is expected to grow at a 4.8% CAGR between 2025 and 2035.
The key product types are refrigeration equipment, ice making equipment, mixing equipment, dishwashers, beverage dispenser machine and other types.
automatic segment is expected to dominate with a 57.0% industry share in 2025.


Full Research Suite comprises of:
Market outlook & trends analysis
Interviews & case studies
Strategic recommendations
Vendor profiles & capabilities analysis
5-year forecasts
8 regions and 60+ country-level data splits
Market segment data splits
12 months of continuous data updates
DELIVERED AS:
PDF EXCEL ONLINE
Commercial Blast Freezer Market Size and Share Forecast Outlook 2025 to 2035
Commercial Water Heater Market Size and Share Forecast Outlook 2025 to 2035
Commercial High-Speed Oven Market Size and Share Forecast Outlook 2025 to 2035
Commercial Turboprop Aircrafts Market Size and Share Forecast Outlook 2025 to 2035
Commercial Vehicle Foundation Brakes Market Size and Share Forecast Outlook 2025 to 2035
Commercial Vehicle Brake Chambers Market Size and Share Forecast Outlook 2025 to 2035
Commercial Vehicle AMT Transmission Market Size and Share Forecast Outlook 2025 to 2035
Commercial Greenhouse Market Size and Share Forecast Outlook 2025 to 2035
Commercial Vessel Market Size and Share Forecast Outlook 2025 to 2035
Commercial Slush Machine Market Size and Share Forecast Outlook 2025 to 2035
Commercial Medium Voltage Distribution Panel Market Size and Share Forecast Outlook 2025 to 2035
Commercial Earth Observation (CEO) Market Size and Share Forecast Outlook 2025 to 2035
Commercial Ozone Generator Market Size and Share Forecast Outlook 2025 to 2035
Commercial Gas-Fired Boiler Market Size and Share Forecast Outlook 2025 to 2035
Commercial Deep Fryer Parts & Accessories Market Size and Share Forecast Outlook 2025 to 2035
Commercial Gas Restaurant Ranges Market Size and Share Forecast Outlook 2025 to 2035
Commercial Heat Pump Market Size and Share Forecast Outlook 2025 to 2035
Commercial Countertop Ranges Market Size and Share Forecast Outlook 2025 to 2035
Commercial Electric Restaurant Ranges Market Size and Share Forecast Outlook 2025 to 2035
Commercial Distribution Panel Market Size and Share Forecast Outlook 2025 to 2035

Thank you!
You will receive an email from our Business Development Manager. Please be sure to check your SPAM/JUNK folder too.
Chat With
MaRIA