Reports

- Global Locations -

Headquarters

Future Market Insights, Inc.

Christiana Corporate, 200
Continental Drive, Suite 401,
Newark, Delaware - 19713,
United States

T: +1-845-579-5705

Americas

Future Market Insights, Inc.

616 Corporate Way, Suite 2-9018,
Valley Cottage, NY 10989, United States

T: +1-347-918-3531

MEA

Future Market Insights

1602-6 Jumeirah Bay X2 Tower, Plot No: JLT-PH2-X2A,
Jumeirah Lakes Towers, Dubai,
United Arab Emirates

Europe

Future Market Insights

3rd Floor, 207 Regent Street,
W1B 3HH London
United Kingdom

T: + 44 (0) 20 8123 9659
D: +44 (0) 20 3287 4268

Asia Pacific

Future Market Insights

IndiaLand Global Tech Park, Unit UG-1, Behind Grand HighStreet, Phase 1, Hinjawadi, MH, Pune – 411057, India

The Insider’s Guide to Commercial Charbroiler Market Dynamics (2023 to 2033)

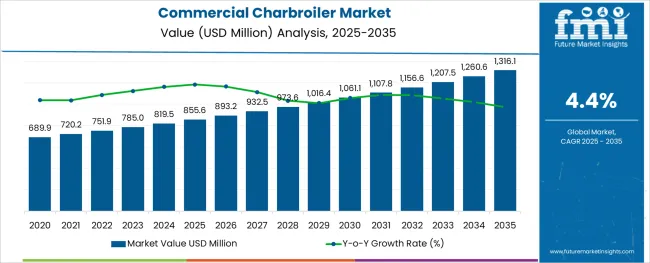
During the forecast period, the global commercial charbroiler market is expected to grow at a modest speed of 4.6% CAGR. In 2023, the market is currently valued at $785 million. The commercial charbroiler market is expected to hit a peak of US$ 1,230 million by 2033. Future Market Insights researchers observed a historical market valuation of US$ 750 million for the particular market during the base year when the market grew at a CAGR of 4.4%. This expansion is facilitated by the following factors:

  • Commercial charbroilers are a promising substitute since they minimize the duration it takes to cook a meal substantially.
  • Changing lifestyles coupled with the rising trend of adoption of high-quality equipment for home and outdoor cooking activities.
  • There is a huge demand for energy-efficient and accredited kitchen equipment.
  • The requirement for contemporary and highly efficient infrared-based commercial charbroilers is increasing.
  • Quick-service restaurants (QSRs) are becoming increasingly popular among young people, as is the practice of cookouts on weekends and holidays.
  • There is a growing demand for small-sized and portable charbroilers since they are easy to use and transport for outdoor activities such as camping, road excursions, and other adventures.
  • Grilled cuisine is becoming increasingly popular, particularly among people who eat meat.
  • Preference for charbroiled fast foods like burgers and sandwiches with charbroiled patties among consumers is increasing rapidly.
  • While some restaurant owners are increasing their food menus to include charbroiled cuisine, other culinary establishments are expanding both domestically and globally.
  • The growth in the number of food service establishments selling charbroiled meals directly correlates to an increase in the demand for commercial charbroilers.
  • Manufacturers offer one to ten years of guarantee depending on the material of the charbroiler.

Although the industry is expanding rapidly, Future Market Insights analysts believe that some factors will slow down the expansion of the commercial charbroiler market during the forecast period. These restraining components are as follows:

  • Increase in the expense of market research and development.
  • The desire for equipment that is lightweight, cost-effective, and energy-efficient.
  • Despite the fact that grilled food has fewer fat and calories than fried food, it is linked to numerous potential health risks.
  • Deep-frying and grilling both generate advanced glycation end products, which can contribute to chronic diseases including heart disease, diabetes, and Alzheimer's.

Grilled foods are becoming increasingly popular among consumers in numerous nations, according to FMI research. The increased demand for charbroiled food has prompted numerous manufacturers to introduce innovative features in commercial charbroilers. Here are some trends and opportunities in the commercial charbroiler market:

  • Technological advances in charbroilers will enhance energy efficiency and lower carbon footprint, fueling the charbroiler market growth.
  • Commercial charbroilers with modern features include round rods to prevent grease and flare-ups, steel rods to decrease carbon buildup, and self-cleaning filtration systems with under-fired charbroilers to reduce grilled emissions.
  • Manufacturers are selling high-end commercial charbroilers with lifetime burner warranties.
  • Hotel and restaurant monopolists are focused on dedicated barbeque restaurant chains, which is likely to boost commercial charbroiler sales globally.
Report Attribute Details
Commercial Charbroiler Market Value (2023) US$ 785 Million
Commercial Charbroiler Market Anticipated Value (2033) US$ 1,230 Million
Commercial Charbroiler Market Projected Growth Rate (2023 to 2033) 4.6%
Commercial Charbroiler Market Historical Growth Rate (2017 to 2022) 4.4%

Don't pay for what you don't need

Customize your report by selecting specific countries or regions and save 30%!

Glimpse of the Historical Market Scenario and Current Growth Indicators

After conducting an in-depth market analysis, FMI specialists discovered that the commercial charbroiler market has experienced exceptional growth in recent years. The relevant market CAGR progressively climbed from 4.4% between 2017 and 2022 to 4.6% between 2023 and 2033.

A charbroiler is an excellent tool for imparting smokey and charred characteristics to steaks, poultry, fish, sandwiches, and vegetables. Most charbroilers are constructed of porcelain, enameled cast iron, or steel. Stainless steel is more durable and less expensive than other materials. This is why it is so popular. To entice customers, charbroiler manufacturers are now giving a variety of benefits. For example, depending on the material used for the grill, the manufacturer will provide a 1-10 year guarantee. A lifetime burner warranty is prevalent on high-end grills. Vintage, a premium accessory and electric grill company located in the USA, offers a lifetime guarantee on selected accessories and burners.

The advent of the electric charbroiler changed the market and paved the path for new opportunities. If the gas utility line is not accessible to heat the meal, electric charbroilers are a viable alternative. Individuals who do not have access to natural gas or electricity can cook using an alternate fuel source. The expanding number of restaurants and hotels, as well as trekking and camping activities, have contributed to commercial charbroiler's substantial market share. Furthermore, the growing number of BBQ restaurants in emerging economies such as Japan, India, Mexico, and Brazil is fueling the expansion of the commercial charbroiler industry. Furthermore, as the popularity of backyard gatherings, home-cooked BBQ cuisine, tiny tops, and portable commercial charbroilers grow, homes throughout the world are embracing charbroilers.

Comparative Analysis of Adjacent Markets

Commercial Charbroiler Market:

Differentiating Aspects Commercial Charbroiler Market
CAGR 4.6%
Market Valuation in 2023 US$ 785 Million
Projected Market Value in 2033 US$ 1,230 Million
Driver
  • Increased demand for commercial charbroilers is directly proportional to the rise in the number of food service outlets providing charbroiled meals.
  • Grilled food is growing increasingly popular, especially among meat eaters.
  • Changing lifestyles, along with an increase in the use of high-quality equipment for home and outdoor cooking.

Ceramic Barbeque Grill Market:

Differentiating Aspects Ceramic Barbeque Grill Market
CAGR 4.5%
Market Valuation in 2023 US$ 951.79 Million
Projected Market Value in 2033 US$ 1,478.09 Million
Driver
  • The growing popularity of outdoor leisure activities will drive demand for ceramic barbecue grills.
  • The establishment of new pubs, restaurants, and fast-food restaurants, as well as the different health benefits of food cooked in grills, are expected to drive increased sales of Ceramic Barbeque Grills.
  • End-user demand for lightweight, long-lasting cooking equipment is projected to encourage the increase in demand for Ceramic Barbeque Grills.

Electric Grills Market:

Differentiating Aspects Electric Grills Market
CAGR 5.5%
Market Valuation in 2023 US$ 4.64 Billion
Projected Market Value in 2033 US$ 7.93 Billion
Driver
  • Due to increased environmental sustainability concerns, individuals are preferring electric grills over charcoal barbecues.
  • Grilled meals are getting increasingly popular as a consequence, which is a growing demand for electric grill ownership internationally.
  • Electrical grills offer an evenly heated surface, making grilling easier and assisting in the uniform heating of food.
  • This electric equipment can accurately regulate and maintain temperature, making them safe to use.
Nandini Roy Choudhury

Principal Consultant

Talk to Analyst

Find your sweet spots for generating winning opportunities in this market.

Category-wise Insights

Dominant Segments Taking Center Stage Amid Consumer Needs

Electric - By Power Type

On the basis of power type, the commercial charbroiler market is categorized into electric, gas, and charcoal. Among these categories, the electric segment holds the most significant market share as it is the most preferred product by customers. Currently, the electric category is expected to grow at a moderate rate, with a CAGR of 4.9%. During the base period of 2017 to 2022, the segment accounted for the same historical CAGR. The following factors have contributed to the constant progress of electric commercial charbroil:

  • The use of renewable energy sources, such as solar panels, which customers are installing in their homes to lower power prices.
  • They produce far less smoke and cause significantly less pollution.
  • Their ability to be utilized indoors, smoke-free grilling, preference for healthy grilled food, and preference for handmade grilled food.
  • Home cooking is becoming increasingly popular as a hobby and leisure activity.

Commercial - By Buyer Type

Depending on the buyer type, the commercial charbroiler market is bifurcated into household and commercial.

According to FMI, the commercial category holds the largest market share in the global commercial charbroiler market. This category is now growing at a substantial rate, with a CAGR of 4.6%. Historically, the category accounted for a 4.3% CAGR from 2017 to 2022. The following factors are contributing to the growth of this segment:
  • The growing popularity of BBQ restaurants among developing-country customers is expected to boost category growth.
  • A rising number of trekking and camping activities.

Country-wise Insights

The Growing Popularity of Weekend Barbeque Parties Fuels the USA Commercial Charbroiler Market

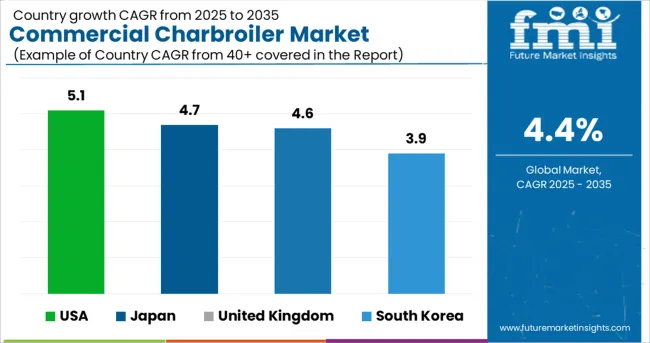
With significant demand for commercial charbroilers, North America dominates the industry. The USA continues to dominate the commercial charbroilers market in North America and has registered a market valuation of US$ 119.1 million in 2023 which is further expected to reach US$ 307.5 million by 2033. This trend is projected to continue during the projection period. The USA Commercial Charbroiler market recorded a CAGR of 5.0% during the historical and a CAGR of 5.1% during the forecast period respectively. The development of new technology has aided in the development of charbroilers, which are reported to be more efficient and modern than traditional grills used to prepare meals.

According to studies, about 85% of families in the USA own a grill, and the majority of owners utilize it all year. Friends and family congregate around the barbecue for holidays, birthdays, occasions, or for no reason at all. American barbecue is a staple of everyday life, whether for large groups or intimate gatherings of one, with meat, poultry, pork, or vegetables. Cookouts are also popular in the USA around national holidays such as Thanksgiving, Independence Day, Christmas, and New Year's Eve. Over 50% of customers in this country like barbecue for birthday celebrations, and 25% love it on camping vacations. Businesses are investing in new product development to increase their income in this expanding sector.

Opening with Charbroiler Forerunners, the United Kingdom Swiftly Acquired a Taste for Grilled Cuisine

Europe has been discovered to have a substantial market share in the commercial charbroiler market. The United Kingdom is now the top country in this area, accounting for a market size of US$ 26.70 million in 2023, growing at a moderate-paced CAGR of 4.6%. Earlier, the UK commercial charbroiler market increased at a CAGR of 4.4% throughout the historical period. By 2033, the market valuation is estimated to exceed US$ 73.80 million.

BBQ & at-home dining & entertaining has become the UK's No. 1 summer home leisure activity, with three out of every four families having some sort of charbroiler as a result of the Covid-19 lockdown. Despite not being a member of the EU, the United Kingdom overtook Germany as the leading BBQ nation in 2021. It should come as no surprise that gas BBQs are the most popular form of barbecue in the UK. Gas charbroilers grab the top rank due to their efficiency, ease of use, and ability to cook the ideal burger, leaving electric BBQs in last place.

Wagyu Yakiniku Ichiro is a Popular Japanese Dish that Necessitates the Use of a Commercial Charbroiler

Japan is also predicted to develop rapidly as a result of rising street food consumption and large expenditures by key firms. Furthermore, increased demand for barbecue goods over hot dogs, burgers, and pizza is expected to drive the growth of the Japanese commercial charbroiler market during the forecast period. Japan is expected to grow at a gradual rate, with a CAGR of 4.7% during the projection period, up from 4.4% during the historical period. In 2023, the country has a market worth US$ 33.27 million. According to FMI, the worth will exceed US$ 89.79 million by the end of 2033.

Yakiniku, or grilled-meat restaurants, are popular in Japan, where customers prepare raw materials including beef shoulder, hog belly, and vegetables at the table. As a result, the requirement for portable commercial charbroilers rises. Furthermore, new restaurants specializing in grilling are sprouting in Japan, increasing the use of commercial charbroilers. With the introduction of Wagyu Yakiniku Ichiro in Japan, a whimsical, trend-setting new 'yakiniku' barbecue grill brand was introduced, replete with distinctive 'Shinkansen bullet train' service to table grills.

Korean Grilled Food is a Growing Homemade Food Trend that Demands Charbroilers

The South Korean commercial charbroiler market is expected to grow at a sluggish-paced CAGR of 3.9% over the projected period, up from 3.5% in the preceding season. In 2023, the market is currently valued at US$ 12.435 million. FMI researchers forecast a market value of US$ 43.05 million by 2033.

Korean barbecue is a menu trend that is here to stay. The delivery of independent and smaller chain restaurants has expanded and continues to develop. K-BBQ, which comes in sweet and sour and sweet and savory flavors and is generally distributed by broad-line distributors to Asian-casual dining and bar & grill restaurants, lends itself to a range of meals such as burgers, jerky, and tacos. These factors contribute to restaurants' increasing adoption of commercial charbroilers. Furthermore, instead of a massive heavy-duty device on wheels, the grill is normally tabletop in size. As a result, it is an indoor practice, much like in Japan. This, in turn, increases the adoption of portable and electric commercial charbroilers.

Get the data you need at a Fraction of the cost

Personalize your report by choosing insights you need
and save 40%!

Leading Startups to Keep an Eye on

Start-up Ecosystem:

New Entrants Give the Commercial Charbroil Market a Competitive Advantage

New players in the rice processing machine market are capitalizing on technological improvements to offer new products and acquire a competitive edge. These companies are always investing in research and development to stay up with changing customer tastes and end-use industry demands. Efforts are being made to boost their position in the forum and help the commercial charbroiler industry flourish.

Start-up Company Spark Grills
Country United States of America
Description Spark Grills include a revolutionary wood and charcoal barbeque system, which makes loading and rapid lighting easy, smooth, and mess-free. Spark is a sleek charbroiler that lights up in seconds and features oven-like temperature control, allowing grilling fans and home cooks alike to unleash their culinary prowess. It also sells accessories such as grill covers, temperature sensors, cutting boards, and so forth. The firm also has a social effect by assisting local families and communities with their financial health.
Start-up Company June
Country United States of America
Description June is the first brand to provide smart top ovens on the Internet. Sensors in the oven detect the weight and automatically set the temperature. Its app includes functions such as intelligent notifications, video monitoring, and food planning. Android and iOS users can download the mobile app.

Competitive Landscape

Endeavors by Key Players to Bring Revolution in Market Dynamics

Prominent competitors in the commercial charbroiler market are focused on evolving the newest technology and implementing new features, such as temperature sensor technology, into their grill products. Major players in the commercial charbroiler market focus on product launch strategies that are driven by ingenuity. The incorporation of various technologies into domestic electric grills is advancing the manufacture of novel culinary goods in response to consumer demand for convenience. Manufacturers are extensively spending on research and development operations in order to create technological breakthroughs in machinery and gain a larger portion of the global market.

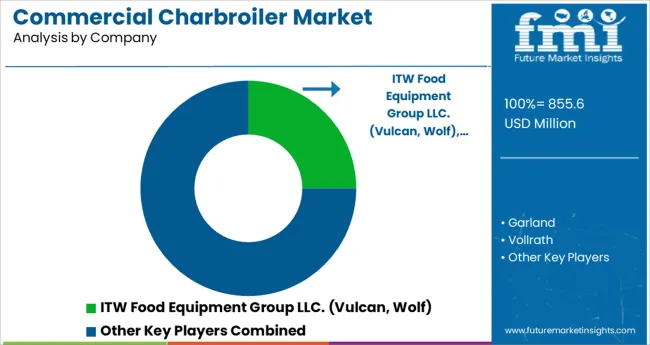
ITW Food Equipment Group LLC. Heats Things Up in the Global Forum

ITW Food Equipment Group LLC. is a prominent player in the total commercial charbroil market and has seized the lead in both the present and future predictions. The goal of this company is to produce food equipment that food service and food retail professionals can rely on to work hard and give quality, consistent results day in and day out, allowing them to focus on what they love most-creating great food for wonderful people.

Garland Expands its Presence by Receiving Several Awards

Garland has spent the last 140 years working directly with our clients, partnering on practical, effective, and long-lasting solutions that assist to bring their passion to the surface every day. The firm worked hard to win their trust, innovating and adapting regularly to keep up with our ever-changing industry. From ranges and clamshell grills to whole island suites, the organization has cooperated on several advances to meet the different demands of our consumers. Nonetheless, they have all been founded on the same underlying goal of practical application, developed from true necessity to address the real issues that an organization faces.

Avantco Equipment Fires up the Market with their Unique Offerings

Avantco commercial charbroilers are ideal for bustling businesses that have limited space. The long-lasting stainless steel design and strong burners let you swiftly produce chicken, burgers, steaks, and veggie meals with the convenience and efficiency that you need. Avantco charbroilers use a radiant heat source for uniform cooking and precision heat distribution.

Recent Developments:

In April 2022, Avantco released the Chef Series CAG-36-RC 36" Gas Countertop Radiant Charbroiler with 90,000 BTU. Because each burner can be adjusted to a different temperature, it is great for cooking burgers, prawns, or veggie skewers. This charbroiler employs radiants to reflect heat onto the cooking surface, guaranteeing speedy recovery and convenient heat retention.

In May 2022, Clark Associates topped Foodservice Equipment & Supplies magazine's list of 2022 Distribution Giants for the second year in a straight, cementing its position as the nation's premier supplier.

In August 2021, Garland introduced additional time-saving features to its Cuisine Series® heavy-duty oven and burner system, which is trusted and market-leading. The Cuisine Series, built on a 36" chassis, has long blended durability and careful design to satisfy the needs of high-performance kitchens. Garland has now implemented a number of new features to give faster results and even greater simplicity of use.

Some of the other key companies proliferating in the market are

Key Segments in the Commercial Charbroiler Market

By Power Type:

  • Electric
  • Gas
  • Charcoal

By Buyer Type:

  • Household
  • Commercial

By Sales Channel:

  • Direct Procurement
  • Distributor Sales
  • E-commerce Platforms
  • Others

By Region:

  • North America
  • Latin America
  • Europe
  • East Asia
  • Middle East and Africa (MEA)
  • Oceania
  • South Asia and ASEAN

Frequently Asked Questions

What is the Growth Outlook for the Commercial Charbroiler Market?

The growth outlook for the commercial charbroiler market is predicted to advance at a CAGR of 4.6% from 2023 to 2033.

Which Country Leads the Commercial Charbroiler Market?

The United States is anticipated to lead the commercial charbroiler market during the forecast period.

How much Growth Potential does Commercial Charbroiler hold?

The commercial charbroiler market is likely to hold a valuation of US$ 1230 Million by 2033.

Table of Content

1. Executive Summary | Commercial Charbroiler Market

    1.1. Global Market Outlook

    1.2. Demand-side Trends

    1.3. Supply-side Trends

    1.4. Technology Roadmap Analysis

    1.5. Analysis and Recommendations

2. Market Overview

    2.1. Market Coverage / Taxonomy

    2.2. Market Definition / Scope / Limitations

3. Market Background

    3.1. Market Dynamics

        3.1.1. Drivers

        3.1.2. Restraints

        3.1.3. Opportunity

        3.1.4. Trends

    3.2. Scenario Forecast

        3.2.1. Demand in Optimistic Scenario

        3.2.2. Demand in Likely Scenario

        3.2.3. Demand in Conservative Scenario

    3.3. Opportunity Map Analysis

    3.4. Product Life Cycle Analysis

    3.5. Supply Chain Analysis

        3.5.1. Supply Side Participants and their Roles

            3.5.1.1. Producers

            3.5.1.2. Mid-Level Participants (Traders/ Agents/ Brokers)

            3.5.1.3. Wholesalers and Distributors

        3.5.2. Value Added and Value Created at Node in the Supply Chain

        3.5.3. List of Raw Material Suppliers

        3.5.4. List of Existing and Potential Buyers

    3.6. Investment Feasibility Matrix

    3.7. Value Chain Analysis

        3.7.1. Profit Margin Analysis

        3.7.2. Wholesalers and Distributors

        3.7.3. Retailers

    3.8. PESTLE and Porter’s Analysis

    3.9. Regulatory Landscape

        3.9.1. By Key Regions

        3.9.2. By Key Countries

    3.10. Regional Parent Market Outlook

    3.11. Production and Consumption Statistics

    3.12. Import and Export Statistics

4. Global Market Analysis 2018 to 2022 and Forecast, 2023 to 2033

    4.1. Historical Market Size Value (US$ Million) & Volume (Units) Analysis, 2018 to 2022

    4.2. Current and Future Market Size Value (US$ Million) & Volume (Units) Projections, 2023 to 2033

        4.2.1. Y-o-Y Growth Trend Analysis

        4.2.2. Absolute $ Opportunity Analysis

5. Global Market Analysis 2018 to 2022 and Forecast 2023 to 2033, By Power Type

    5.1. Introduction / Key Findings

    5.2. Historical Market Size Value (US$ Million) & Volume (Units) Analysis By Power Type, 2018 to 2022

    5.3. Current and Future Market Size Value (US$ Million) & Volume (Units) Analysis and Forecast By Power Type, 2023 to 2033

        5.3.1. Electric

        5.3.2. Gas

        5.3.3. Charcoal

    5.4. Y-o-Y Growth Trend Analysis By Power Type, 2018 to 2022

    5.5. Absolute $ Opportunity Analysis By Power Type, 2023 to 2033

6. Global Market Analysis 2018 to 2022 and Forecast 2023 to 2033, By Buyer Type

    6.1. Introduction / Key Findings

    6.2. Historical Market Size Value (US$ Million) & Volume (Units) Analysis By Buyer Type, 2018 to 2022

    6.3. Current and Future Market Size Value (US$ Million) & Volume (Units) Analysis and Forecast By Buyer Type, 2023 to 2033

        6.3.1. Household

        6.3.2. Commerical

    6.4. Y-o-Y Growth Trend Analysis By Buyer Type, 2018 to 2022

    6.5. Absolute $ Opportunity Analysis By Buyer Type, 2023 to 2033

7. Global Market Analysis 2018 to 2022 and Forecast 2023 to 2033, By Sales Channel

    7.1. Introduction / Key Findings

    7.2. Historical Market Size Value (US$ Million) & Volume (Units) Analysis By Sales Channel, 2018 to 2022

    7.3. Current and Future Market Size Value (US$ Million) & Volume (Units) Analysis and Forecast By Sales Channel, 2023 to 2033

        7.3.1. Direct Procurement

        7.3.2. Distributor Sales

        7.3.3. eCommerce Platforms

        7.3.4. Others

    7.4. Y-o-Y Growth Trend Analysis By Sales Channel, 2018 to 2022

    7.5. Absolute $ Opportunity Analysis By Sales Channel, 2023 to 2033

8. Global Market Analysis 2018 to 2022 and Forecast 2023 to 2033, By Region

    8.1. Introduction

    8.2. Historical Market Size Value (US$ Million) & Volume (Units) Analysis By Region, 2018 to 2022

    8.3. Current Market Size Value (US$ Million) & Volume (Units) Analysis and Forecast By Region, 2023 to 2033

        8.3.1. North America

        8.3.2. Latin America

        8.3.3. Europe

        8.3.4. East Asia

        8.3.5. Middle East and Africa (MEA)

        8.3.6. Oceania

        8.3.7. South Asia and ASEAN

    8.4. Market Attractiveness Analysis By Region

9. North America Market Analysis 2018 to 2022 and Forecast 2023 to 2033, By Country

    9.1. Historical Market Size Value (US$ Million) & Volume (Units) Trend Analysis By Market Taxonomy, 2018 to 2022

    9.2. Market Size Value (US$ Million) & Volume (Units) Forecast By Market Taxonomy, 2023 to 2033

        9.2.1. By Country

            9.2.1.1. United States of America

            9.2.1.2. Canada

        9.2.2. By Power Type

        9.2.3. By Buyer Type

        9.2.4. By Sales Channel

    9.3. Market Attractiveness Analysis

        9.3.1. By Country

        9.3.2. By Power Type

        9.3.3. By Buyer Type

        9.3.4. By Sales Channel

    9.4. Key Takeaways

10. Latin America Market Analysis 2018 to 2022 and Forecast 2023 to 2033, By Country

    10.1. Historical Market Size Value (US$ Million) & Volume (Units) Trend Analysis By Market Taxonomy, 2018 to 2022

    10.2. Market Size Value (US$ Million) & Volume (Units) Forecast By Market Taxonomy, 2023 to 2033

        10.2.1. By Country

            10.2.1.1. Brazil

            10.2.1.2. Mexico

            10.2.1.3. Rest of Latin America

        10.2.2. By Power Type

        10.2.3. By Buyer Type

        10.2.4. By Sales Channel

    10.3. Market Attractiveness Analysis

        10.3.1. By Country

        10.3.2. By Power Type

        10.3.3. By Buyer Type

        10.3.4. By Sales Channel

    10.4. Key Takeaways

11. Europe Market Analysis 2018 to 2022 and Forecast 2023 to 2033, By Country

    11.1. Historical Market Size Value (US$ Million) & Volume (Units) Trend Analysis By Market Taxonomy, 2018 to 2022

    11.2. Market Size Value (US$ Million) & Volume (Units) Forecast By Market Taxonomy, 2023 to 2033

        11.2.1. By Country

            11.2.1.1. Germany

            11.2.1.2. United Kingdom

            11.2.1.3. France

            11.2.1.4. Spain

            11.2.1.5. Italy

            11.2.1.6. Rest of Europe

        11.2.2. By Power Type

        11.2.3. By Buyer Type

        11.2.4. By Sales Channel

    11.3. Market Attractiveness Analysis

        11.3.1. By Country

        11.3.2. By Power Type

        11.3.3. By Buyer Type

        11.3.4. By Sales Channel

    11.4. Key Takeaways

12. East Asia Market Analysis 2018 to 2022 and Forecast 2023 to 2033, By Country

    12.1. Historical Market Size Value (US$ Million) & Volume (Units) Trend Analysis By Market Taxonomy, 2018 to 2022

    12.2. Market Size Value (US$ Million) & Volume (Units) Forecast By Market Taxonomy, 2023 to 2033

        12.2.1. By Country

            12.2.1.1. China

            12.2.1.2. Japan

            12.2.1.3. South Korea

        12.2.2. By Power Type

        12.2.3. By Buyer Type

        12.2.4. By Sales Channel

    12.3. Market Attractiveness Analysis

        12.3.1. By Country

        12.3.2. By Power Type

        12.3.3. By Buyer Type

        12.3.4. By Sales Channel

    12.4. Key Takeaways

13. MEA Market Analysis 2018 to 2022 and Forecast 2023 to 2033, By Country

    13.1. Historical Market Size Value (US$ Million) & Volume (Units) Trend Analysis By Market Taxonomy, 2018 to 2022

    13.2. Market Size Value (US$ Million) & Volume (Units) Forecast By Market Taxonomy, 2023 to 2033

        13.2.1. By Country

            13.2.1.1. GCC Countries

            13.2.1.2. South Africa

            13.2.1.3. Israel

            13.2.1.4. Rest of MEA

        13.2.2. By Power Type

        13.2.3. By Buyer Type

        13.2.4. By Sales Channel

    13.3. Market Attractiveness Analysis

        13.3.1. By Country

        13.3.2. By Power Type

        13.3.3. By Buyer Type

        13.3.4. By Sales Channel

    13.4. Key Takeaways

14. Oceania Market Analysis 2018 to 2022 and Forecast 2023 to 2033, By Country

    14.1. Historical Market Size Value (US$ Million) & Volume (Units) Trend Analysis By Market Taxonomy, 2018 to 2022

    14.2. Market Size Value (US$ Million) & Volume (Units) Forecast By Market Taxonomy, 2023 to 2033

        14.2.1. By Country

            14.2.1.1. Australia

            14.2.1.2. New Zealand

        14.2.2. By Power Type

        14.2.3. By Buyer Type

        14.2.4. By Sales Channel

    14.3. Market Attractiveness Analysis

        14.3.1. By Country

        14.3.2. By Power Type

        14.3.3. By Buyer Type

        14.3.4. By Sales Channel

    14.4. Key Takeaways

15. South Asia and ASEAN Market Analysis 2018 to 2022 and Forecast 2023 to 2033, By Country

    15.1. Historical Market Size Value (US$ Million) & Volume (Units) Trend Analysis By Market Taxonomy, 2018 to 2022

    15.2. Market Size Value (US$ Million) & Volume (Units) Forecast By Market Taxonomy, 2023 to 2033

        15.2.1. By Country

            15.2.1.1. Malaysia

            15.2.1.2. India

            15.2.1.3. Thailand

            15.2.1.4. Singapore

            15.2.1.5. Rest of South Asia and ASEAN

        15.2.2. By Power Type

        15.2.3. By Buyer Type

        15.2.4. By Sales Channel

    15.3. Market Attractiveness Analysis

        15.3.1. By Country

        15.3.2. By Power Type

        15.3.3. By Buyer Type

        15.3.4. By Sales Channel

    15.4. Key Takeaways

16. Key Countries Market Analysis

    16.1. United States of America

        16.1.1. Pricing Analysis

        16.1.2. Market Share Analysis, 2022

            16.1.2.1. By Power Type

            16.1.2.2. By Buyer Type

            16.1.2.3. By Sales Channel

    16.2. Canada

        16.2.1. Pricing Analysis

        16.2.2. Market Share Analysis, 2022

            16.2.2.1. By Power Type

            16.2.2.2. By Buyer Type

            16.2.2.3. By Sales Channel

    16.3. Brazil

        16.3.1. Pricing Analysis

        16.3.2. Market Share Analysis, 2022

            16.3.2.1. By Power Type

            16.3.2.2. By Buyer Type

            16.3.2.3. By Sales Channel

    16.4. Mexico

        16.4.1. Pricing Analysis

        16.4.2. Market Share Analysis, 2022

            16.4.2.1. By Power Type

            16.4.2.2. By Buyer Type

            16.4.2.3. By Sales Channel

    16.5. Germany

        16.5.1. Pricing Analysis

        16.5.2. Market Share Analysis, 2022

            16.5.2.1. By Power Type

            16.5.2.2. By Buyer Type

            16.5.2.3. By Sales Channel

    16.6. United Kingdom

        16.6.1. Pricing Analysis

        16.6.2. Market Share Analysis, 2022

            16.6.2.1. By Power Type

            16.6.2.2. By Buyer Type

            16.6.2.3. By Sales Channel

    16.7. France

        16.7.1. Pricing Analysis

        16.7.2. Market Share Analysis, 2022

            16.7.2.1. By Power Type

            16.7.2.2. By Buyer Type

            16.7.2.3. By Sales Channel

    16.8. Spain

        16.8.1. Pricing Analysis

        16.8.2. Market Share Analysis, 2022

            16.8.2.1. By Power Type

            16.8.2.2. By Buyer Type

            16.8.2.3. By Sales Channel

    16.9. Italy

        16.9.1. Pricing Analysis

        16.9.2. Market Share Analysis, 2022

            16.9.2.1. By Power Type

            16.9.2.2. By Buyer Type

            16.9.2.3. By Sales Channel

    16.10. China

        16.10.1. Pricing Analysis

        16.10.2. Market Share Analysis, 2022

            16.10.2.1. By Power Type

            16.10.2.2. By Buyer Type

            16.10.2.3. By Sales Channel

    16.11. Japan

        16.11.1. Pricing Analysis

        16.11.2. Market Share Analysis, 2022

            16.11.2.1. By Power Type

            16.11.2.2. By Buyer Type

            16.11.2.3. By Sales Channel

    16.12. South Korea

        16.12.1. Pricing Analysis

        16.12.2. Market Share Analysis, 2022

            16.12.2.1. By Power Type

            16.12.2.2. By Buyer Type

            16.12.2.3. By Sales Channel

    16.13. GCC Countries

        16.13.1. Pricing Analysis

        16.13.2. Market Share Analysis, 2022

            16.13.2.1. By Power Type

            16.13.2.2. By Buyer Type

            16.13.2.3. By Sales Channel

    16.14. South Africa

        16.14.1. Pricing Analysis

        16.14.2. Market Share Analysis, 2022

            16.14.2.1. By Power Type

            16.14.2.2. By Buyer Type

            16.14.2.3. By Sales Channel

    16.15. Israel

        16.15.1. Pricing Analysis

        16.15.2. Market Share Analysis, 2022

            16.15.2.1. By Power Type

            16.15.2.2. By Buyer Type

            16.15.2.3. By Sales Channel

    16.16. Australia

        16.16.1. Pricing Analysis

        16.16.2. Market Share Analysis, 2022

            16.16.2.1. By Power Type

            16.16.2.2. By Buyer Type

            16.16.2.3. By Sales Channel

    16.17. New Zealand

        16.17.1. Pricing Analysis

        16.17.2. Market Share Analysis, 2022

            16.17.2.1. By Power Type

            16.17.2.2. By Buyer Type

            16.17.2.3. By Sales Channel

    16.18. Malaysia

        16.18.1. Pricing Analysis

        16.18.2. Market Share Analysis, 2022

            16.18.2.1. By Power Type

            16.18.2.2. By Buyer Type

            16.18.2.3. By Sales Channel

    16.19. India

        16.19.1. Pricing Analysis

        16.19.2. Market Share Analysis, 2022

            16.19.2.1. By Power Type

            16.19.2.2. By Buyer Type

            16.19.2.3. By Sales Channel

    16.20. Thailand

        16.20.1. Pricing Analysis

        16.20.2. Market Share Analysis, 2022

            16.20.2.1. By Power Type

            16.20.2.2. By Buyer Type

            16.20.2.3. By Sales Channel

    16.21. Singapore

        16.21.1. Pricing Analysis

        16.21.2. Market Share Analysis, 2022

            16.21.2.1. By Power Type

            16.21.2.2. By Buyer Type

            16.21.2.3. By Sales Channel

17. Market Structure Analysis

    17.1. Competition Dashboard

    17.2. Competition Benchmarking

    17.3. Market Share Analysis of Top Players

        17.3.1. By Regional

        17.3.2. By Power Type

        17.3.3. By Buyer Type

        17.3.4. By Sales Channel

18. Competition Analysis

    18.1. Competition Deep Dive

        18.1.1. ITW Food Equipment Group LLC. (Vulcan, Wolf)

            18.1.1.1. Overview

            18.1.1.2. Product Portfolio

            18.1.1.3. Profitability by Market Segments

            18.1.1.4. Sales Footprint

            18.1.1.5. Strategy Overview

                18.1.1.5.1. Marketing Strategy

                18.1.1.5.2. Product Strategy

                18.1.1.5.3. Channel Strategy

        18.1.2. Garland

            18.1.2.1. Overview

            18.1.2.2. Product Portfolio

            18.1.2.3. Profitability by Market Segments

            18.1.2.4. Sales Footprint

            18.1.2.5. Strategy Overview

                18.1.2.5.1. Marketing Strategy

                18.1.2.5.2. Product Strategy

                18.1.2.5.3. Channel Strategy

        18.1.3. Vollrath

            18.1.3.1. Overview

            18.1.3.2. Product Portfolio

            18.1.3.3. Profitability by Market Segments

            18.1.3.4. Sales Footprint

            18.1.3.5. Strategy Overview

                18.1.3.5.1. Marketing Strategy

                18.1.3.5.2. Product Strategy

                18.1.3.5.3. Channel Strategy

        18.1.4. Wells

            18.1.4.1. Overview

            18.1.4.2. Product Portfolio

            18.1.4.3. Profitability by Market Segments

            18.1.4.4. Sales Footprint

            18.1.4.5. Strategy Overview

                18.1.4.5.1. Marketing Strategy

                18.1.4.5.2. Product Strategy

                18.1.4.5.3. Channel Strategy

        18.1.5. Champion Tuff Grills

            18.1.5.1. Overview

            18.1.5.2. Product Portfolio

            18.1.5.3. Profitability by Market Segments

            18.1.5.4. Sales Footprint

            18.1.5.5. Strategy Overview

                18.1.5.5.1. Marketing Strategy

                18.1.5.5.2. Product Strategy

                18.1.5.5.3. Channel Strategy

        18.1.6. Avantco Equipment

            18.1.6.1. Overview

            18.1.6.2. Product Portfolio

            18.1.6.3. Profitability by Market Segments

            18.1.6.4. Sales Footprint

            18.1.6.5. Strategy Overview

                18.1.6.5.1. Marketing Strategy

                18.1.6.5.2. Product Strategy

                18.1.6.5.3. Channel Strategy

        18.1.7. Middleby (Bakers pride, imperial)

            18.1.7.1. Overview

            18.1.7.2. Product Portfolio

            18.1.7.3. Profitability by Market Segments

            18.1.7.4. Sales Footprint

            18.1.7.5. Strategy Overview

                18.1.7.5.1. Marketing Strategy

                18.1.7.5.2. Product Strategy

                18.1.7.5.3. Channel Strategy

        18.1.8. Clark Associates, Inc (Cooking Performance Group)

            18.1.8.1. Overview

            18.1.8.2. Product Portfolio

            18.1.8.3. Profitability by Market Segments

            18.1.8.4. Sales Footprint

            18.1.8.5. Strategy Overview

                18.1.8.5.1. Marketing Strategy

                18.1.8.5.2. Product Strategy

                18.1.8.5.3. Channel Strategy

        18.1.9. Dukers Appliance Co., USA Ltd

            18.1.9.1. Overview

            18.1.9.2. Product Portfolio

            18.1.9.3. Profitability by Market Segments

            18.1.9.4. Sales Footprint

            18.1.9.5. Strategy Overview

                18.1.9.5.1. Marketing Strategy

                18.1.9.5.2. Product Strategy

                18.1.9.5.3. Channel Strategy

19. Assumptions & Acronyms Used

20. Research Methodology

List of Tables

Table 1: Global Market Value (US$ Million) Forecast by Region, 2018 to 2033

Table 2: Global Market Volume (Units) Forecast by Region, 2018 to 2033

Table 3: Global Market Value (US$ Million) Forecast by Power Type, 2018 to 2033

Table 4: Global Market Volume (Units) Forecast by Power Type, 2018 to 2033

Table 5: Global Market Value (US$ Million) Forecast by Buyer Type, 2018 to 2033

Table 6: Global Market Volume (Units) Forecast by Buyer Type, 2018 to 2033

Table 7: Global Market Value (US$ Million) Forecast by Sales Channel, 2018 to 2033

Table 8: Global Market Volume (Units) Forecast by Sales Channel, 2018 to 2033

Table 9: North America Market Value (US$ Million) Forecast by Country, 2018 to 2033

Table 10: North America Market Volume (Units) Forecast by Country, 2018 to 2033

Table 11: North America Market Value (US$ Million) Forecast by Power Type, 2018 to 2033

Table 12: North America Market Volume (Units) Forecast by Power Type, 2018 to 2033

Table 13: North America Market Value (US$ Million) Forecast by Buyer Type, 2018 to 2033

Table 14: North America Market Volume (Units) Forecast by Buyer Type, 2018 to 2033

Table 15: North America Market Value (US$ Million) Forecast by Sales Channel, 2018 to 2033

Table 16: North America Market Volume (Units) Forecast by Sales Channel, 2018 to 2033

Table 17: Latin America Market Value (US$ Million) Forecast by Country, 2018 to 2033

Table 18: Latin America Market Volume (Units) Forecast by Country, 2018 to 2033

Table 19: Latin America Market Value (US$ Million) Forecast by Power Type, 2018 to 2033

Table 20: Latin America Market Volume (Units) Forecast by Power Type, 2018 to 2033

Table 21: Latin America Market Value (US$ Million) Forecast by Buyer Type, 2018 to 2033

Table 22: Latin America Market Volume (Units) Forecast by Buyer Type, 2018 to 2033

Table 23: Latin America Market Value (US$ Million) Forecast by Sales Channel, 2018 to 2033

Table 24: Latin America Market Volume (Units) Forecast by Sales Channel, 2018 to 2033

Table 25: Europe Market Value (US$ Million) Forecast by Country, 2018 to 2033

Table 26: Europe Market Volume (Units) Forecast by Country, 2018 to 2033

Table 27: Europe Market Value (US$ Million) Forecast by Power Type, 2018 to 2033

Table 28: Europe Market Volume (Units) Forecast by Power Type, 2018 to 2033

Table 29: Europe Market Value (US$ Million) Forecast by Buyer Type, 2018 to 2033

Table 30: Europe Market Volume (Units) Forecast by Buyer Type, 2018 to 2033

Table 31: Europe Market Value (US$ Million) Forecast by Sales Channel, 2018 to 2033

Table 32: Europe Market Volume (Units) Forecast by Sales Channel, 2018 to 2033

Table 33: East Asia Market Value (US$ Million) Forecast by Country, 2018 to 2033

Table 34: East Asia Market Volume (Units) Forecast by Country, 2018 to 2033

Table 35: East Asia Market Value (US$ Million) Forecast by Power Type, 2018 to 2033

Table 36: East Asia Market Volume (Units) Forecast by Power Type, 2018 to 2033

Table 37: East Asia Market Value (US$ Million) Forecast by Buyer Type, 2018 to 2033

Table 38: East Asia Market Volume (Units) Forecast by Buyer Type, 2018 to 2033

Table 39: East Asia Market Value (US$ Million) Forecast by Sales Channel, 2018 to 2033

Table 40: East Asia Market Volume (Units) Forecast by Sales Channel, 2018 to 2033

Table 41: MEA Market Value (US$ Million) Forecast by Country, 2018 to 2033

Table 42: MEA Market Volume (Units) Forecast by Country, 2018 to 2033

Table 43: MEA Market Value (US$ Million) Forecast by Power Type, 2018 to 2033

Table 44: MEA Market Volume (Units) Forecast by Power Type, 2018 to 2033

Table 45: MEA Market Value (US$ Million) Forecast by Buyer Type, 2018 to 2033

Table 46: MEA Market Volume (Units) Forecast by Buyer Type, 2018 to 2033

Table 47: MEA Market Value (US$ Million) Forecast by Sales Channel, 2018 to 2033

Table 48: MEA Market Volume (Units) Forecast by Sales Channel, 2018 to 2033

Table 49: Oceania Market Value (US$ Million) Forecast by Country, 2018 to 2033

Table 50: Oceania Market Volume (Units) Forecast by Country, 2018 to 2033

Table 51: Oceania Market Value (US$ Million) Forecast by Power Type, 2018 to 2033

Table 52: Oceania Market Volume (Units) Forecast by Power Type, 2018 to 2033

Table 53: Oceania Market Value (US$ Million) Forecast by Buyer Type, 2018 to 2033

Table 54: Oceania Market Volume (Units) Forecast by Buyer Type, 2018 to 2033

Table 55: Oceania Market Value (US$ Million) Forecast by Sales Channel, 2018 to 2033

Table 56: Oceania Market Volume (Units) Forecast by Sales Channel, 2018 to 2033

Table 57: South Asia and ASEAN Market Value (US$ Million) Forecast by Country, 2018 to 2033

Table 58: South Asia and ASEAN Market Volume (Units) Forecast by Country, 2018 to 2033

Table 59: South Asia and ASEAN Market Value (US$ Million) Forecast by Power Type, 2018 to 2033

Table 60: South Asia and ASEAN Market Volume (Units) Forecast by Power Type, 2018 to 2033

Table 61: South Asia and ASEAN Market Value (US$ Million) Forecast by Buyer Type, 2018 to 2033

Table 62: South Asia and ASEAN Market Volume (Units) Forecast by Buyer Type, 2018 to 2033

Table 63: South Asia and ASEAN Market Value (US$ Million) Forecast by Sales Channel, 2018 to 2033

Table 64: South Asia and ASEAN Market Volume (Units) Forecast by Sales Channel, 2018 to 2033

List of Charts

Figure 1: Global Market Value (US$ Million) by Power Type, 2023 to 2033

Figure 2: Global Market Value (US$ Million) by Buyer Type, 2023 to 2033

Figure 3: Global Market Value (US$ Million) by Sales Channel, 2023 to 2033

Figure 4: Global Market Value (US$ Million) by Region, 2023 to 2033

Figure 5: Global Market Value (US$ Million) Analysis by Region, 2018 to 2033

Figure 6: Global Market Volume (Units) Analysis by Region, 2018 to 2033

Figure 7: Global Market Value Share (%) and BPS Analysis by Region, 2023 to 2033

Figure 8: Global Market Y-o-Y Growth (%) Projections by Region, 2023 to 2033

Figure 9: Global Market Value (US$ Million) Analysis by Power Type, 2018 to 2033

Figure 10: Global Market Volume (Units) Analysis by Power Type, 2018 to 2033

Figure 11: Global Market Value Share (%) and BPS Analysis by Power Type, 2023 to 2033

Figure 12: Global Market Y-o-Y Growth (%) Projections by Power Type, 2023 to 2033

Figure 13: Global Market Value (US$ Million) Analysis by Buyer Type, 2018 to 2033

Figure 14: Global Market Volume (Units) Analysis by Buyer Type, 2018 to 2033

Figure 15: Global Market Value Share (%) and BPS Analysis by Buyer Type, 2023 to 2033

Figure 16: Global Market Y-o-Y Growth (%) Projections by Buyer Type, 2023 to 2033

Figure 17: Global Market Value (US$ Million) Analysis by Sales Channel, 2018 to 2033

Figure 18: Global Market Volume (Units) Analysis by Sales Channel, 2018 to 2033

Figure 19: Global Market Value Share (%) and BPS Analysis by Sales Channel, 2023 to 2033

Figure 20: Global Market Y-o-Y Growth (%) Projections by Sales Channel, 2023 to 2033

Figure 21: Global Market Attractiveness by Power Type, 2023 to 2033

Figure 22: Global Market Attractiveness by Buyer Type, 2023 to 2033

Figure 23: Global Market Attractiveness by Sales Channel, 2023 to 2033

Figure 24: Global Market Attractiveness by Region, 2023 to 2033

Figure 25: North America Market Value (US$ Million) by Power Type, 2023 to 2033

Figure 26: North America Market Value (US$ Million) by Buyer Type, 2023 to 2033

Figure 27: North America Market Value (US$ Million) by Sales Channel, 2023 to 2033

Figure 28: North America Market Value (US$ Million) by Country, 2023 to 2033

Figure 29: North America Market Value (US$ Million) Analysis by Country, 2018 to 2033

Figure 30: North America Market Volume (Units) Analysis by Country, 2018 to 2033

Figure 31: North America Market Value Share (%) and BPS Analysis by Country, 2023 to 2033

Figure 32: North America Market Y-o-Y Growth (%) Projections by Country, 2023 to 2033

Figure 33: North America Market Value (US$ Million) Analysis by Power Type, 2018 to 2033

Figure 34: North America Market Volume (Units) Analysis by Power Type, 2018 to 2033

Figure 35: North America Market Value Share (%) and BPS Analysis by Power Type, 2023 to 2033

Figure 36: North America Market Y-o-Y Growth (%) Projections by Power Type, 2023 to 2033

Figure 37: North America Market Value (US$ Million) Analysis by Buyer Type, 2018 to 2033

Figure 38: North America Market Volume (Units) Analysis by Buyer Type, 2018 to 2033

Figure 39: North America Market Value Share (%) and BPS Analysis by Buyer Type, 2023 to 2033

Figure 40: North America Market Y-o-Y Growth (%) Projections by Buyer Type, 2023 to 2033

Figure 41: North America Market Value (US$ Million) Analysis by Sales Channel, 2018 to 2033

Figure 42: North America Market Volume (Units) Analysis by Sales Channel, 2018 to 2033

Figure 43: North America Market Value Share (%) and BPS Analysis by Sales Channel, 2023 to 2033

Figure 44: North America Market Y-o-Y Growth (%) Projections by Sales Channel, 2023 to 2033

Figure 45: North America Market Attractiveness by Power Type, 2023 to 2033

Figure 46: North America Market Attractiveness by Buyer Type, 2023 to 2033

Figure 47: North America Market Attractiveness by Sales Channel, 2023 to 2033

Figure 48: North America Market Attractiveness by Country, 2023 to 2033

Figure 49: Latin America Market Value (US$ Million) by Power Type, 2023 to 2033

Figure 50: Latin America Market Value (US$ Million) by Buyer Type, 2023 to 2033

Figure 51: Latin America Market Value (US$ Million) by Sales Channel, 2023 to 2033

Figure 52: Latin America Market Value (US$ Million) by Country, 2023 to 2033

Figure 53: Latin America Market Value (US$ Million) Analysis by Country, 2018 to 2033

Figure 54: Latin America Market Volume (Units) Analysis by Country, 2018 to 2033

Figure 55: Latin America Market Value Share (%) and BPS Analysis by Country, 2023 to 2033

Figure 56: Latin America Market Y-o-Y Growth (%) Projections by Country, 2023 to 2033

Figure 57: Latin America Market Value (US$ Million) Analysis by Power Type, 2018 to 2033

Figure 58: Latin America Market Volume (Units) Analysis by Power Type, 2018 to 2033

Figure 59: Latin America Market Value Share (%) and BPS Analysis by Power Type, 2023 to 2033

Figure 60: Latin America Market Y-o-Y Growth (%) Projections by Power Type, 2023 to 2033

Figure 61: Latin America Market Value (US$ Million) Analysis by Buyer Type, 2018 to 2033

Figure 62: Latin America Market Volume (Units) Analysis by Buyer Type, 2018 to 2033

Figure 63: Latin America Market Value Share (%) and BPS Analysis by Buyer Type, 2023 to 2033

Figure 64: Latin America Market Y-o-Y Growth (%) Projections by Buyer Type, 2023 to 2033

Figure 65: Latin America Market Value (US$ Million) Analysis by Sales Channel, 2018 to 2033

Figure 66: Latin America Market Volume (Units) Analysis by Sales Channel, 2018 to 2033

Figure 67: Latin America Market Value Share (%) and BPS Analysis by Sales Channel, 2023 to 2033

Figure 68: Latin America Market Y-o-Y Growth (%) Projections by Sales Channel, 2023 to 2033

Figure 69: Latin America Market Attractiveness by Power Type, 2023 to 2033

Figure 70: Latin America Market Attractiveness by Buyer Type, 2023 to 2033

Figure 71: Latin America Market Attractiveness by Sales Channel, 2023 to 2033

Figure 72: Latin America Market Attractiveness by Country, 2023 to 2033

Figure 73: Europe Market Value (US$ Million) by Power Type, 2023 to 2033

Figure 74: Europe Market Value (US$ Million) by Buyer Type, 2023 to 2033

Figure 75: Europe Market Value (US$ Million) by Sales Channel, 2023 to 2033

Figure 76: Europe Market Value (US$ Million) by Country, 2023 to 2033

Figure 77: Europe Market Value (US$ Million) Analysis by Country, 2018 to 2033

Figure 78: Europe Market Volume (Units) Analysis by Country, 2018 to 2033

Figure 79: Europe Market Value Share (%) and BPS Analysis by Country, 2023 to 2033

Figure 80: Europe Market Y-o-Y Growth (%) Projections by Country, 2023 to 2033

Figure 81: Europe Market Value (US$ Million) Analysis by Power Type, 2018 to 2033

Figure 82: Europe Market Volume (Units) Analysis by Power Type, 2018 to 2033

Figure 83: Europe Market Value Share (%) and BPS Analysis by Power Type, 2023 to 2033

Figure 84: Europe Market Y-o-Y Growth (%) Projections by Power Type, 2023 to 2033

Figure 85: Europe Market Value (US$ Million) Analysis by Buyer Type, 2018 to 2033

Figure 86: Europe Market Volume (Units) Analysis by Buyer Type, 2018 to 2033

Figure 87: Europe Market Value Share (%) and BPS Analysis by Buyer Type, 2023 to 2033

Figure 88: Europe Market Y-o-Y Growth (%) Projections by Buyer Type, 2023 to 2033

Figure 89: Europe Market Value (US$ Million) Analysis by Sales Channel, 2018 to 2033

Figure 90: Europe Market Volume (Units) Analysis by Sales Channel, 2018 to 2033

Figure 91: Europe Market Value Share (%) and BPS Analysis by Sales Channel, 2023 to 2033

Figure 92: Europe Market Y-o-Y Growth (%) Projections by Sales Channel, 2023 to 2033

Figure 93: Europe Market Attractiveness by Power Type, 2023 to 2033

Figure 94: Europe Market Attractiveness by Buyer Type, 2023 to 2033

Figure 95: Europe Market Attractiveness by Sales Channel, 2023 to 2033

Figure 96: Europe Market Attractiveness by Country, 2023 to 2033

Figure 97: East Asia Market Value (US$ Million) by Power Type, 2023 to 2033

Figure 98: East Asia Market Value (US$ Million) by Buyer Type, 2023 to 2033

Figure 99: East Asia Market Value (US$ Million) by Sales Channel, 2023 to 2033

Figure 100: East Asia Market Value (US$ Million) by Country, 2023 to 2033

Figure 101: East Asia Market Value (US$ Million) Analysis by Country, 2018 to 2033

Figure 102: East Asia Market Volume (Units) Analysis by Country, 2018 to 2033

Figure 103: East Asia Market Value Share (%) and BPS Analysis by Country, 2023 to 2033

Figure 104: East Asia Market Y-o-Y Growth (%) Projections by Country, 2023 to 2033

Figure 105: East Asia Market Value (US$ Million) Analysis by Power Type, 2018 to 2033

Figure 106: East Asia Market Volume (Units) Analysis by Power Type, 2018 to 2033

Figure 107: East Asia Market Value Share (%) and BPS Analysis by Power Type, 2023 to 2033

Figure 108: East Asia Market Y-o-Y Growth (%) Projections by Power Type, 2023 to 2033

Figure 109: East Asia Market Value (US$ Million) Analysis by Buyer Type, 2018 to 2033

Figure 110: East Asia Market Volume (Units) Analysis by Buyer Type, 2018 to 2033

Figure 111: East Asia Market Value Share (%) and BPS Analysis by Buyer Type, 2023 to 2033

Figure 112: East Asia Market Y-o-Y Growth (%) Projections by Buyer Type, 2023 to 2033

Figure 113: East Asia Market Value (US$ Million) Analysis by Sales Channel, 2018 to 2033

Figure 114: East Asia Market Volume (Units) Analysis by Sales Channel, 2018 to 2033

Figure 115: East Asia Market Value Share (%) and BPS Analysis by Sales Channel, 2023 to 2033

Figure 116: East Asia Market Y-o-Y Growth (%) Projections by Sales Channel, 2023 to 2033

Figure 117: East Asia Market Attractiveness by Power Type, 2023 to 2033

Figure 118: East Asia Market Attractiveness by Buyer Type, 2023 to 2033

Figure 119: East Asia Market Attractiveness by Sales Channel, 2023 to 2033

Figure 120: East Asia Market Attractiveness by Country, 2023 to 2033

Figure 121: MEA Market Value (US$ Million) by Power Type, 2023 to 2033

Figure 122: MEA Market Value (US$ Million) by Buyer Type, 2023 to 2033

Figure 123: MEA Market Value (US$ Million) by Sales Channel, 2023 to 2033

Figure 124: MEA Market Value (US$ Million) by Country, 2023 to 2033

Figure 125: MEA Market Value (US$ Million) Analysis by Country, 2018 to 2033

Figure 126: MEA Market Volume (Units) Analysis by Country, 2018 to 2033

Figure 127: MEA Market Value Share (%) and BPS Analysis by Country, 2023 to 2033

Figure 128: MEA Market Y-o-Y Growth (%) Projections by Country, 2023 to 2033

Figure 129: MEA Market Value (US$ Million) Analysis by Power Type, 2018 to 2033

Figure 130: MEA Market Volume (Units) Analysis by Power Type, 2018 to 2033

Figure 131: MEA Market Value Share (%) and BPS Analysis by Power Type, 2023 to 2033

Figure 132: MEA Market Y-o-Y Growth (%) Projections by Power Type, 2023 to 2033

Figure 133: MEA Market Value (US$ Million) Analysis by Buyer Type, 2018 to 2033

Figure 134: MEA Market Volume (Units) Analysis by Buyer Type, 2018 to 2033

Figure 135: MEA Market Value Share (%) and BPS Analysis by Buyer Type, 2023 to 2033

Figure 136: MEA Market Y-o-Y Growth (%) Projections by Buyer Type, 2023 to 2033

Figure 137: MEA Market Value (US$ Million) Analysis by Sales Channel, 2018 to 2033

Figure 138: MEA Market Volume (Units) Analysis by Sales Channel, 2018 to 2033

Figure 139: MEA Market Value Share (%) and BPS Analysis by Sales Channel, 2023 to 2033

Figure 140: MEA Market Y-o-Y Growth (%) Projections by Sales Channel, 2023 to 2033

Figure 141: MEA Market Attractiveness by Power Type, 2023 to 2033

Figure 142: MEA Market Attractiveness by Buyer Type, 2023 to 2033

Figure 143: MEA Market Attractiveness by Sales Channel, 2023 to 2033

Figure 144: MEA Market Attractiveness by Country, 2023 to 2033

Figure 145: Oceania Market Value (US$ Million) by Power Type, 2023 to 2033

Figure 146: Oceania Market Value (US$ Million) by Buyer Type, 2023 to 2033

Figure 147: Oceania Market Value (US$ Million) by Sales Channel, 2023 to 2033

Figure 148: Oceania Market Value (US$ Million) by Country, 2023 to 2033

Figure 149: Oceania Market Value (US$ Million) Analysis by Country, 2018 to 2033

Figure 150: Oceania Market Volume (Units) Analysis by Country, 2018 to 2033

Figure 151: Oceania Market Value Share (%) and BPS Analysis by Country, 2023 to 2033

Figure 152: Oceania Market Y-o-Y Growth (%) Projections by Country, 2023 to 2033

Figure 153: Oceania Market Value (US$ Million) Analysis by Power Type, 2018 to 2033

Figure 154: Oceania Market Volume (Units) Analysis by Power Type, 2018 to 2033

Figure 155: Oceania Market Value Share (%) and BPS Analysis by Power Type, 2023 to 2033

Figure 156: Oceania Market Y-o-Y Growth (%) Projections by Power Type, 2023 to 2033

Figure 157: Oceania Market Value (US$ Million) Analysis by Buyer Type, 2018 to 2033

Figure 158: Oceania Market Volume (Units) Analysis by Buyer Type, 2018 to 2033

Figure 159: Oceania Market Value Share (%) and BPS Analysis by Buyer Type, 2023 to 2033

Figure 160: Oceania Market Y-o-Y Growth (%) Projections by Buyer Type, 2023 to 2033

Figure 161: Oceania Market Value (US$ Million) Analysis by Sales Channel, 2018 to 2033

Figure 162: Oceania Market Volume (Units) Analysis by Sales Channel, 2018 to 2033

Figure 163: Oceania Market Value Share (%) and BPS Analysis by Sales Channel, 2023 to 2033

Figure 164: Oceania Market Y-o-Y Growth (%) Projections by Sales Channel, 2023 to 2033

Figure 165: Oceania Market Attractiveness by Power Type, 2023 to 2033

Figure 166: Oceania Market Attractiveness by Buyer Type, 2023 to 2033

Figure 167: Oceania Market Attractiveness by Sales Channel, 2023 to 2033

Figure 168: Oceania Market Attractiveness by Country, 2023 to 2033

Figure 169: South Asia and ASEAN Market Value (US$ Million) by Power Type, 2023 to 2033

Figure 170: South Asia and ASEAN Market Value (US$ Million) by Buyer Type, 2023 to 2033

Figure 171: South Asia and ASEAN Market Value (US$ Million) by Sales Channel, 2023 to 2033

Figure 172: South Asia and ASEAN Market Value (US$ Million) by Country, 2023 to 2033

Figure 173: South Asia and ASEAN Market Value (US$ Million) Analysis by Country, 2018 to 2033

Figure 174: South Asia and ASEAN Market Volume (Units) Analysis by Country, 2018 to 2033

Figure 175: South Asia and ASEAN Market Value Share (%) and BPS Analysis by Country, 2023 to 2033

Figure 176: South Asia and ASEAN Market Y-o-Y Growth (%) Projections by Country, 2023 to 2033

Figure 177: South Asia and ASEAN Market Value (US$ Million) Analysis by Power Type, 2018 to 2033

Figure 178: South Asia and ASEAN Market Volume (Units) Analysis by Power Type, 2018 to 2033

Figure 179: South Asia and ASEAN Market Value Share (%) and BPS Analysis by Power Type, 2023 to 2033

Figure 180: South Asia and ASEAN Market Y-o-Y Growth (%) Projections by Power Type, 2023 to 2033

Figure 181: South Asia and ASEAN Market Value (US$ Million) Analysis by Buyer Type, 2018 to 2033

Figure 182: South Asia and ASEAN Market Volume (Units) Analysis by Buyer Type, 2018 to 2033

Figure 183: South Asia and ASEAN Market Value Share (%) and BPS Analysis by Buyer Type, 2023 to 2033

Figure 184: South Asia and ASEAN Market Y-o-Y Growth (%) Projections by Buyer Type, 2023 to 2033

Figure 185: South Asia and ASEAN Market Value (US$ Million) Analysis by Sales Channel, 2018 to 2033

Figure 186: South Asia and ASEAN Market Volume (Units) Analysis by Sales Channel, 2018 to 2033

Figure 187: South Asia and ASEAN Market Value Share (%) and BPS Analysis by Sales Channel, 2023 to 2033

Figure 188: South Asia and ASEAN Market Y-o-Y Growth (%) Projections by Sales Channel, 2023 to 2033

Figure 189: South Asia and ASEAN Market Attractiveness by Power Type, 2023 to 2033

Figure 190: South Asia and ASEAN Market Attractiveness by Buyer Type, 2023 to 2033

Figure 191: South Asia and ASEAN Market Attractiveness by Sales Channel, 2023 to 2033

Figure 192: South Asia and ASEAN Market Attractiveness by Country, 2023 to 2033

Explore Process Automation Insights

View Reports

Commercial Charbroiler Market