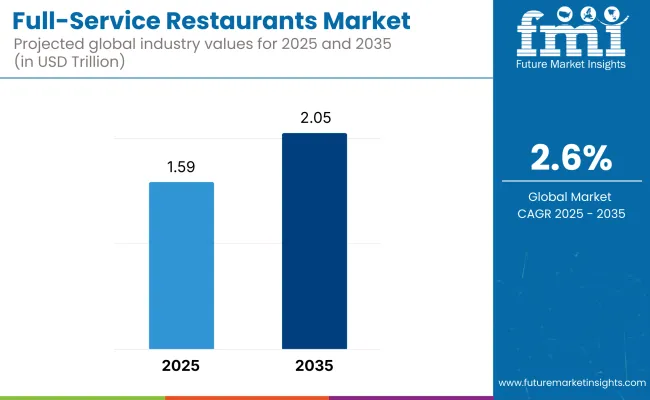
The global Full-Service Restaurants market is projected to be valued at USD 1.59 trillion in 2025. It is anticipated to reach USD 2.05 trillion by 2035, expanding at a CAGR of 2.6% over the forecast period.
There is a transformational phase driven by the paradigm shift in consumer mindset, innovative technological advancements, and a re-emphasis on culinary creativity. In the face of the expanding food service sector, the industry is taking advantage of high-quality ingredients, the usage of advanced technologies, and the provision of personalized services to embody competitive advantages.
Booming disposable incomes and a strong willingness to eat out have been the key assets leading to development. Customers are not just focused on the food alone. They also think about the environment and ambiance. This leads to an outstanding increase in the experiential dining trend, which is the association of interactive menus, chef-led, and immersive restaurant concepts with technology to completely alter the dining experience.
The fusion of the tech is a key factor influencing the industry. The incorporation of digital solutions such as AI-produced menu recommendations, automated reservation systems, and contactless payment methods is not only changing the game but also creating hyper-customer satisfaction. Besides, the application of data analytics is geared toward rationalizing the pricing methods, demand prediction, and menu suggestions based on the consumer's insight.
The other factors greatly influencing the industry are sustainability and health-conscious dining, which have begun to emerge as key factors. Consumers prefer to have food that is raised locally, organic, and based on plants, which is the main reason why gastronomy had to switch to sustainable sourcing and adopt green operational practices.
These initiatives, especially involving waste reduction programs, energy-efficient kitchen appliances, and ethical ingredient mandatory sourcing, are becoming part of long-term solutions to business challenges.
Even if there are positive aspects to growth, the industry still faces such issues as the unsteady costs of inputs, labor shortage, and the ever-rising competition from fast-casual and take-out-only restaurants, which in turn become the most visible obstacles. Yet, the industry comes up with solutions that increase revenues by mixing models of take-out, delivery, and dine-in while also focusing on customer loyalty programs that are meant to retain customers.
Along the way of transformation, full-service restaurants that come up with creative ideas, continually reshuffle consumer preferences, and practice sustainable policies are perceived to have a high probability of making it through for many years. Adaptability, quality, and the ability to provide the public with unique and unforgettable dining experiences will lead to immense growth.
Consumers are opting for healthier menu items, customized dining, and the smooth integration of digital technologies. Casual dining and family restaurants continue to dominate, powered by budget-friendly prices and varied menu offerings, while fine dining and theme restaurants emphasize distinctive ambiance and high-ticket items.
Technology adoption is transforming the industry, with online booking, digital menus, and AI-powered customer insights improving the overall experience. Sustainability practices, including locally sourced ingredients and waste reduction measures, are becoming increasingly significant, especially in high-end and environmentally conscious venues.
Health trends drive menu selection, with plant-based, organic, and low-calorie foods gaining popularity. Themed and experiential dining concepts, including immersive culinary experiences and fusion cuisine, are appealing to younger consumers. The industry's growth depends on operational efficiency, cost control, and responding to changing consumer expectations.
From 2020 through 2024, there were significant changes due to changing consumer trends, technology, and the residual impacts of the COVID-19 pandemic. The industry saw more hybrid dining models, with traditional sit-down restaurants adapting takeout, delivery, and ghost kitchen operations to maintain revenue streams. Customers also showed a strong desire for sustainable and healthy food, and thus, the demand for plant-based meals on the menu, locally produced ingredients, and openness in food sourcing.
Digitalization was important, and restaurants utilized AI-backed reservations, touchless payments, and customized digital menus to provide improved customer experience. Workforce crises and increased operational costs compelled restaurants to maximize efficiency using automation, including robot kitchen aides and self-service computers.
Advancements in AI, automation, and sustainability practices will occur between 2025 and 2035. Hyper-personalization will be the absolute king, with AI dividing people's tastes and crafting individual dining experiences, from individual menus to pre-emptive ordering.
Automation will reshape kitchens with robotic chefs, and food prep will be done via artificial intelligence, all making things more consistent. Virtual/augmented reality technologies will transform dining into an experience, from holographic interactive menus to virtual chefs with AI capacity that can recommend dishes at the table. Blockchain technology will also improve the traceability of food, from open-sourced sourcing to ethically sourced food.
A Comparative Market Shift Analysis (2020 to 2024 vs. 2025 to 2035)
| 2020 to 2024 | 2025 to 2035 |
|---|---|
| Hybrid concepts combining takeout, delivery, and ghost kitchens | AI-based customized dining and completely automated kitchens |
| Growing demand for plant-based, locally grown, and organic produce | Carbon-neutral restaurants, lab-grown meat, and zero-waste AI food management |
| AI-based reservations, contactless payments, and customized digital menus | Blockchain for food traceability, AI-based menu customization, and virtual dining experiences |
| Implementation of self-ordering kiosks and robotic kitchen helpers to address labor shortages | Robotic chefs and AI-driven service staff for completely automated food preparation |
| Experiential dining with immersive environments and interactive components | AR/VR-enhanced meals, holographic menus, and AI-driven tableside suggestions |
| Application of automation and AI to cost management and efficiency | Predictive AI for inventory control, energy optimization, and dynamic pricing |
| Growing plant-based and sustainable food choices | Hyper-personalized menus with AI-curated recommendations and nutrition tracking |
| Digital loyalty programs, social media-driven engagement, and influencer collaborations | AI-driven dynamic marketing, virtual restaurant influencers, and NFT-based loyalty rewards |
Operational risks in the Full-Service Restaurants market include labour shortages, increased wages, and high staff turnover. Recruitment and retention challenges affect service delivery and operational efficiency. To reduce labor-related risks and maintain service quality, enterprises need to employ employee engagement programs, offer competitive benefits, and invest in automation equipment.
Fluctuations in the economy and inflation affect consumer spending habits, which, in turn, impact restaurant revenues. During periods of economic downturn, spending on disposable income decreases, causing a drop in customer numbers. Restaurants have to diversify their menus, launch value-oriented meals, and readjust their pricing strategies to reach thrifty customers while maintaining profitability.
Compliance with regulations is often the most significant challenge at a time when food safety, hygiene, and labor laws are changing. A case involving non-compliance with health codes and workplace laws may lead to fines, lawsuits, or the company being blacklisted.
Emphasis on innovation in menu processing, participation in a sustainable supply chain, and transparency about the sourcing of raw materials can increase the company's revenue share and build brand loyalty.
Other platforms, such as online food delivery platforms, are competing. Restaurants must balance their experience with the physical venue of innovative technology, like a contactless booking system, and partnership with revised services to maintain functionality and grasp share in an evolving industry.
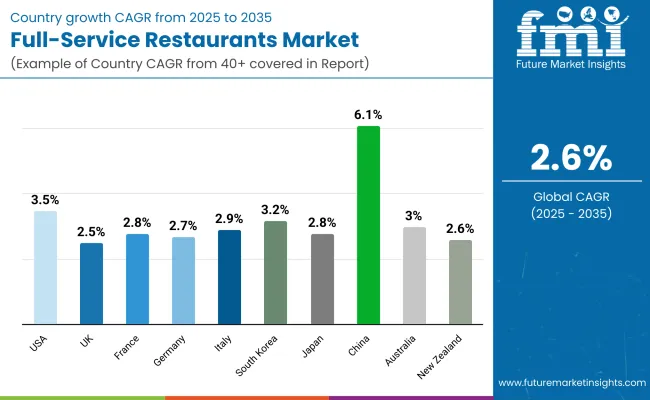
| Countries | CAGR (2025 to 2035) |
|---|---|
| USA | 3.5% |
| UK | 2.5% |
| France | 2.8% |
| Germany | 2.7% |
| Italy | 2.9% |
| South Korea | 3.2% |
| Japan | 2.8% |
| China | 6.1% |
| Australia | 3.0% |
| New Zealand | 2.6% |
The USA Full-Service Restaurants industry is likely to grow at a CAGR of 3.5% during 2025 to 2035 because of strong dining-out behavior and increased use of technology in food service. New meal occasions created by convenience are shaping the industry. Digital ordering, customer personalization through AI, and sustainability features such as plant-based offerings and zero-waste kitchens are some of the trends.
Moreover, urbanization, as well as the trend of experiential dining in the form of theme and interactive restaurants, continue to drive growth. Demand for the industry for locally sourced and organic food also reflects a shift in consumer trends, guaranteeing steady growth over the next decade.
The UK Full-Service Restaurants market is expected to register a CAGR of 2.5% during 2025 to 2035. The sector is propelled by expansion in casual dining and rising demand for international cuisine. Even though there is economic uncertainty, there is an insatiable demand for quality food. Restaurants are also adopting technology on a greater scale through seamless bookings, online menus, and contactless ordering.
Sustainability efforts such as minimizing food waste and offering plant-based dishes are also gaining momentum more and more. Yet, through premiumization and consumer-driven innovation, the UK Full-Service Restaurants market will counter the challenge of competition from fast-casual restaurants.
France's Full-Service Restaurants market is also set to maintain a CAGR of 2.8% over the forecast period, reflecting the country's superior food culture. Fine dining is still a bastion, but trendy and casual bistros are also in demand. The French consumer demands quality products and authenticity, leading restaurants to place a high value on farm-to-table freshness and green cuisine.
Digitalization is also on the rise, with mobile booking and AI-driven menu recommendations being increasingly used. Evolving consumer behavior keeps stimulating growth, particularly in urban centers with an effervescent restaurant atmosphere.
Germany's Full-Service Restaurants industry will grow at a CAGR of 2.7% from 2025 to 2035. Classic restaurants combined with modern, health-conscious restaurants dominate the industry.
The popularity of flexitarian diets has driven growth among plant-based vegetarians and vegan restaurants. Technology advancements, including robotic kitchens and food recommendations through artificial intelligence, are also enhancing operating efficiency. Economic stability and rising disposable incomes also spur growth, and there is also a strong demand for quality ingredients.
The Italian Full-Service Restaurants sector is projected to grow at a CAGR of 2.9% from 2025 to 2035 due to its world-renowned culinary culture and the increasing international popularity of Italian cuisine.
Trattoria and osteria are the current favorites, but new dining trends that combine authenticity with contemporary presentation are in demand. Tourists are prime drivers, and that leads to demand for higher-end dining. Sustainability trends like slow food principles and organic farming remain highly desired by customers. Embracing digital technology such as AI-based wine pairing and table-attached communication during meals is also gaining momentum.
South Korean Full-Service Restaurants services will register a CAGR of 3.2% in the forecast period due to a rich food culture and rising disposable incomes.
Korean BBQ restaurants and Hansika restaurants remain prosperous, but innovation restaurants and fusion cuisine are cropping up on an enormous scale. Utilization of intelligent restaurant technology, such as robot waiters and artificial intelligence-operated ordering systems, increases efficiency and satisfaction. Health-conscious consumption with an emphasis on fermented food and organic food also affects the trends. Strategic café culture and urbanization fuel long-term business growth.
Japan's Full-Service Restaurants industry is projected to expand modestly at a 2.8% CAGR from 2025 to 2035. Japan's rich culinary culture backs the sector, and the focus continues on quality fresh ingredients and cooking.
Restaurants serving sushi, ramen, and izakayas are still popular, but clients increasingly look for healthy and plant-based consumption. Technological advancements, including AI-automated order preparation and robotic kitchens, are making operations more efficient. Japan's ability to combine technology and tradition facilitates ongoing growth, especially in urban areas where eating continues to be the center of social activity.
China's Full-Service Restaurants business is expected to expand at an astronomical CAGR of 6.1% over the following decade. Increased disposable income, urbanization, and a culinary culture deeply embedded in the public drive this development. Hotpot chains, special restaurants, and high-end eating are all healthy. Technology is being utilized across the board through QR code orders and AI-supported recommendations, making it more efficient.
Millennials are looking for distinctive and new eating experiences, driving restaurants to keep innovating. Eco-friendly initiatives such as food wastage reduction and increasing plant-based diets are on the upsurge, too.
The Australian Full-Service Restaurants market will grow at a CAGR of 3.0% between 2025 and 2035. The sector is characterized by a vibrant multicultural presence, which translates into diversified food demand. Organic food, green food, and health-oriented food consumption all influence the diet. Farm-to-table experience eateries and indigenous Australian product consumption culture are a few of the trends that can be experienced.
Digitalization is revolutionizing the nation, with digital booking, AI customer profiling, and automated kitchen management becoming increasingly important. The emphasis on premium dining experience and quality service leads to continuous growth.
New Zealand's Full-Service Restaurants sector is anticipated to witness growth at a CAGR of 2.6% over the forecast period, driven by a growing tourism industry and rising local demand for fine dining experiences. Demand for organic and sustainable consumption is growing, and local sourcing is gathering more attention. There is rising demand for new fusion food and upscale casual dining, which suggests changing consumer habits. Technology-driven innovation, such as AI-driven customer interaction and automated service automation, is increasing business efficiency. Despite economic turmoil, culinary tradition and enthusiasm for food indulgence at a high standard in the country will drive modest growth.
| Segment | Value Share (2025) |
|---|---|
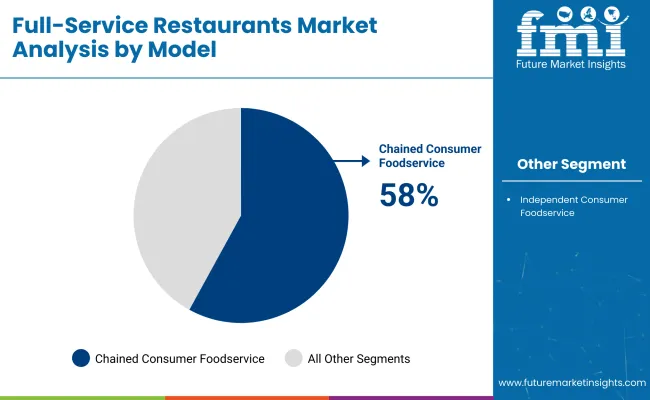
| Chained Consumer Foodservice (By Model) | 58% |
The vertical and cross-restaurant coverage will result in approximately 58% of total revenues for chained FSR consumer food service in 2025, primarily driven by the top-down approach. This dominance is driven by brand loyalty, standardized quality of service, and massive marketing efforts.
International chains, including Applebee’s, Outback Steakhouse, and Red Lobster, are striking back, utilizing economies of scale and digital transformation to improve the customer experience. Armed with AI-powered menu personalization, it gives its customers data analytics. Its marketers can anticipate what consumers want and need, such as the rollout of healthier menu items and immersive dining experiences.
Franchised operations continue to be a key growth driver since expanding disposable income in emerging markets has fueled demand for premium casual dining. Chains are also banking on convenience by targeting high-footfall locations like shopping malls, airports, and transit hubs. Texas Roadhouse, for example, is growing across borders, particularly in Asia. Shake Shack is expanding globally and trying to stake out a presence in new areas of the Middle East and Southeast Asia.
Independent consumer food services account for 42% of the share, and they are in a great position to fulfill consumer desires that cannot be catered for at home, such as unique dining experiences, personalized service, and varied food offerings.
Landmark gourmet farm-to-table destinations like Blue Hill in New York or chef-driven, food-obsessive restaurants like Gaggan Anand in Bangkok normally attract food tourists who are happy to dine authentically and exclusively. However, higher operational costs, labor shortages, and competition from large chains are creating challenges for independent operators.
| Segment | Value Share (2025) |
|---|---|
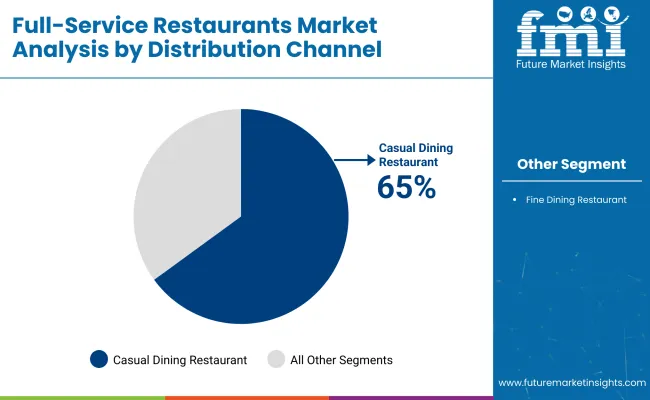
| Casual Dining Restaurants | 65% |
Casual dining restaurants still dominate and will contribute 65% of their value in 2025. This segment appeals to a wide range of customers by providing high-quality yet affordable dining experiences. As people begin to favor social dining, casual restaurants offer the perfect mix of ambiance, variety, and pricing and are the number one choice for families, millennials, and large groups.
A broad spectrum of innovative strategies, such as open kitchens, interactive digital menus, and chef-driven cuisines, primarily drives this segment. Big names such as Applebee’s, Chili’s, and TGI Fridays are pouring money into technology such as contactless ordering, artificial intelligence-powered customer service, and automated kitchen operations to improve productivity.
As an illustration, Chili’s utilizes AI-driven recommendations to provide personalized menu suggestions, and Applebee’s has integrated tablet-based ordering to hasten service delivery and enhance customer engagement.
Post-pandemic recovery trends have further supported the popularity of casual dining. Consumers have grown more risk-averse and desirous of comfort and familiarity, which has translated to more foot traffic at established chains. The trend of suburbanization and mixed-use developments has also motivated brands to open more stores in residential areas to serve weekday convenience needs as well as weekend leisure dining. The Cheesecake Factory has been careful to open more suburban restaurants, where family dining trends are on the rise.
In contrast, fine dining restaurants make up 35% of the share but cater to a demographic seeking premium service and gourmet cuisine. Yet, increasing operational costs and changing consumer spending patterns have forced upscale restaurants to implement hybrid casual-fine-dining models with prix fixe menus and experiential tasting formats to ensure both profitability and alignment with evolving trends.
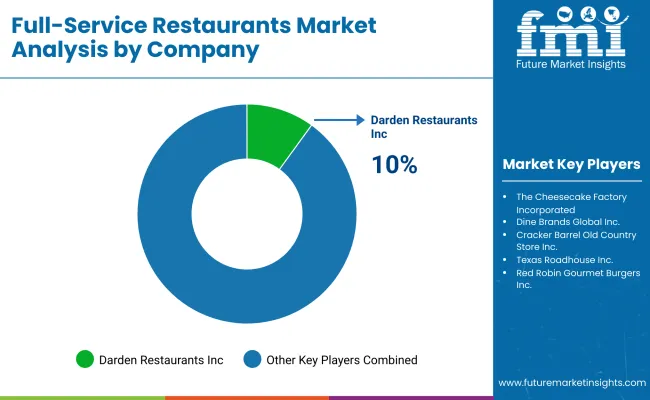
The global Full-Service Restaurants industry is anticipated to grow vigorously in 2024 due to changing consumer preferences for the dining experience and heightened demand for diversity in food products. As consumers look for unique, memorable dining experiences, full-service restaurants are poised to develop their menu options, ambiance, and customer experience. The experiential dining trend, where ambiance and service are comparable to the quality of food, is rendering competitiveness in the trend.
Key leaders are planning strategic expansion moves to grab more share in the growing market. Challengers are spending money on technology so that they can mechanize and move closer to the consumer through web-based booking and reward schemes. Healthy food is also prompting restaurants to introduce more nutritious alternatives to the menu and sustainable ways of getting goods.
The trends keep changing, and to stay ahead in the competition, brands must focus on quality, innovation, and customer experience. The entire Full-Service Restaurants market will continue performing well as operators shift to accommodate shifting consumer preferences and surf new waves in the food business.
Market Share Analysis by Company
| Company Name | Estimated Market Share (%) |
|---|---|
| Darden Restaurants, Inc. | 10-14% |
| Bloomin' Brands, Inc. | 8-12% |
| Brinker International, Inc. | 7-11% |
| The Cheesecake Factory Incorporated | 6-10% |
| Dine Brands Global, Inc. | 5-9% |
| Other Key Players | 30-40% (Combined) |
| Company Name | Key Offerings/Activities |
|---|---|
| Darden Restaurants, Inc. | Expanding Olive Garden and LongHorn Steakhouse footprint with tech integration. |
| Bloomin' Brands, Inc. | Strengthening Outback Steakhouse and Carrabba’s with new digital ordering. |
| Brinker International, Inc. | Innovating Chili’s and Maggiano’s menus with bold flavors and a sustainability focus. |
| The Cheesecake Factory Incorporated | Expanding international locations while maintaining extensive dessert and meal offerings. |
| Dine Brands Global, Inc. | Enhancing Applebee’s and IHOP with loyalty programs and delivery expansions. |
Key Company Insights
Darden Restaurants, Inc. (10-14%)
Expanding its restaurant portfolio, leveraging technology for better customer service, and enhancing digital ordering systems.
Bloomin' Brands, Inc. (8-12%)
Strengthening international expansion efforts with aggressive marketing strategies and omnichannel customer engagement.
Brinker International, Inc. (7-11%)
Focusing on sustainability by sourcing responsibly and introducing new plant-based menu options.
The Cheesecake Factory Incorporated (6-10%)
Innovating with new menu offerings while maintaining a strong focus on high-quality desserts and casual dining appeal.
Dine Brands Global, Inc. (5-9%)
Expanding delivery services for IHOP and Applebee’s, improving customer experience through app-based loyalty programs.
Other Key Players (30-40% Combined)
The segmentation is into Independent Consumer Foodservice and Chained Consumer Foodservice.
The segment is into casual dining restaurants and fine dining restaurants.
The segmentation is into Standalone, Retail, Travel, Leisure, and Hotels.
The industry analysis covers North America, Latin America, Europe, South Asia, East Asia, Oceania, and the Middle East & Africa.
The industry is expected to reach USD 1.59 trillion in 2025.
The market is projected to grow to USD 2.05 trillion by 2035.
China is expected to grow at the fastest rate, with a CAGR of 6.1% during the forecast period.
The Chained Consumer foodservice segment is among the most widely used in the market.
Leading companies include Darden Restaurants, Inc., Bloomin' Brands, Inc., Brinker International, Inc., The Cheesecake Factory Incorporated, Dine Brands Global, Inc., Cracker Barrel Old Country Store, Inc., Texas Roadhouse, Inc., Red Robin Gourmet Burgers, Inc., Ruth's Hospitality Group, Inc., and Landry's, Inc.


Full Research Suite comprises of:
Market outlook & trends analysis
Interviews & case studies
Strategic recommendations
Vendor profiles & capabilities analysis
5-year forecasts
8 regions and 60+ country-level data splits
Market segment data splits
12 months of continuous data updates
DELIVERED AS:
PDF EXCEL ONLINE
Evaluating Market Share in Restaurants & Mobile Food Services
Restaurants & Mobile Food Services Market Trends – Forecast 2025 to 2035

Thank you!
You will receive an email from our Business Development Manager. Please be sure to check your SPAM/JUNK folder too.
Chat With
MaRIA