Commercial Cutlery Market
Learn Why Hospitality Industry is the Most Beneficial Segment for Commercial Cutlery Manufacturers with Future Market Insights
Commercial Cutlery Market by Material Type, Product, Application & Region - Forecast 2023 – 2033
Commercial Cutlery Market Outlook (2023-2033)
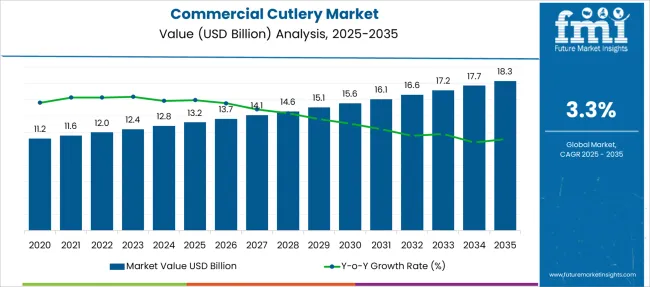
The commercial cutlery market size is anticipated to rise from US$ 12.4 Bn in 2023 and it is anticipated to surpass US$ 17.1 Bn by 2033. The demand for commercial cutlery is expected to increase at a CAGR of 3.3% during the forecast period. Key factors projected to support market growth include:
- With increased levels of individual or family spending power, fast food consumption likewise rises. Fast food is becoming more and more popular since it is convenient and palatable.
- Due to people's propensity for quick meals at restaurants, hotels, cafés, and other establishments, there is a surge in the demand for commercial cutlery.
- The market for commercial cutlery is growing as people become more aware of the infectious illnesses that may be spread via the frequent usage of silverware.
- Takeout culture is booming as it benefits both restaurant owners and patrons by allowing them to enjoy their meals at home without taking up a lot of room.
Long-term, when things start to stabilize, buyers concentrate on acceptable commercial cutlery goods. The industry for commercial cutlery is currently taking into account changing its strategy, rationalizing its product lines, and assessing the sturdiness of its supply chains and network of routes to markets. Given that more people are turning to online purchasing due to the ongoing epidemic, eCommerce and distribution networks need to be streamlined and enhanced.
Let us know your requirement to get
100% FREE customization
Latest Trends and Opportunities for Commercial Cutlery Manufacturers
To meet consumer demand and boost sales, manufacturing companies are anticipated to attempt to build up their operations as omnichannel businesses. The sales of commercial cutlery are likely to increase with a rise in the hospitality business, as it is a significant user of commercial cutlery, therefore the industry's rebound is anticipated to fuel growth.
Due to the increased penetration of fast-food restaurant brands like Subway, Taco Bell, Pizza Hut, and Domino's, the commercial cutlery market size is anticipated to increase. Fast food has become more popular in modern times since it is prepared, accessible, and delicious. The National Center for Health Statistics reports that youth are more likely to eat fast food, with 36.6% of the population doing so on any given day.
Commercial Cutlery Market Value (2023) |
US$ 12.4 Bn |
Commercial Cutlery Market Forecast Value (2033) |
US$ 17.1 Bn |
Commercial Cutlery Market CAGR (2023-2033) |
3.3% |
U.S. Commercial Cutlery Market Share (2023) |
68.0% |
Category-wise Insights
Which Product Segment Holds Dominance in Commercial Cutlery Market?
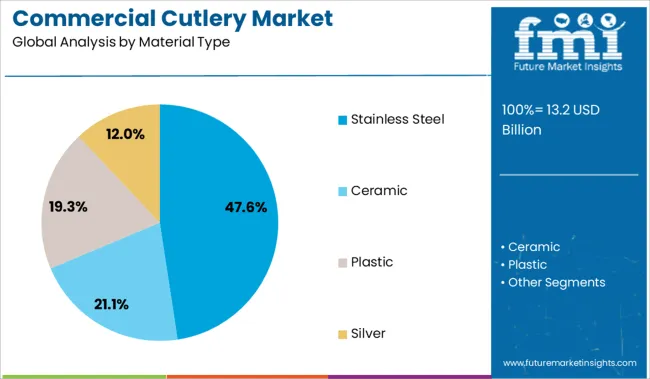
The stainless steel category is anticipated to exhibit the greatest CAGR of 5.7% from 2023 to 2033. Stainless steel is the most prevalent material used to make commercial cutlery. Knives made of stainless steel are long-lasting, simple to maintain, and corrosion-resistant. They are a fantastic choice for chefs who are conscious of their budget as they are also reasonably priced. It is simple to disinfect stainless steel. In an environment where food is prepared, hygiene is crucial, thus stainless steel also held a considerable share in the global commercial cutlery market.
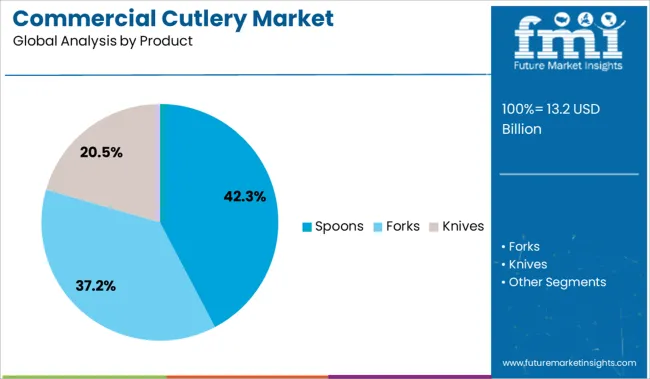
Spoon Category Dominates, However, Fork Segment is Likely to Hold a Higher CAGR of 13.20% from 2023 to 2033
The spoon product category had the most revenue in 2022 and is anticipated to hold its position as the industry leader for the duration of the market projection. This is attributable to rising health concerns in nations like China and India as well as rising demand for flavored spoons. Additionally, it is anticipated that a rise in flours devoid of artificial chemicals would boost demand for cutlery in the United States.
However, the Fork category is anticipated to see the largest CAGR growth throughout the projection period due to improved design, form, and flavor along with a rise in customer desire for goods created with natural ingredients in nations like Canada.
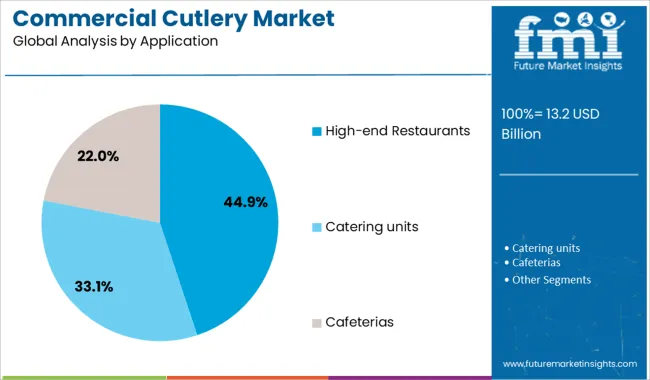
High-end Restaurants Driving the Demand for the Commercial Cutlery
The adoption of commercial cutlery in upscale restaurants is expanding along with the food service sector. Using commercial cutlery has several benefits, including the following:
- Commercial cutlery is made to resist severe usage and, with good maintenance, may last for several years.
- Commercial knives are great for professional chefs who need to make precise cuts since their blades are often significantly sharper than those of domestic knives.
- Due to their ergonomic form, commercial blades are frequently more pleasant to grip and use than domestic knives.
- Using industrial silverware may offer a restaurant a more sophisticated appearance and feel, drawing in more affluent guests.
Find your sweet spots for generating winning opportunities in this market.
Talk to AnalystComparative View of the Adjacent Commercial Cutlery Market
Commercial Cutlery Market:
Attributes |
Commercial Cutlery Market |
CAGR (2022-2032) |
3.3% |
Market Value (2033) |
US$ 17.1 Bn |
Growth Factor |
The size of the commercial cutlery market is predicted to grow as a result of the growing penetration of fast-food restaurant brands like Subway, Taco Bell, Pizza Hut, and Domino. |
Opportunity |
Since the hospitality industry is a big user of commercial cutlery and is expected to grow when the industry recovers, sales of commercial cutlery are projected to increase. |
Key Trends |
Manufacturing companies are projected to try expanding their operations as omnichannel enterprises to match customer demand and increase sales. |
Edible Cutlery Market:
Attributes |
Edible Cutlery Market |
CAGR (2022-2032) |
10% |
Market Value (2033) |
US$ 94.41 Bn |
Growth Factor |
Growing disposable wealth and increased health consciousness have spurred the demand for edible cutlery. |
Opportunity |
Edible cutlery manufacturers believe that a rise in vegans' demand for the product as well as the development of new flavors and varieties of flavored flours is likely to open up lucrative business opportunities. |
Key Trends |
Other factors that contribute to the industry's expansion include the introduction of new healthy flours and herbs by various market participants. |
Commercial Tableware Services Market:
Attributes |
Commercial Tableware Services Market |
CAGR (2022-2032) |
7.7% |
Market Value (2033) |
US$ 13.99 Bn |
Growth Factor |
The demand for tableware services in the commercial sector has been largely driven by the increased acceptance of serving ware with considerable development in the food service and hospitality industries. |
Opportunity |
Commercial tableware services are becoming more widely used as a result of the development of self-service kiosks in restaurants. |
Key Trends |
Increasing societal trends that encourage communal meals, changing lifestyles, and shrinking disposable budgets have all led to an increase in demand for commercial tableware services. |
Country-wise Insights-
United States to Capture Largest Share in the Global Commercial Cutlery Market
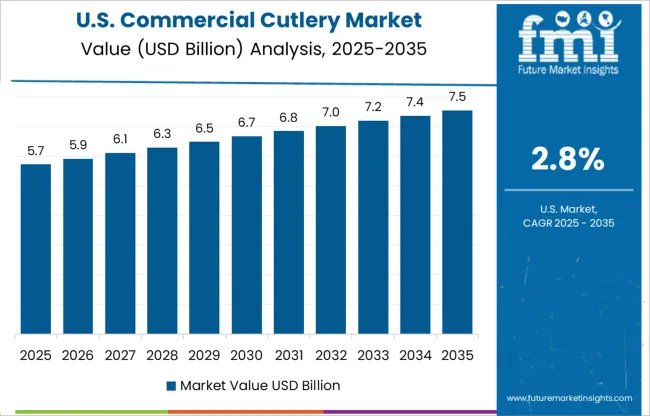
In 2023, the US commercial cutlery market is estimated to account for 68% share, with a value of US$ 3.2 Bn. The commercial cutlery business in the United States is developing quickly. This is caused by several things, one of which is the rising popularity of cooking competition shows. A growing portion of the Indian population has been migrating to nations like Canada and the U.S., which has increased demand for commercial cutlery in the region of North America. There are several potentials for growth in the market for commercial cutlery as a result of the trend of opening restaurants, cafés, and small eateries that serve Indians in these nations.
People are getting increasingly eager to experiment at home as they are exposed to a wider variety of foods and cooking methods. As a result, there is now more demand for high-quality cookware and silverware. The increase in disposable money is another aspect fuelling market expansion. People are willing to pay more for longer-lasting, higher-quality goods when their disposable income increases.
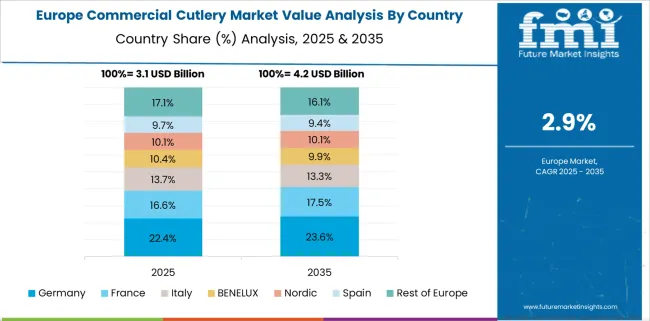
UK to Leave Germany and France Behind and Lead the Europe Commercial Cutlery Market
With an estimated market value of US$ 1.1 billion in 2023, the UK commercial cutlery market is projected to hold a 22% share of the Europe region. Performance in the commercial cutlery industry in the United Kingdom is uneven. Others have found it difficult to compete with foreign producers, while other British businesses have been able to establish themselves as major suppliers of commercial cutlery.
The manufacturing of personalized cutlery is one industry in which UK commercial cutlery businesses have seen great success. Due to this, companies have been able to target a certain market and command high prices for their products.
Japan to Witness an Increase in Quality of Commercial Cutlery Production
The Japan commercial cutlery market accounted for 18% of the Asia Pacific market in 2023, with a value of US$ 700 Mn. Japan is one of the top manufacturers of commercial cutlery, contributing a considerable share of the global supply. Due to its abundant production capacity and inexpensive labor, the nation currently controls a large portion of the industry and provides shops throughout the world with both high-end and budget-friendly alternatives.
Japanese commercial cutlery is often seen as low quality than products from Western nations, however recent years have witnessed a noticeable increase in the country's workmanship. The nation's position as one of the leading providers of commercial cutlery is set to further strengthen as it continues to expand its production capabilities.
Korea Commercial Cutlery Manufacturers to Witness Numerous Growth Opportunities
Korea reportedly has become one of the fastest-growing regions in the commercial cutlery business. The demand for commercial cutlery has significantly increased in Korea due to the region's huge population, fast urbanization, and rising consumer disposable income. The market for commercial cutlery in Korea saw a fall as a result of COVID. However, the market has rebounded, and all commercial cutlery manufacturing and distribution operations are practically back to full capacity. The market is expected to have beneficial effects as a result of the higher pay rates for production workers. The commercial cutlery market in Korea is expected to be primarily driven by the hospitality industry.
A unified Market Research Subscription Platform, built for today's disparate research needs.
Competitive Landscape-
To influence customers' decisions and set their products apart from the competition, businesses are concentrating on producing items with distinctive textures, graphics (on-pack marketing), eye-catching colors, and creative concepts. For sweets, food tasting, hot and cold cuisine, as well as outdoor festivals and events, customers can utilize wooden cutlery. Providers of commercial cutlery solutions might take advantage of this chance by launching new product lines targeted exclusively at consumers who are concerned about the environment.
Furthermore, to boost profitability and strengthen their market position, players in the commercial cutlery sector have made new launches and acquisitions a fundamental part of their growth strategy. Additionally, players have focused on company growth to maintain their competitiveness in the international market Accordingly, the need for various types of commercial cutleries is likely to increase as nations make increasing expenditures in the development of office buildings, hotels, retail stores, malls, hospitals, and other commercial infrastructure.
A few dominant players in the market for commercial cutlery are:
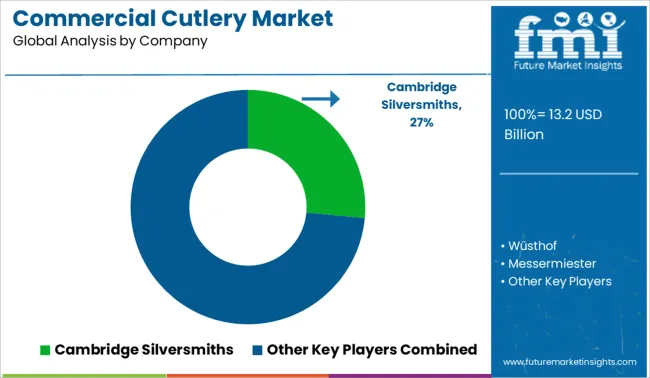
One of the biggest producers of professional knives in the US is Dexter-Russell, and many restaurants employ their goods. Another significant participant in the market for industrial cutlery is Victorinox, and many chefs choose their Swiss Army knives. German Company Wüsthof has been producing high-quality knives for generations, and many chefs adore their offerings. Although several smaller businesses provide high-quality items, these three dominate the market for commercial cutlery.
Recent Developments in the Commercial Cutlery Market
- ReFork Industries, a company situated in Europe, said in 2020 that it had created a 100% biodegradable material that was being utilized to make cutlery goods in substitute of throwaway plastics.
- For improved hygiene and sanitation, Pactiv LLC, a market leader in disposable cutlery products, offers a wide selection of wrapped cutlery.
Commercial Cutlery Market Report Scope
Attribute |
Details |
Forecast Period |
2023-2033 |
Historical Data Available for |
2017-2022 |
Market Analysis |
US$ Bn for Value and Units for Volume |
Key Regions Covered |
|
Key Countries Covered |
|
Key Segments Covered |
|
Key Companies Profiled |
|
Report Coverage |
DROT Analysis, Market Forecast, Company Share Analysis, Market Dynamics and Challenges, Competitive Landscape, and Strategic Growth Initiatives |
Customization & Pricing |
Available upon Request |
Commercial Cutlery Market by Category
By Material Type, Commercial Cutlery Market is segmented as:
- Stainless Steel
- Ceramic
- Plastic
- Silver
By Product, Commercial Cutlery Market is segmented as:
- Spoons
- Forks
- Knives
By Application, Commercial Cutlery Market is segmented as:
- High-end Restaurants
- Catering units
- Cafeterias
By Region, Commercial Cutlery Market is segmented as:
- North America
- Latin America
- Europe
- Asia Pacific
- Oceania
- MEA
Frequently Asked Questions
The commercial cutlery market is estimated to account for US$ 12.4 Bn in 2023.
The commercial cutlery market is expected to rise at a CAGR of 3.3% during 2023-2033.
The high-end restaurant segment dominates the commercial cutlery market in 2023.
The commercial cutlery market is forecasted to surpass US$ 17.1 Bn by the year 2033.
Table of Content
1. Executive Summary
1.1. Global Market Outlook
1.2. Demand-side Trends
1.3. Supply-side Trends
1.4. Technology Roadmap Analysis
1.5. Analysis and Recommendations
2. Market Overview
2.1. Market Coverage / Taxonomy
2.2. Market Definition / Scope / Limitations
3. Market Background
3.1. Market Dynamics
3.1.1. Drivers
3.1.2. Restraints
3.1.3. Opportunity
3.1.4. Trends
3.2. Scenario Forecast
3.2.1. Demand in Optimistic Scenario
3.2.2. Demand in Likely Scenario
3.2.3. Demand in Conservative Scenario
3.3. Product launches & Recent Developments
3.4. Product Life Cycle Analysis
3.5. Value Chain Analysis
3.5.1. Supply Side Participants and their Roles
3.5.1.1. Producers
3.5.1.2. Mid-Level Participants (Traders/ Agents/ Brokers)
3.5.1.3. Wholesalers and Distributors
3.5.2. % of Operating Margin Analysis
3.5.3. List of Raw Material Suppliers
3.5.4. List of Existing and Potential Buyer’s
3.6. Global Market - Pricing Analysis
3.6.1. Price Point Assessment by Region
3.6.2. Price Point Assessment by Product Type
3.6.3. Price Forecast till 2033
3.6.4. Factors affecting pricing
3.7. Forecast Factors - Relevance & Impact
3.8. PESTLE and Porter’s Analysis
3.9. Regulatory Landscape
3.9.1. Packaging & Labelling Regulations
3.9.2. Certifications and Certifying Agency Overview
3.9.3. Import/Export Policies
3.10. Regional Parent Market Outlook
3.11. Production and Consumption Statistics
3.12. Import and Export Statistics
3.13. Consumers Survey Analysis
3.14. Macro-Economic Factors
3.15. Product Claims & Nutritional Information Scan by Buyers
4. Global Market Analysis 2018-2022 and Forecast, 2023-2033
4.1. Historical Market Size Value (US$ Bn) & Volume (MT) Analysis, 2018-2022
4.2. Current and Future Market Size Value (US$ Bn) & Volume (MT) Projections, 2023-2033
4.2.1. Y-o-Y Growth Trend Analysis
4.2.2. Absolute $ Opportunity Analysis
5. Global Market Analysis 2018-2022 and Forecast 2023-2033, By Material Type
5.1. Introduction / Key Findings
5.2. Historical Market Size Value (US$ Bn) & Volume (MT) Analysis By Material Type, 2018-2022
5.3. Current and Future Market Size Value (US$ Bn) & Volume (MT) Analysis and Forecast By Material Type, 2023-2033
5.3.1. Stainless Steel
5.3.2. Ceramic
5.3.3. Plastic
5.3.4. Silver
5.4. Y-o-Y Growth Trend Analysis By Material Type, 2018-2022
5.5. Absolute $ Opportunity Analysis By Material Type, 2023-2033
6. Global Market Analysis 2018-2022 and Forecast 2023-2033, By Product
6.1. Introduction / Key Findings
6.2. Historical Market Size Value (US$ Bn) & Volume (MT) Analysis By Product, 2018-2022
6.3. Current and Future Market Size Value (US$ Bn) & Volume (MT) Analysis and Forecast By Product, 2023-2033
6.3.1. Spoons
6.3.2. Forks
6.3.3. Knives
6.4. Y-o-Y Growth Trend Analysis By Product, 2018-2022
6.5. Absolute $ Opportunity Analysis By Product, 2023-2033
7. Global Market Analysis 2018-2022 and Forecast 2023-2033, By Application
7.1. Introduction / Key Findings
7.2. Historical Market Size Value (US$ Bn) & Volume (MT) Analysis By Application, 2018-2022
7.3. Current and Future Market Size Value (US$ Bn) & Volume (MT) Analysis and Forecast By Application, 2023-2033
7.3.1. High-end Restaurants
7.3.2. Catering units
7.3.3. Cafeterias
7.4. Y-o-Y Growth Trend Analysis By Application, 2018-2022
7.5. Absolute $ Opportunity Analysis By Application, 2023-2033
8. Global Market Analysis 2018-2022 and Forecast 2023-2033, By Region
8.1. Introduction
8.2. Historical Market Size Value (US$ Bn) & Volume (MT) Analysis By Region, 2018-2022
8.3. Current Market Size Value (US$ Bn) & Volume (MT) Analysis and Forecast By Region, 2023-2033
8.3.1. North America
8.3.2. Latin America
8.3.3. Europe
8.3.4. East Asia
8.3.5. South Asia
8.3.6. Oceania
8.3.7. MEA
8.4. Market Attractiveness Analysis By Region
9. North America Market Analysis 2018-2022 and Forecast 2023-2033, By Country
9.1. Historical Market Size Value (US$ Bn) & Volume (MT) Trend Analysis By Market Taxonomy, 2018-2022
9.2. Market Size Value (US$ Bn) & Volume (MT) Forecast By Market Taxonomy, 2023-2033
9.2.1. By Country
9.2.1.1. U.S.
9.2.1.2. Canada
9.2.2. By Material Type
9.2.3. By Product
9.2.4. By Application
9.3. Market Attractiveness Analysis
9.3.1. By Country
9.3.2. By Material Type
9.3.3. By Product
9.3.4. By Application
9.4. Key Takeaways
10. Latin America Market Analysis 2018-2022 and Forecast 2023-2033, By Country
10.1. Historical Market Size Value (US$ Bn) & Volume (MT) Trend Analysis By Market Taxonomy, 2018-2022
10.2. Market Size Value (US$ Bn) & Volume (MT) Forecast By Market Taxonomy, 2023-2033
10.2.1. By Country
10.2.1.1. Brazil
10.2.1.2. Mexico
10.2.1.3. Argentina
10.2.1.4. Chile
10.2.1.5. Peru
10.2.1.6. Rest of Latin America
10.2.2. By Material Type
10.2.3. By Product
10.2.4. By Application
10.3. Market Attractiveness Analysis
10.3.1. By Country
10.3.2. By Material Type
10.3.3. By Product
10.3.4. By Application
10.4. Key Takeaways
11. Europe Market Analysis 2018-2022 and Forecast 2023-2033, By Country
11.1. Historical Market Size Value (US$ Bn) & Volume (MT) Trend Analysis By Market Taxonomy, 2018-2022
11.2. Market Size Value (US$ Bn) & Volume (MT) Forecast By Market Taxonomy, 2023-2033
11.2.1. By Country
11.2.1.1. Germany
11.2.1.2. Italy
11.2.1.3. France
11.2.1.4. U.K.
11.2.1.5. Spain
11.2.1.6. Russia
11.2.1.7. BENELUX
11.2.1.8. Poland
11.2.1.9. Nordic Countries
11.2.1.10. Rest of Europe
11.2.2. By Material Type
11.2.3. By Product
11.2.4. By Application
11.3. Market Attractiveness Analysis
11.3.1. By Country
11.3.2. By Material Type
11.3.3. By Product
11.3.4. By Application
11.4. Key Takeaways
12. East Asia Market Analysis 2018-2022 and Forecast 2023-2033, By Country
12.1. Historical Market Size Value (US$ Bn) & Volume (MT) Trend Analysis By Market Taxonomy, 2018-2022
12.2. Market Size Value (US$ Bn) & Volume (MT) Forecast By Market Taxonomy, 2023-2033
12.2.1. By Country
12.2.1.1. China
12.2.1.2. Japan
12.2.1.3. South Korea
12.2.2. By Material Type
12.2.3. By Product
12.2.4. By Application
12.3. Market Attractiveness Analysis
12.3.1. By Country
12.3.2. By Material Type
12.3.3. By Product
12.3.4. By Application
12.4. Key Takeaways
13. South Asia Market Analysis 2018-2022 and Forecast 2023-2033, By Country
13.1. Historical Market Size Value (US$ Bn) & Volume (MT) Trend Analysis By Market Taxonomy, 2018-2022
13.2. Market Size Value (US$ Bn) & Volume (MT) Forecast By Market Taxonomy, 2023-2033
13.2.1. By Country
13.2.1.1. India
13.2.1.2. Thailand
13.2.1.3. Malaysia
13.2.1.4. Indonesia
13.2.1.5. Singapore
13.2.1.6. Rest of South Asia
13.2.2. By Material Type
13.2.3. By Product
13.2.4. By Application
13.3. Market Attractiveness Analysis
13.3.1. By Country
13.3.2. By Material Type
13.3.3. By Product
13.3.4. By Application
13.4. Key Takeaways
14. Oceania Market Analysis 2018-2022 and Forecast 2023-2033, By Country
14.1. Historical Market Size Value (US$ Bn) & Volume (MT) Trend Analysis By Market Taxonomy, 2018-2022
14.2. Market Size Value (US$ Bn) & Volume (MT) Forecast By Market Taxonomy, 2023-2033
14.2.1. By Country
14.2.1.1. Australia
14.2.1.2. New Zealand
14.2.2. By Material Type
14.2.3. By Product
14.2.4. By Application
14.3. Market Attractiveness Analysis
14.3.1. By Country
14.3.2. By Material Type
14.3.3. By Product
14.3.4. By Application
14.4. Key Takeaways
15. MEA Market Analysis 2018-2022 and Forecast 2023-2033, By Country
15.1. Historical Market Size Value (US$ Bn) & Volume (MT) Trend Analysis By Market Taxonomy, 2018-2022
15.2. Market Size Value (US$ Bn) & Volume (MT) Forecast By Market Taxonomy, 2023-2033
15.2.1. By Country
15.2.1.1. GCC Countries
15.2.1.2. South Africa
15.2.1.3. Central Africa
15.2.1.4. North Africa
15.2.2. By Material Type
15.2.3. By Product
15.2.4. By Application
15.3. Market Attractiveness Analysis
15.3.1. By Country
15.3.2. By Material Type
15.3.3. By Product
15.3.4. By Application
15.4. Key Takeaways
16. Key Countries Market Analysis
16.1. U.S.
16.1.1. Pricing Analysis
16.1.2. Market Share Analysis, 2022
16.1.2.1. By Material Type
16.1.2.2. By Product
16.1.2.3. By Application
16.2. Canada
16.2.1. Pricing Analysis
16.2.2. Market Share Analysis, 2022
16.2.2.1. By Material Type
16.2.2.2. By Product
16.2.2.3. By Application
16.3. Brazil
16.3.1. Pricing Analysis
16.3.2. Market Share Analysis, 2022
16.3.2.1. By Material Type
16.3.2.2. By Product
16.3.2.3. By Application
16.4. Mexico
16.4.1. Pricing Analysis
16.4.2. Market Share Analysis, 2022
16.4.2.1. By Material Type
16.4.2.2. By Product
16.4.2.3. By Application
16.5. Argentina
16.5.1. Pricing Analysis
16.5.2. Market Share Analysis, 2022
16.5.2.1. By Material Type
16.5.2.2. By Product
16.5.2.3. By Application
16.6. Chile
16.6.1. Pricing Analysis
16.6.2. Market Share Analysis, 2022
16.6.2.1. By Material Type
16.6.2.2. By Product
16.6.2.3. By Application
16.7. Peru
16.7.1. Pricing Analysis
16.7.2. Market Share Analysis, 2022
16.7.2.1. By Material Type
16.7.2.2. By Product
16.7.2.3. By Application
16.8. Germany
16.8.1. Pricing Analysis
16.8.2. Market Share Analysis, 2022
16.8.2.1. By Material Type
16.8.2.2. By Product
16.8.2.3. By Application
16.9. Italy
16.9.1. Pricing Analysis
16.9.2. Market Share Analysis, 2022
16.9.2.1. By Material Type
16.9.2.2. By Product
16.9.2.3. By Application
16.10. France
16.10.1. Pricing Analysis
16.10.2. Market Share Analysis, 2022
16.10.2.1. By Material Type
16.10.2.2. By Product
16.10.2.3. By Application
16.11. Spain
16.11.1. Pricing Analysis
16.11.2. Market Share Analysis, 2022
16.11.2.1. By Material Type
16.11.2.2. By Product
16.11.2.3. By Application
16.12. U.K.
16.12.1. Pricing Analysis
16.12.2. Market Share Analysis, 2022
16.12.2.1. By Material Type
16.12.2.2. By Product
16.12.2.3. By Application
16.13. Russia
16.13.1. Pricing Analysis
16.13.2. Market Share Analysis, 2022
16.13.2.1. By Material Type
16.13.2.2. By Product
16.13.2.3. By Application
16.14. Poland
16.14.1. Pricing Analysis
16.14.2. Market Share Analysis, 2022
16.14.2.1. By Material Type
16.14.2.2. By Product
16.14.2.3. By Application
16.15. BENELUX
16.15.1. Pricing Analysis
16.15.2. Market Share Analysis, 2022
16.15.2.1. By Material Type
16.15.2.2. By Product
16.15.2.3. By Application
16.16. Nordic Countries
16.16.1. Pricing Analysis
16.16.2. Market Share Analysis, 2022
16.16.2.1. By Material Type
16.16.2.2. By Product
16.16.2.3. By Application
16.17. China
16.17.1. Pricing Analysis
16.17.2. Market Share Analysis, 2022
16.17.2.1. By Material Type
16.17.2.2. By Product
16.17.2.3. By Application
16.18. Japan
16.18.1. Pricing Analysis
16.18.2. Market Share Analysis, 2022
16.18.2.1. By Material Type
16.18.2.2. By Product
16.18.2.3. By Application
16.19. South Korea
16.19.1. Pricing Analysis
16.19.2. Market Share Analysis, 2022
16.19.2.1. By Material Type
16.19.2.2. By Product
16.19.2.3. By Application
16.20. India
16.20.1. Pricing Analysis
16.20.2. Market Share Analysis, 2022
16.20.2.1. By Material Type
16.20.2.2. By Product
16.20.2.3. By Application
16.21. Thailand
16.21.1. Pricing Analysis
16.21.2. Market Share Analysis, 2022
16.21.2.1. By Material Type
16.21.2.2. By Product
16.21.2.3. By Application
16.22. Indonesia
16.22.1. Pricing Analysis
16.22.2. Market Share Analysis, 2022
16.22.2.1. By Material Type
16.22.2.2. By Product
16.22.2.3. By Application
16.23. Malaysia
16.23.1. Pricing Analysis
16.23.2. Market Share Analysis, 2022
16.23.2.1. By Material Type
16.23.2.2. By Product
16.23.2.3. By Application
16.24. Singapore
16.24.1. Pricing Analysis
16.24.2. Market Share Analysis, 2022
16.24.2.1. By Material Type
16.24.2.2. By Product
16.24.2.3. By Application
16.25. Australia
16.25.1. Pricing Analysis
16.25.2. Market Share Analysis, 2022
16.25.2.1. By Material Type
16.25.2.2. By Product
16.25.2.3. By Application
16.26. New Zealand
16.26.1. Pricing Analysis
16.26.2. Market Share Analysis, 2022
16.26.2.1. By Material Type
16.26.2.2. By Product
16.26.2.3. By Application
16.27. GCC Countries
16.27.1. Pricing Analysis
16.27.2. Market Share Analysis, 2022
16.27.2.1. By Material Type
16.27.2.2. By Product
16.27.2.3. By Application
16.28. South Africa
16.28.1. Pricing Analysis
16.28.2. Market Share Analysis, 2022
16.28.2.1. By Material Type
16.28.2.2. By Product
16.28.2.3. By Application
16.29. North Africa
16.29.1. Pricing Analysis
16.29.2. Market Share Analysis, 2022
16.29.2.1. By Material Type
16.29.2.2. By Product
16.29.2.3. By Application
16.30. Central Africa
16.30.1. Pricing Analysis
16.30.2. Market Share Analysis, 2022
16.30.2.1. By Material Type
16.30.2.2. By Product
16.30.2.3. By Application
17. Market Structure Analysis
17.1. Competition Dashboard
17.2. Competition Benchmarking
17.3. Market Share Analysis of Top Players
17.3.1. By Regional
17.3.2. By Material Type
17.3.3. By Product
17.3.4. By Application
18. Competition Analysis
18.1. Competition Deep Dive
18.1.1. Cambridge Silversmiths
18.1.1.1. Overview
18.1.1.2. Product Portfolio
18.1.1.3. Profitability by Market Segments (Material Type/Product/Application/Region)
18.1.1.4. Sales Footprint
18.1.1.5. Strategy Overview
18.1.1.5.1. Marketing Strategy
18.1.1.5.2. Product Strategy
18.1.1.5.3. Channel Strategy
18.1.2. Wüsthof
18.1.2.1. Overview
18.1.2.2. Product Portfolio
18.1.2.3. Profitability by Market Segments (Material Type/Product/Application/Region)
18.1.2.4. Sales Footprint
18.1.2.5. Strategy Overview
18.1.2.5.1. Marketing Strategy
18.1.2.5.2. Product Strategy
18.1.2.5.3. Channel Strategy
18.1.3. Messermiester
18.1.3.1. Overview
18.1.3.2. Product Portfolio
18.1.3.3. Profitability by Market Segments (Material Type/Product/Application/Region)
18.1.3.4. Sales Footprint
18.1.3.5. Strategy Overview
18.1.3.5.1. Marketing Strategy
18.1.3.5.2. Product Strategy
18.1.3.5.3. Channel Strategy
18.1.4. Royal Doulton
18.1.4.1. Overview
18.1.4.2. Product Portfolio
18.1.4.3. Profitability by Market Segments (Material Type/Product/Application/Region)
18.1.4.4. Sales Footprint
18.1.4.5. Strategy Overview
18.1.4.5.1. Marketing Strategy
18.1.4.5.2. Product Strategy
18.1.4.5.3. Channel Strategy
18.1.5. Farberware
18.1.5.1. Overview
18.1.5.2. Product Portfolio
18.1.5.3. Profitability by Market Segments (Material Type/Product/Application/Region)
18.1.5.4. Sales Footprint
18.1.5.5. Strategy Overview
18.1.5.5.1. Marketing Strategy
18.1.5.5.2. Product Strategy
18.1.5.5.3. Channel Strategy
18.1.6. Denby Pottery Company Ltd.
18.1.6.1. Overview
18.1.6.2. Product Portfolio
18.1.6.3. Profitability by Market Segments (Material Type/Product/Application/Region)
18.1.6.4. Sales Footprint
18.1.6.5. Strategy Overview
18.1.6.5.1. Marketing Strategy
18.1.6.5.2. Product Strategy
18.1.6.5.3. Channel Strategy
18.1.7. Multifunction Tools & Knives
18.1.7.1. Overview
18.1.7.2. Product Portfolio
18.1.7.3. Profitability by Market Segments (Material Type/Product/Application/Region)
18.1.7.4. Sales Footprint
18.1.7.5. Strategy Overview
18.1.7.5.1. Marketing Strategy
18.1.7.5.2. Product Strategy
18.1.7.5.3. Channel Strategy
18.1.8. Oneida
18.1.8.1. Overview
18.1.8.2. Product Portfolio
18.1.8.3. Profitability by Market Segments (Material Type/Product/Application/Region)
18.1.8.4. Sales Footprint
18.1.8.5. Strategy Overview
18.1.8.5.1. Marketing Strategy
18.1.8.5.2. Product Strategy
18.1.8.5.3. Channel Strategy
18.1.9. Villeroy & Bosch AG
18.1.9.1. Overview
18.1.9.2. Product Portfolio
18.1.9.3. Profitability by Market Segments (Material Type/Product/Application/Region)
18.1.9.4. Sales Footprint
18.1.9.5. Strategy Overview
18.1.9.5.1. Marketing Strategy
18.1.9.5.2. Product Strategy
18.1.9.5.3. Channel Strategy
18.1.10. Steelite International
18.1.10.1. Overview
18.1.10.2. Product Portfolio
18.1.10.3. Profitability by Market Segments (Material Type/Product/Application/Region)
18.1.10.4. Sales Footprint
18.1.10.5. Strategy Overview
18.1.10.5.1. Marketing Strategy
18.1.10.5.2. Product Strategy
18.1.10.5.3. Channel Strategy
18.1.11. Zwilling JA Henkels
18.1.11.1. Overview
18.1.11.2. Product Portfolio
18.1.11.3. Profitability by Market Segments (Material Type/Product/Application/Region)
18.1.11.4. Sales Footprint
18.1.11.5. Strategy Overview
18.1.11.5.1. Marketing Strategy
18.1.11.5.2. Product Strategy
18.1.11.5.3. Channel Strategy
18.1.12. Churchill China Ltd.
18.1.12.1. Overview
18.1.12.2. Product Portfolio
18.1.12.3. Profitability by Market Segments (Material Type/Product/Application/Region)
18.1.12.4. Sales Footprint
18.1.12.5. Strategy Overview
18.1.12.5.1. Marketing Strategy
18.1.12.5.2. Product Strategy
18.1.12.5.3. Channel Strategy
18.1.13. Dexter-Russel
18.1.13.1. Overview
18.1.13.2. Product Portfolio
18.1.13.3. Profitability by Market Segments (Material Type/Product/Application/Region)
18.1.13.4. Sales Footprint
18.1.13.5. Strategy Overview
18.1.13.5.1. Marketing Strategy
18.1.13.5.2. Product Strategy
18.1.13.5.3. Channel Strategy
18.1.14. Victorinox
18.1.14.1. Overview
18.1.14.2. Product Portfolio
18.1.14.3. Profitability by Market Segments (Material Type/Product/Application/Region)
18.1.14.4. Sales Footprint
18.1.14.5. Strategy Overview
18.1.14.5.1. Marketing Strategy
18.1.14.5.2. Product Strategy
18.1.14.5.3. Channel Strategy
18.1.15. Hunting & Survival Knives
18.1.15.1. Overview
18.1.15.2. Product Portfolio
18.1.15.3. Profitability by Market Segments (Material Type/Product/Application/Region)
18.1.15.4. Sales Footprint
18.1.15.5. Strategy Overview
18.1.15.5.1. Marketing Strategy
18.1.15.5.2. Product Strategy
18.1.15.5.3. Channel Strategy
19. Assumptions & Acronyms Used
20. Research Methodology
Let us know your requirement to get
100% FREE customization
List of Tables
Table 1: Global Market Value (US$ Bn) Forecast by Region, 2018-2033
Table 2: Global Market Volume (MT) Forecast by Region, 2018-2033
Table 3: Global Market Value (US$ Bn) Forecast by Material Type, 2018-2033
Table 4: Global Market Volume (MT) Forecast by Material Type, 2018-2033
Table 5: Global Market Value (US$ Bn) Forecast by Product, 2018-2033
Table 6: Global Market Volume (MT) Forecast by Product, 2018-2033
Table 7: Global Market Value (US$ Bn) Forecast by Application, 2018-2033
Table 8: Global Market Volume (MT) Forecast by Application, 2018-2033
Table 9: North America Market Value (US$ Bn) Forecast by Country, 2018-2033
Table 10: North America Market Volume (MT) Forecast by Country, 2018-2033
Table 11: North America Market Value (US$ Bn) Forecast by Material Type, 2018-2033
Table 12: North America Market Volume (MT) Forecast by Material Type, 2018-2033
Table 13: North America Market Value (US$ Bn) Forecast by Product, 2018-2033
Table 14: North America Market Volume (MT) Forecast by Product, 2018-2033
Table 15: North America Market Value (US$ Bn) Forecast by Application, 2018-2033
Table 16: North America Market Volume (MT) Forecast by Application, 2018-2033
Table 17: Latin America Market Value (US$ Bn) Forecast by Country, 2018-2033
Table 18: Latin America Market Volume (MT) Forecast by Country, 2018-2033
Table 19: Latin America Market Value (US$ Bn) Forecast by Material Type, 2018-2033
Table 20: Latin America Market Volume (MT) Forecast by Material Type, 2018-2033
Table 21: Latin America Market Value (US$ Bn) Forecast by Product, 2018-2033
Table 22: Latin America Market Volume (MT) Forecast by Product, 2018-2033
Table 23: Latin America Market Value (US$ Bn) Forecast by Application, 2018-2033
Table 24: Latin America Market Volume (MT) Forecast by Application, 2018-2033
Table 25: Europe Market Value (US$ Bn) Forecast by Country, 2018-2033
Table 26: Europe Market Volume (MT) Forecast by Country, 2018-2033
Table 27: Europe Market Value (US$ Bn) Forecast by Material Type, 2018-2033
Table 28: Europe Market Volume (MT) Forecast by Material Type, 2018-2033
Table 29: Europe Market Value (US$ Bn) Forecast by Product, 2018-2033
Table 30: Europe Market Volume (MT) Forecast by Product, 2018-2033
Table 31: Europe Market Value (US$ Bn) Forecast by Application, 2018-2033
Table 32: Europe Market Volume (MT) Forecast by Application, 2018-2033
Table 33: East Asia Market Value (US$ Bn) Forecast by Country, 2018-2033
Table 34: East Asia Market Volume (MT) Forecast by Country, 2018-2033
Table 35: East Asia Market Value (US$ Bn) Forecast by Material Type, 2018-2033
Table 36: East Asia Market Volume (MT) Forecast by Material Type, 2018-2033
Table 37: East Asia Market Value (US$ Bn) Forecast by Product, 2018-2033
Table 38: East Asia Market Volume (MT) Forecast by Product, 2018-2033
Table 39: East Asia Market Value (US$ Bn) Forecast by Application, 2018-2033
Table 40: East Asia Market Volume (MT) Forecast by Application, 2018-2033
Table 41: South Asia Market Value (US$ Bn) Forecast by Country, 2018-2033
Table 42: South Asia Market Volume (MT) Forecast by Country, 2018-2033
Table 43: South Asia Market Value (US$ Bn) Forecast by Material Type, 2018-2033
Table 44: South Asia Market Volume (MT) Forecast by Material Type, 2018-2033
Table 45: South Asia Market Value (US$ Bn) Forecast by Product, 2018-2033
Table 46: South Asia Market Volume (MT) Forecast by Product, 2018-2033
Table 47: South Asia Market Value (US$ Bn) Forecast by Application, 2018-2033
Table 48: South Asia Market Volume (MT) Forecast by Application, 2018-2033
Table 49: Oceania Market Value (US$ Bn) Forecast by Country, 2018-2033
Table 50: Oceania Market Volume (MT) Forecast by Country, 2018-2033
Table 51: Oceania Market Value (US$ Bn) Forecast by Material Type, 2018-2033
Table 52: Oceania Market Volume (MT) Forecast by Material Type, 2018-2033
Table 53: Oceania Market Value (US$ Bn) Forecast by Product, 2018-2033
Table 54: Oceania Market Volume (MT) Forecast by Product, 2018-2033
Table 55: Oceania Market Value (US$ Bn) Forecast by Application, 2018-2033
Table 56: Oceania Market Volume (MT) Forecast by Application, 2018-2033
Table 57: MEA Market Value (US$ Bn) Forecast by Country, 2018-2033
Table 58: MEA Market Volume (MT) Forecast by Country, 2018-2033
Table 59: MEA Market Value (US$ Bn) Forecast by Material Type, 2018-2033
Table 60: MEA Market Volume (MT) Forecast by Material Type, 2018-2033
Table 61: MEA Market Value (US$ Bn) Forecast by Product, 2018-2033
Table 62: MEA Market Volume (MT) Forecast by Product, 2018-2033
Table 63: MEA Market Value (US$ Bn) Forecast by Application, 2018-2033
Table 64: MEA Market Volume (MT) Forecast by Application, 2018-2033
Find your sweet spots for generating winning opportunities in this market.
Talk to AnalystList of Charts
Figure 1: Global Market Value (US$ Bn) by Material Type, 2023-2033
Figure 2: Global Market Value (US$ Bn) by Product, 2023-2033
Figure 3: Global Market Value (US$ Bn) by Application, 2023-2033
Figure 4: Global Market Value (US$ Bn) by Region, 2023-2033
Figure 5: Global Market Value (US$ Bn) Analysis by Region, 2018-2033
Figure 6: Global Market Volume (MT) Analysis by Region, 2018-2033
Figure 7: Global Market Value Share (%) and BPS Analysis by Region, 2023-2033
Figure 8: Global Market Y-o-Y Growth (%) Projections by Region, 2023-2033
Figure 9: Global Market Value (US$ Bn) Analysis by Material Type, 2018-2033
Figure 10: Global Market Volume (MT) Analysis by Material Type, 2018-2033
Figure 11: Global Market Value Share (%) and BPS Analysis by Material Type, 2023-2033
Figure 12: Global Market Y-o-Y Growth (%) Projections by Material Type, 2023-2033
Figure 13: Global Market Value (US$ Bn) Analysis by Product, 2018-2033
Figure 14: Global Market Volume (MT) Analysis by Product, 2018-2033
Figure 15: Global Market Value Share (%) and BPS Analysis by Product, 2023-2033
Figure 16: Global Market Y-o-Y Growth (%) Projections by Product, 2023-2033
Figure 17: Global Market Value (US$ Bn) Analysis by Application, 2018-2033
Figure 18: Global Market Volume (MT) Analysis by Application, 2018-2033
Figure 19: Global Market Value Share (%) and BPS Analysis by Application, 2023-2033
Figure 20: Global Market Y-o-Y Growth (%) Projections by Application, 2023-2033
Figure 21: Global Market Attractiveness by Material Type, 2023-2033
Figure 22: Global Market Attractiveness by Product, 2023-2033
Figure 23: Global Market Attractiveness by Application, 2023-2033
Figure 24: Global Market Attractiveness by Region, 2023-2033
Figure 25: North America Market Value (US$ Bn) by Material Type, 2023-2033
Figure 26: North America Market Value (US$ Bn) by Product, 2023-2033
Figure 27: North America Market Value (US$ Bn) by Application, 2023-2033
Figure 28: North America Market Value (US$ Bn) by Country, 2023-2033
Figure 29: North America Market Value (US$ Bn) Analysis by Country, 2018-2033
Figure 30: North America Market Volume (MT) Analysis by Country, 2018-2033
Figure 31: North America Market Value Share (%) and BPS Analysis by Country, 2023-2033
Figure 32: North America Market Y-o-Y Growth (%) Projections by Country, 2023-2033
Figure 33: North America Market Value (US$ Bn) Analysis by Material Type, 2018-2033
Figure 34: North America Market Volume (MT) Analysis by Material Type, 2018-2033
Figure 35: North America Market Value Share (%) and BPS Analysis by Material Type, 2023-2033
Figure 36: North America Market Y-o-Y Growth (%) Projections by Material Type, 2023-2033
Figure 37: North America Market Value (US$ Bn) Analysis by Product, 2018-2033
Figure 38: North America Market Volume (MT) Analysis by Product, 2018-2033
Figure 39: North America Market Value Share (%) and BPS Analysis by Product, 2023-2033
Figure 40: North America Market Y-o-Y Growth (%) Projections by Product, 2023-2033
Figure 41: North America Market Value (US$ Bn) Analysis by Application, 2018-2033
Figure 42: North America Market Volume (MT) Analysis by Application, 2018-2033
Figure 43: North America Market Value Share (%) and BPS Analysis by Application, 2023-2033
Figure 44: North America Market Y-o-Y Growth (%) Projections by Application, 2023-2033
Figure 45: North America Market Attractiveness by Material Type, 2023-2033
Figure 46: North America Market Attractiveness by Product, 2023-2033
Figure 47: North America Market Attractiveness by Application, 2023-2033
Figure 48: North America Market Attractiveness by Country, 2023-2033
Figure 49: Latin America Market Value (US$ Bn) by Material Type, 2023-2033
Figure 50: Latin America Market Value (US$ Bn) by Product, 2023-2033
Figure 51: Latin America Market Value (US$ Bn) by Application, 2023-2033
Figure 52: Latin America Market Value (US$ Bn) by Country, 2023-2033
Figure 53: Latin America Market Value (US$ Bn) Analysis by Country, 2018-2033
Figure 54: Latin America Market Volume (MT) Analysis by Country, 2018-2033
Figure 55: Latin America Market Value Share (%) and BPS Analysis by Country, 2023-2033
Figure 56: Latin America Market Y-o-Y Growth (%) Projections by Country, 2023-2033
Figure 57: Latin America Market Value (US$ Bn) Analysis by Material Type, 2018-2033
Figure 58: Latin America Market Volume (MT) Analysis by Material Type, 2018-2033
Figure 59: Latin America Market Value Share (%) and BPS Analysis by Material Type, 2023-2033
Figure 60: Latin America Market Y-o-Y Growth (%) Projections by Material Type, 2023-2033
Figure 61: Latin America Market Value (US$ Bn) Analysis by Product, 2018-2033
Figure 62: Latin America Market Volume (MT) Analysis by Product, 2018-2033
Figure 63: Latin America Market Value Share (%) and BPS Analysis by Product, 2023-2033
Figure 64: Latin America Market Y-o-Y Growth (%) Projections by Product, 2023-2033
Figure 65: Latin America Market Value (US$ Bn) Analysis by Application, 2018-2033
Figure 66: Latin America Market Volume (MT) Analysis by Application, 2018-2033
Figure 67: Latin America Market Value Share (%) and BPS Analysis by Application, 2023-2033
Figure 68: Latin America Market Y-o-Y Growth (%) Projections by Application, 2023-2033
Figure 69: Latin America Market Attractiveness by Material Type, 2023-2033
Figure 70: Latin America Market Attractiveness by Product, 2023-2033
Figure 71: Latin America Market Attractiveness by Application, 2023-2033
Figure 72: Latin America Market Attractiveness by Country, 2023-2033
Figure 73: Europe Market Value (US$ Bn) by Material Type, 2023-2033
Figure 74: Europe Market Value (US$ Bn) by Product, 2023-2033
Figure 75: Europe Market Value (US$ Bn) by Application, 2023-2033
Figure 76: Europe Market Value (US$ Bn) by Country, 2023-2033
Figure 77: Europe Market Value (US$ Bn) Analysis by Country, 2018-2033
Figure 78: Europe Market Volume (MT) Analysis by Country, 2018-2033
Figure 79: Europe Market Value Share (%) and BPS Analysis by Country, 2023-2033
Figure 80: Europe Market Y-o-Y Growth (%) Projections by Country, 2023-2033
Figure 81: Europe Market Value (US$ Bn) Analysis by Material Type, 2018-2033
Figure 82: Europe Market Volume (MT) Analysis by Material Type, 2018-2033
Figure 83: Europe Market Value Share (%) and BPS Analysis by Material Type, 2023-2033
Figure 84: Europe Market Y-o-Y Growth (%) Projections by Material Type, 2023-2033
Figure 85: Europe Market Value (US$ Bn) Analysis by Product, 2018-2033
Figure 86: Europe Market Volume (MT) Analysis by Product, 2018-2033
Figure 87: Europe Market Value Share (%) and BPS Analysis by Product, 2023-2033
Figure 88: Europe Market Y-o-Y Growth (%) Projections by Product, 2023-2033
Figure 89: Europe Market Value (US$ Bn) Analysis by Application, 2018-2033
Figure 90: Europe Market Volume (MT) Analysis by Application, 2018-2033
Figure 91: Europe Market Value Share (%) and BPS Analysis by Application, 2023-2033
Figure 92: Europe Market Y-o-Y Growth (%) Projections by Application, 2023-2033
Figure 93: Europe Market Attractiveness by Material Type, 2023-2033
Figure 94: Europe Market Attractiveness by Product, 2023-2033
Figure 95: Europe Market Attractiveness by Application, 2023-2033
Figure 96: Europe Market Attractiveness by Country, 2023-2033
Figure 97: East Asia Market Value (US$ Bn) by Material Type, 2023-2033
Figure 98: East Asia Market Value (US$ Bn) by Product, 2023-2033
Figure 99: East Asia Market Value (US$ Bn) by Application, 2023-2033
Figure 100: East Asia Market Value (US$ Bn) by Country, 2023-2033
Figure 101: East Asia Market Value (US$ Bn) Analysis by Country, 2018-2033
Figure 102: East Asia Market Volume (MT) Analysis by Country, 2018-2033
Figure 103: East Asia Market Value Share (%) and BPS Analysis by Country, 2023-2033
Figure 104: East Asia Market Y-o-Y Growth (%) Projections by Country, 2023-2033
Figure 105: East Asia Market Value (US$ Bn) Analysis by Material Type, 2018-2033
Figure 106: East Asia Market Volume (MT) Analysis by Material Type, 2018-2033
Figure 107: East Asia Market Value Share (%) and BPS Analysis by Material Type, 2023-2033
Figure 108: East Asia Market Y-o-Y Growth (%) Projections by Material Type, 2023-2033
Figure 109: East Asia Market Value (US$ Bn) Analysis by Product, 2018-2033
Figure 110: East Asia Market Volume (MT) Analysis by Product, 2018-2033
Figure 111: East Asia Market Value Share (%) and BPS Analysis by Product, 2023-2033
Figure 112: East Asia Market Y-o-Y Growth (%) Projections by Product, 2023-2033
Figure 113: East Asia Market Value (US$ Bn) Analysis by Application, 2018-2033
Figure 114: East Asia Market Volume (MT) Analysis by Application, 2018-2033
Figure 115: East Asia Market Value Share (%) and BPS Analysis by Application, 2023-2033
Figure 116: East Asia Market Y-o-Y Growth (%) Projections by Application, 2023-2033
Figure 117: East Asia Market Attractiveness by Material Type, 2023-2033
Figure 118: East Asia Market Attractiveness by Product, 2023-2033
Figure 119: East Asia Market Attractiveness by Application, 2023-2033
Figure 120: East Asia Market Attractiveness by Country, 2023-2033
Figure 121: South Asia Market Value (US$ Bn) by Material Type, 2023-2033
Figure 122: South Asia Market Value (US$ Bn) by Product, 2023-2033
Figure 123: South Asia Market Value (US$ Bn) by Application, 2023-2033
Figure 124: South Asia Market Value (US$ Bn) by Country, 2023-2033
Figure 125: South Asia Market Value (US$ Bn) Analysis by Country, 2018-2033
Figure 126: South Asia Market Volume (MT) Analysis by Country, 2018-2033
Figure 127: South Asia Market Value Share (%) and BPS Analysis by Country, 2023-2033
Figure 128: South Asia Market Y-o-Y Growth (%) Projections by Country, 2023-2033
Figure 129: South Asia Market Value (US$ Bn) Analysis by Material Type, 2018-2033
Figure 130: South Asia Market Volume (MT) Analysis by Material Type, 2018-2033
Figure 131: South Asia Market Value Share (%) and BPS Analysis by Material Type, 2023-2033
Figure 132: South Asia Market Y-o-Y Growth (%) Projections by Material Type, 2023-2033
Figure 133: South Asia Market Value (US$ Bn) Analysis by Product, 2018-2033
Figure 134: South Asia Market Volume (MT) Analysis by Product, 2018-2033
Figure 135: South Asia Market Value Share (%) and BPS Analysis by Product, 2023-2033
Figure 136: South Asia Market Y-o-Y Growth (%) Projections by Product, 2023-2033
Figure 137: South Asia Market Value (US$ Bn) Analysis by Application, 2018-2033
Figure 138: South Asia Market Volume (MT) Analysis by Application, 2018-2033
Figure 139: South Asia Market Value Share (%) and BPS Analysis by Application, 2023-2033
Figure 140: South Asia Market Y-o-Y Growth (%) Projections by Application, 2023-2033
Figure 141: South Asia Market Attractiveness by Material Type, 2023-2033
Figure 142: South Asia Market Attractiveness by Product, 2023-2033
Figure 143: South Asia Market Attractiveness by Application, 2023-2033
Figure 144: South Asia Market Attractiveness by Country, 2023-2033
Figure 145: Oceania Market Value (US$ Bn) by Material Type, 2023-2033
Figure 146: Oceania Market Value (US$ Bn) by Product, 2023-2033
Figure 147: Oceania Market Value (US$ Bn) by Application, 2023-2033
Figure 148: Oceania Market Value (US$ Bn) by Country, 2023-2033
Figure 149: Oceania Market Value (US$ Bn) Analysis by Country, 2018-2033
Figure 150: Oceania Market Volume (MT) Analysis by Country, 2018-2033
Figure 151: Oceania Market Value Share (%) and BPS Analysis by Country, 2023-2033
Figure 152: Oceania Market Y-o-Y Growth (%) Projections by Country, 2023-2033
Figure 153: Oceania Market Value (US$ Bn) Analysis by Material Type, 2018-2033
Figure 154: Oceania Market Volume (MT) Analysis by Material Type, 2018-2033
Figure 155: Oceania Market Value Share (%) and BPS Analysis by Material Type, 2023-2033
Figure 156: Oceania Market Y-o-Y Growth (%) Projections by Material Type, 2023-2033
Figure 157: Oceania Market Value (US$ Bn) Analysis by Product, 2018-2033
Figure 158: Oceania Market Volume (MT) Analysis by Product, 2018-2033
Figure 159: Oceania Market Value Share (%) and BPS Analysis by Product, 2023-2033
Figure 160: Oceania Market Y-o-Y Growth (%) Projections by Product, 2023-2033
Figure 161: Oceania Market Value (US$ Bn) Analysis by Application, 2018-2033
Figure 162: Oceania Market Volume (MT) Analysis by Application, 2018-2033
Figure 163: Oceania Market Value Share (%) and BPS Analysis by Application, 2023-2033
Figure 164: Oceania Market Y-o-Y Growth (%) Projections by Application, 2023-2033
Figure 165: Oceania Market Attractiveness by Material Type, 2023-2033
Figure 166: Oceania Market Attractiveness by Product, 2023-2033
Figure 167: Oceania Market Attractiveness by Application, 2023-2033
Figure 168: Oceania Market Attractiveness by Country, 2023-2033
Figure 169: MEA Market Value (US$ Bn) by Material Type, 2023-2033
Figure 170: MEA Market Value (US$ Bn) by Product, 2023-2033
Figure 171: MEA Market Value (US$ Bn) by Application, 2023-2033
Figure 172: MEA Market Value (US$ Bn) by Country, 2023-2033
Figure 173: MEA Market Value (US$ Bn) Analysis by Country, 2018-2033
Figure 174: MEA Market Volume (MT) Analysis by Country, 2018-2033
Figure 175: MEA Market Value Share (%) and BPS Analysis by Country, 2023-2033
Figure 176: MEA Market Y-o-Y Growth (%) Projections by Country, 2023-2033
Figure 177: MEA Market Value (US$ Bn) Analysis by Material Type, 2018-2033
Figure 178: MEA Market Volume (MT) Analysis by Material Type, 2018-2033
Figure 179: MEA Market Value Share (%) and BPS Analysis by Material Type, 2023-2033
Figure 180: MEA Market Y-o-Y Growth (%) Projections by Material Type, 2023-2033
Figure 181: MEA Market Value (US$ Bn) Analysis by Product, 2018-2033
Figure 182: MEA Market Volume (MT) Analysis by Product, 2018-2033
Figure 183: MEA Market Value Share (%) and BPS Analysis by Product, 2023-2033
Figure 184: MEA Market Y-o-Y Growth (%) Projections by Product, 2023-2033
Figure 185: MEA Market Value (US$ Bn) Analysis by Application, 2018-2033
Figure 186: MEA Market Volume (MT) Analysis by Application, 2018-2033
Figure 187: MEA Market Value Share (%) and BPS Analysis by Application, 2023-2033
Figure 188: MEA Market Y-o-Y Growth (%) Projections by Application, 2023-2033
Figure 189: MEA Market Attractiveness by Material Type, 2023-2033
Figure 190: MEA Market Attractiveness by Product, 2023-2033
Figure 191: MEA Market Attractiveness by Application, 2023-2033
Figure 192: MEA Market Attractiveness by Country, 2023-2033
Need specific information?
Request CustomizationExplore Process Automation Insights
View Reports