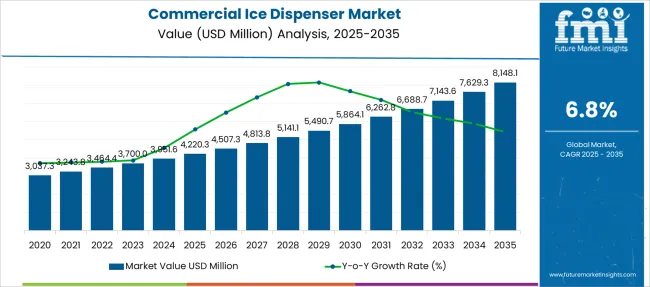
The Commercial Ice Dispenser Market is estimated to be valued at USD 4220.3 million in 2025 and is projected to reach USD 8148.1 million by 2035, registering a compound annual growth rate (CAGR) of 6.8% over the forecast period.
| Metric | Value |
|---|---|
| Commercial Ice Dispenser Market Estimated Value in (2025 E) | USD 4220.3 million |
| Commercial Ice Dispenser Market Forecast Value in (2035 F) | USD 8148.1 million |
| Forecast CAGR (2025 to 2035) | 6.8% |
The commercial ice dispenser market is witnessing consistent growth fueled by rising demand from the foodservice and hospitality sectors and the increasing need for hygienic ice dispensing solutions. Businesses are investing in automated and touchless machines to meet evolving sanitation standards and enhance operational efficiency.
Compact design innovations, energy efficiency improvements, and integration with filtration systems are strengthening the value proposition of modern dispensers. Regulatory emphasis on food safety and clean water standards has further encouraged the shift toward self-contained ice dispensing units.
The outlook remains positive as restaurants, quick service outlets, and healthcare facilities continue to prioritize convenience, hygiene, and performance in ice dispensing operations.
The market is segmented by Type, Size of Machine, Application, and Sales Channel and region. By Type, the market is divided into Countertop Ice Dispenser, Under-counter Ice Dispenser, and Freestanding Ice Dispenser. In terms of Size of Machine, the market is classified into Small, Medium, and Large. Based on Application, the market is segmented into Restaurants, Hotels & Motels, Hospitals & Clinics, and Others. By Sales Channel, the market is divided into Online and Offline. Regionally, the market is classified into North America, Latin America, Western Europe, Eastern Europe, Balkan & Baltic Countries, Russia & Belarus, Central Asia, East Asia, South Asia & Pacific, and the Middle East & Africa.
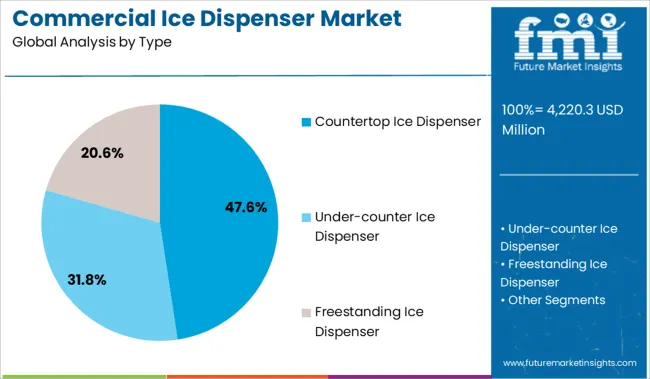
The countertop ice dispenser segment is projected to account for 47.60% of the total market revenue by 2025 within the type category, positioning it as the leading segment. Its compact footprint and user-friendly operation make it ideal for space-constrained environments such as cafes, office break rooms, and small restaurants.
These units offer easy installation and maintenance while ensuring consistent ice output and sanitary dispensing. Their popularity is further supported by the trend toward self-service models in foodservice and retail spaces.
As operators seek efficient and low-maintenance equipment that maximizes counter space, countertop dispensers continue to dominate the type segment.
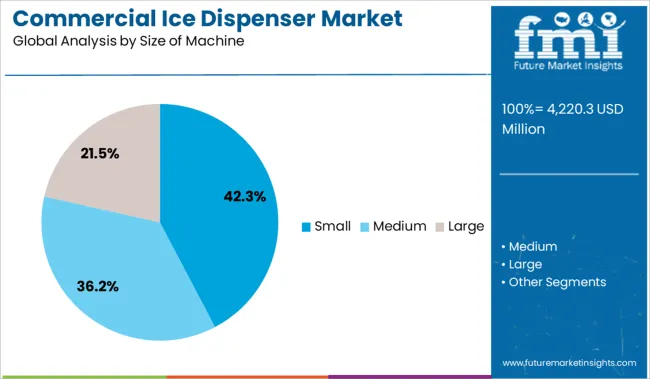
The small size of machine segment is expected to contribute 42.30% of the total revenue by 2025 under the size category. This preference is largely driven by growing adoption in small-format foodservice outlets, convenience stores, and healthcare settings where floor space is limited.
Smaller dispensers offer the dual benefit of affordability and functionality, allowing businesses to maintain high service standards without compromising on space. Their mobility and compatibility with existing setups make them attractive for locations requiring moderate volume output and frequent use.
This segment has gained prominence due to its alignment with modular kitchen trends and flexible layout configurations.
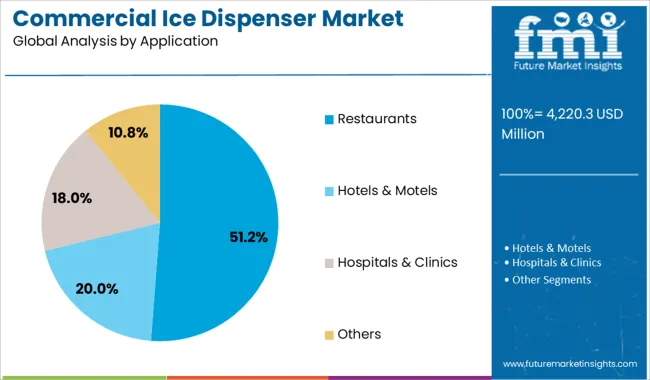
The restaurant application segment is projected to lead with 51.20% share of the total market revenue by 2025, making it the most significant end-use segment. This leadership is driven by the high volume of beverage service in restaurants, where consistent and clean ice supply is essential.
Restaurants are increasingly adopting commercial ice dispensers to meet hygiene standards, reduce manual handling, and enhance service speed. The machines’ ability to produce ice on demand supports operational efficiency during peak hours.
As consumer expectations rise around cleanliness and quality, restaurants continue to invest in reliable ice dispensing systems, securing their dominance in the application segment.
Surging frozen food market
Frozen food manufacturers make use of ice cubes to increase the shelf life of frozen food. Moreover, the market is also experiencing massive technological upgradation, which is expected to massively boost the sales of commercial ice dispensers during the forecast period.
Booming hospitality sector
A commercial ice dispenser can be a great addition to any business that relies on ice, such as restaurants, hotels, and cafes. There are many benefits to having a commercial ice dispenser, such as the ability to have a consistent supply of ice on hand, the convenience of being able to dispense ice without having to open a freezer, and the fact that it can help save money on energy costs.
Increasing disposable income and changing lifestyle
Increasing disposable income has led to a change in the lifestyle of the current generation, which has consequently led to an increase in the emergence of quick-service restaurants and cafes, which are some of the major factors driving the growth of the market.
This change in lifestyle because of rapid urbanization has led to more and more people consuming food and beverages from such restaurants, as they are left with almost no time to prepare food by themselves.
However, high initial investment and maintenance costs are some of the major factors restraining the growth of the commercial ice dispenser market. Nevertheless, technological advancements and product innovation are expected to create new opportunities for market growth in the future.
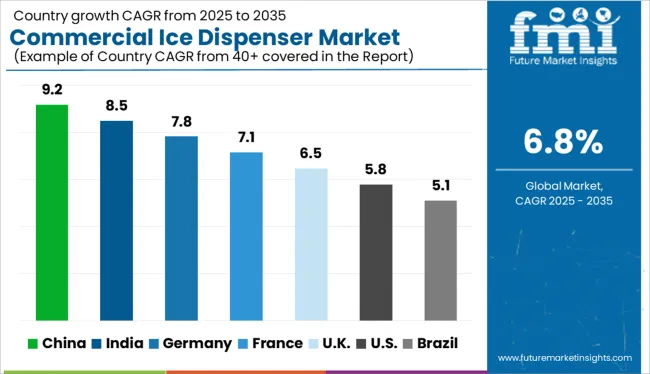
The commercial ice dispenser market in Europe is growing at a rapid pace due to the increasing demand for ice-based beverages. The market is expected to grow significantly in the coming years. The major players in the market are investing heavily in research and development to gain a competitive edge and to ensure that the dispensing machines produce ice cubes of any shape.
The market in Europe is highly competitive, with a large number of players. The major players in the market are focused on expanding their product portfolio and improving their distribution channels. They are also investing heavily in marketing and promotional activities to gain a larger share of the market.
The United Kingdom accumulates 22% of the total European market share.
Based on FMI research, the USA contributes 68% of total North American revenue for the commercial ice dispenser market.
Apart from being employed in the food and beverage sector, the healthcare sector has proven to be one of the major buyers of commercial ice dispensers. The USA healthcare sector is expected to grow at a CAGR of nearly 18% during the forecast period. The commercial ice dispensers produce nugget ice and flake ice, which are important from the healthcare perspective.
The nugget ice assists the patients in chewing ice for those who have a hard time swallowing water to stay hydrated. Apart from that, the flake ice that is generated by the commercial ice dispensers is used for providing cooling to areas like knees and elbows in case of injury.
Japan is believed to be the third largest consumer of coffee in the world by weight, and as of 2024, the Japanese coffee market was worth USD 38 billion.
Japanese love consuming cold coffee. This can be understood by the fact that chains like Starbucks, Tully’s Coffee, etc., have witnessed huge sales of cold coffee. This huge consumption certainly highlights the importance of commercial ice dispensers in Japan.
Apart from that, increased consumption of muqicha and melon soda as well are expected to boost the growth of the commercial ice dispenser market in Japan.
As of 2024, Korea was the third most preferred tourist destination in East Asia and generated close to USD 12 billion. This presents a huge opportunity for the hospitality sector in Korea, where tourists consume cold beverages in large numbers.
Tourists love consuming hwachae and soju, which make use of ice cubes in large quantities, as these are non-alcoholic punches but offer the same vibes as alcoholic drinks.
Based on a report published, it was found that close to 35% of youth in Korea suffer from anxiety issues. Thus, healthcare experts encourage the consumption of alcoholic drinks served with ice under prescribed conditions. This might well surge the growth of the commercial ice dispenser market in Korea.
Based on the data collected by FMI, the medium size commercial ice dispensers are expected to have the highest market share. The medium size dispensers offer the flexibility of relatively lower space and, at the same time, offer considerable volume for storing ice cubes.
These are being increasingly employed in restaurants and hotels because of the ability to provide the much-required balance between size and quantity. Apart from that, the medium size dispensers are being increasingly employed in hospitals and clinics as they provide sufficient ice cubes to be applied to the patients at a given point in time.
The hotels and motels segment is expected to dominate the segment because of the fact that this segment generally involves bulk purchases. Moreover, commercial ice dispensers are frequently purchased by luxury hotels because of the high consumption of beverages in these places.
Apart from that, the high purchasing power of certain players in the hotel market is expected to further expedite the commercial ice dispenser market share.
The online segment is expected to have the highest market share. Mobility of these services, coupled with cheap rates through online channels, are expected to be the main drivers.
Apart from that, the availability of a number of options in the online mode is another significant booster for the market growth.
The commercial ice dispenser market is currently dominated by key players. If we talk about the start-up space, it is relatively silent. But the market can prove to be as fit as a fiddle for those who want to invest in this business.
The rapidly surging food sector and hospitality sector presents a plethora of opportunities for this market. If start-up entrepreneurs make the best use of technology in providing unique solutions, then the market has a lot to offer. This, coupled with the right use of automation, would ensure that the market is generating the right mix of quality and quantity.
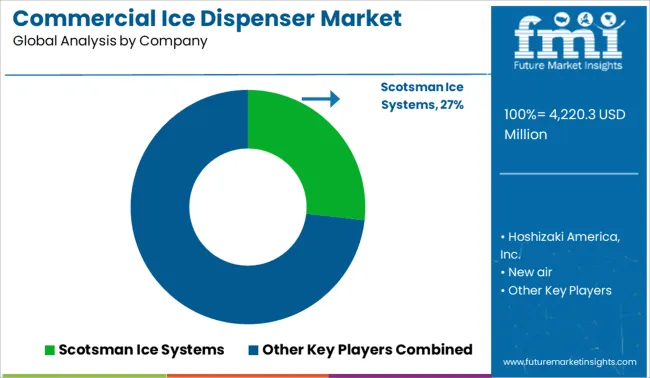
The commercial ice dispenser market is growing rapidly as businesses seek out more efficient ways to serve their customers. The competitive landscape is becoming increasingly crowded as companies vie for market share.
Product innovation and differentiation will be key to success in this market. Companies that can offer unique features and benefits that appeal to customers will be able to gain an advantage over their competitors.
Some of the recent developments are:
Scotsman Ice Systems, Hoshizaki America, and Cornelius Inc. Present the best solutions pertaining to the market
Scotsman has always been dedicated to developing next-generation technologies that make ice production more convenient, efficient, and reliable. They have been manufacturing compact nugget and flake ice machines.
The electronic control board provides easy-to-read machine status updates. Apart from that, the presence of QR codes provides easier access to manuals, care guides, and warranty information. The ice dispensers manufactured by Scotsman cool more quickly than other ice forms.
The ‘Essential Advantage’ offered by Scotsman includes maintenance-free bearing and making use of a stainless-steel evaporator for providing maximum durability.
Hoshizaki America is a name synonymous with quality, innovation, and reliability. It is all because of the strong leadership and the focus on teamwork that the company has been manufacturing top-notch products and services. They have also developed quality relationships with dealers, suppliers, distributors, employees, and service providers. This certainly makes Hoshizaki commercial ice maker one of the most sought-after machines.
Apart from that, the company has been working towards addressing and giving solutions for certain issues like increasing interest in climate change and environmental issues, food safety and security, and increased need for safety and health in food.
Cornelius Inc. has been the leader and innovator, and one of the most reliable customer-focused global beverage partners. They have been dedicatedly involved in continuous improvement, lifetime support, and maximizing the clients’ profit.
Moreover, the company has always worked towards being the most admired beverage dispensing solution partner for leading beverage brands. This has been done by understanding the needs of the customers while utilizing their expertise. With more than eight decades of experience in the beverage dispensing industry, Cornelius is a trusted solutions provider.
On 27th May’21, Cornelius launched IDC Pro Installation Genie, which is a self-guided tool to help technicians expedite field installation.
The global commercial ice dispenser market is estimated to be valued at USD 4,220.3 million in 2025.
The market size for the commercial ice dispenser market is projected to reach USD 8,148.1 million by 2035.
The commercial ice dispenser market is expected to grow at a 6.8% CAGR between 2025 and 2035.
The key product types in commercial ice dispenser market are countertop ice dispenser, under-counter ice dispenser and freestanding ice dispenser.
In terms of size of machine, small segment to command 42.3% share in the commercial ice dispenser market in 2025.


Our Research Products

The "Full Research Suite" delivers actionable market intel, deep dives on markets or technologies, so clients act faster, cut risk, and unlock growth.

The Leaderboard benchmarks and ranks top vendors, classifying them as Established Leaders, Leading Challengers, or Disruptors & Challengers.

Locates where complements amplify value and substitutes erode it, forecasting net impact by horizon

We deliver granular, decision-grade intel: market sizing, 5-year forecasts, pricing, adoption, usage, revenue, and operational KPIs—plus competitor tracking, regulation, and value chains—across 60 countries broadly.

Spot the shifts before they hit your P&L. We track inflection points, adoption curves, pricing moves, and ecosystem plays to show where demand is heading, why it is changing, and what to do next across high-growth markets and disruptive tech

Real-time reads of user behavior. We track shifting priorities, perceptions of today’s and next-gen services, and provider experience, then pace how fast tech moves from trial to adoption, blending buyer, consumer, and channel inputs with social signals (#WhySwitch, #UX).

Partner with our analyst team to build a custom report designed around your business priorities. From analysing market trends to assessing competitors or crafting bespoke datasets, we tailor insights to your needs.
Supplier Intelligence
Discovery & Profiling
Capacity & Footprint
Performance & Risk
Compliance & Governance
Commercial Readiness
Who Supplies Whom
Scorecards & Shortlists
Playbooks & Docs
Category Intelligence
Definition & Scope
Demand & Use Cases
Cost Drivers
Market Structure
Supply Chain Map
Trade & Policy
Operating Norms
Deliverables
Buyer Intelligence
Account Basics
Spend & Scope
Procurement Model
Vendor Requirements
Terms & Policies
Entry Strategy
Pain Points & Triggers
Outputs
Pricing Analysis
Benchmarks
Trends
Should-Cost
Indexation
Landed Cost
Commercial Terms
Deliverables
Brand Analysis
Positioning & Value Prop
Share & Presence
Customer Evidence
Go-to-Market
Digital & Reputation
Compliance & Trust
KPIs & Gaps
Outputs
Full Research Suite comprises of:
Market outlook & trends analysis
Interviews & case studies
Strategic recommendations
Vendor profiles & capabilities analysis
5-year forecasts
8 regions and 60+ country-level data splits
Market segment data splits
12 months of continuous data updates
DELIVERED AS:
PDF EXCEL ONLINE
Commercial and Industrial Rotating Rack Oven Market Size and Share Forecast Outlook 2025 to 2035
Commercial Baking Rack Oven Market Size and Share Forecast Outlook 2025 to 2035
Commercial Blast Freezer Market Size and Share Forecast Outlook 2025 to 2035
Commercial Water Heater Market Size and Share Forecast Outlook 2025 to 2035
Commercial High-Speed Oven Market Size and Share Forecast Outlook 2025 to 2035
Commercial Turboprop Aircrafts Market Size and Share Forecast Outlook 2025 to 2035
Commercial Vehicle Foundation Brakes Market Size and Share Forecast Outlook 2025 to 2035
Commercial Vehicle Brake Chambers Market Size and Share Forecast Outlook 2025 to 2035
Commercial Vehicles LED Bar Lights Market Size and Share Forecast Outlook 2025 to 2035
Commercial Vehicle AMT Transmission Market Size and Share Forecast Outlook 2025 to 2035
Commercial Greenhouse Market Size and Share Forecast Outlook 2025 to 2035
Commercial Vessel Market Size and Share Forecast Outlook 2025 to 2035
Commercial Slush Machine Market Size and Share Forecast Outlook 2025 to 2035
Commercial Medium Voltage Distribution Panel Market Size and Share Forecast Outlook 2025 to 2035
Commercial Earth Observation (CEO) Market Size and Share Forecast Outlook 2025 to 2035
Commercial Ozone Generator Market Size and Share Forecast Outlook 2025 to 2035
Commercial Gas-Fired Boiler Market Size and Share Forecast Outlook 2025 to 2035
Commercial Deep Fryer Parts & Accessories Market Size and Share Forecast Outlook 2025 to 2035
Commercial Gas Restaurant Ranges Market Size and Share Forecast Outlook 2025 to 2035
Commercial Heat Pump Market Size and Share Forecast Outlook 2025 to 2035

Thank you!
You will receive an email from our Business Development Manager. Please be sure to check your SPAM/JUNK folder too.
Chat With
MaRIA