Commercial Pizza Oven Market
Are Commercial Pizza Ovens a Scorching Hot Kitchen Appliance for Fast Food Giants across Japan, Korea, the United States, Germany, the United Kingdom, & 30+ Countries? Find in FMI’s Report!
Commercial Pizza Oven Market by Product Type, Type, Application, Sales Channel & Region | Forecast 2022 to 2032
Commercial Pizza Oven Market Outlook (2022 to 2032)
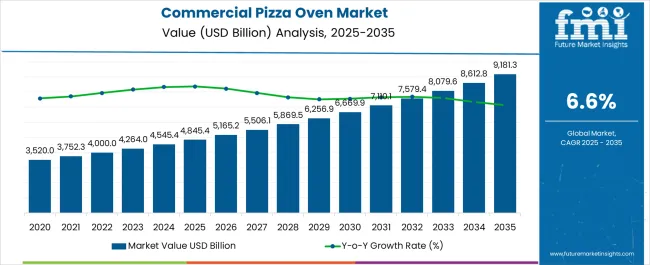
The commercial pizza oven market is expected to elevate at a CAGR of 6.6% in the forecast period (2022 to 2032). The market is anticipated to be valued at US$ 4,000.0 million in 2022 and exceed US$ 7,579.4 million by 2032.
Pizza ovens are considered to be a vital kitchen appliance of several pizza outlets, cafés, inns, resorts, motels, catering operations, fast food chains, and coffee shops. Since pizza ovens are one of the most popular products in culinary and hospitality industries, the market is projected to accelerate throughout the forecast period.
Millennials are projected to spend huge sums in food joints and pizza outlets on the back of surging disposable income and rapid urbanization. With development of brand-new hospitality centers across emerging economies, the market for commercial pizza ovens is likely to showcase a high growth potential throughout the estimated time frame.
Brick pizza ovens are set to generate astonishing demand across the globe as they are cost-effective and efficient. More than one pizza can be easily cooked at a time inside brick ovens. They are expected to showcase high demand among large-scale restaurant and café chains globally.
Expansion of hospitality and food industries across the globe is another vital factor that would fuel sales of commercial pizza ovens in the forecast period. Various pizza outlets are introducing new menus to expand their existing portfolios, which would propel commercial pizza oven sales.
In January 2023, Nomad Pizza, a delivery-only pizza joint that opened its door in 2019 in Delhi, launched a new menu to provide a memorable voyage to its clients. The company aims to provide its clients with a taste of culinary delights from various regions of the world, ranging from Korea to Naples.
Cozze Pizza Oven, a popular pizza oven manufacturer based in Europe, on the other hand, entered into the Australia market by launching its latest pizza ovens. The 13-inch oven includes Lebensmittel-, Bedarfsgegenstände-und Futtermittelgesetzbuch-approved cordierite pizza stone and 5-kilo watt burner. It can heat up in around 20 minutes and can make pizzas of up to 34 centimeters in diameter. Such product launches across the globe are anticipated to push demand for commercial pizza ovens.
Attributes |
Key Insights |
Commercial Pizza Oven Market Estimated Size (2022E) |
US$ 4000.0 million |
Projected Market Valuation (2032F) |
US$ 7579.4 million |
Value-based CAGR (2022 to 2032) |
6.6% |
Let us know your requirement to get
100% FREE customization
2017 to 2021 Commercial Pizza Oven Market Outlook Compared to Demand Forecast from 2022 to 2032
According to predictions put forward by Future Market Insights, the market for commercial pizza ovens is projected to surge steadily over the next ten years. Developing nations are expected to showcase promising growth prospects, especially industrialized countries such as India and China.
Since pizza ovens are already a common fixture in virtually all commercial kitchens across developed countries, tapping into the market is set to be simple for key companies. Offering cutting-edge styles and designs can provide key players with new opportunities. Trendy features that require less cleaning, are small, versatile, able to quickly pre-heat, and simple to build are few of the features that are preferred by users.
Comparative Analysis of Adjacent Commercial Pizza Oven Markets
Commercial Pizza Oven Market:
Differentiating Aspects |
Commercial Pizza Oven Market |
CAGR in 2022 to 2032 |
6.6% |
Current Valuation in 2022 |
US$ 4000.0 million |
Projected Valuation in 2032 |
US$ 7579.4 million |
Demand Drivers |
|
Pizza Crust Mix Market:
Differentiating Aspects |
Pizza Crust Mix Market |
CAGR in 2022 to 2032 |
5.50% |
Current Valuation in 2022 |
US$ 1,248.3 million |
Projected Valuation in 2032 |
US$ 2,132.3 million |
Demand Drivers |
|
Gluten-free Pizza Crust Market:
Differentiating Aspects |
Gluten-free Pizza Crust Market |
CAGR in 2022 to 2032 |
7% |
Current Valuation in 2022 |
US$ 3.3 billion |
Projected Valuation in 2032 |
US$ 5 billion |
Demand Drivers |
|
Find your sweet spots for generating winning opportunities in this market.
Talk to AnalystTop Trends Fueling Sales of Commercial Pizza Ovens across the Globe
- Expansion of Online Food Delivery Platforms to Fuel Demand for Professional Pizza Ovens
Pizza is considered to be a very popular food item in practically every food service establishment, which is the primary driver of the global market for commercial pizza ovens. Increasing businesses demanding unique pizza ovens with superior features has surged the sales of pizza.
Availability of a wide range of pizzas to satisfy consumer cravings across the globe has further generated a sizable market share for commercial pizza ovens. Sales are expected to be driven by high demand for new ovens that are equipped with multiple cooking functions.
Expansion of online food delivery platforms in both developed and developing countries is projected to result in high demand for pizza as a snacking item. House parties, office parties, and similar get together events worldwide include pizza as a staple fast food or snack.
Key restaurants and cafés are projected to expand their online presence so that consumers can instantly order their favorite pizzas with just a click. The aforementioned factors are anticipated to drive commercial pizza oven demand worldwide.
Market-o-Nomics – Highlighting the Key Trends
Numerous influential factors have been identified to stir soup in the commercial pizza oven market. Analysts at Future Market Insights have analyzed restraining factors, lucrative opportunities, and upcoming threats that can pose a challenge to progression of the market for commercial pizza ovens.
The drivers, restraints, opportunities, and threats identified are as follows:
DRIVERS |
|
RESTRAINTS |
|
OPPORTUNITIES |
|
THREATS |
|

A unified Market Research Subscription Platform, built for today's disparate research needs.
Country-wise Insights
Why Are Sales of Commercial Pizza Ovens Surging across the United States?
Rising Demand for Commercial Outdoor Pizza Ovens among Key Restaurants to Boost Sales in the United States
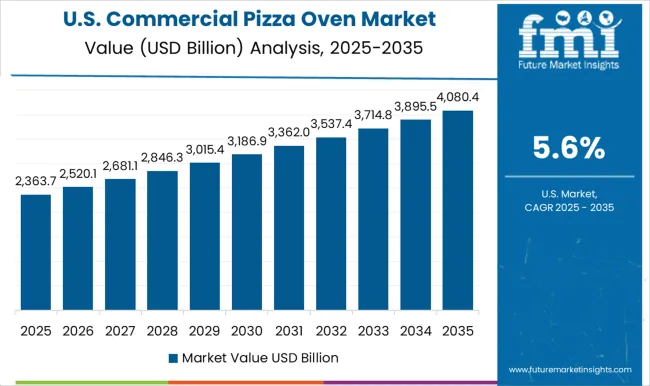
The United States is considered to be a leading country in the North America market for commercial pizza ovens. The country is estimated to create an incremental valuation of nearly US$ 1,033.6 million and generate a share of around 68% throughout the assessment period. Growth is attributed to several commercial companies looking for unique pizza ovens for providing fast service to their customers. Keeping the United States aside, Canada and Mexico are projected to contribute to about 38% of the global market share.
Why is Demand for Commercial Pizza Ovens Skyrocketing in the United Kingdom?
Surging Trend for Online Food Ordering in the United Kingdom to Flourish Sales of Industrial Pizza Ovens
Europe is set to be one of the most prominent commercial pizza oven markets with more than two-fifths of share. Growth is attributed to rising trend for online food ordering and easy accessibility of numerous types of pizzas through online platforms. The United Kingdom is estimated to generate a share of 22% and create an absolute dollar opportunity of US$ 352.0 million by 2032. As per Future Market Insights, Germany, France, Russia, and Italy are set to together contribute to around 40% of total market share.
Will India and China Showcase Promising Growth in the Field of Commercial Pizza Ovens?
Fast Food Giants in India and China to Look for Commercial Pizza Making Machines to Provide Quick Delivery Service
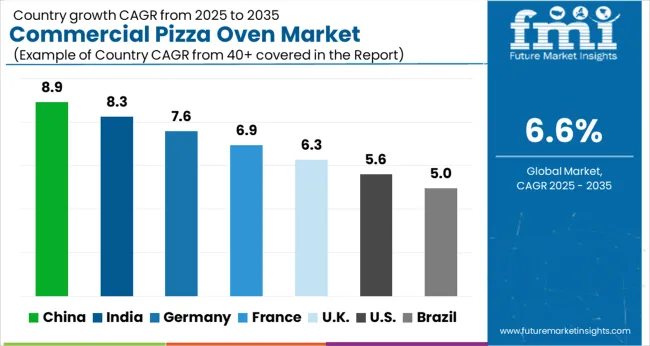
In Asia Pacific, India and China are anticipated to be two dominant countries in the commercial pizza oven market. Expansion of the hotel/restaurant/catering industry across both countries with rising middle-class population and increasing disposable income would drive sales in the market. Asia Pacific is likely to contribute around 18% of the global market share and surpass US$ 720.0 million driven by India and China.
In India, several pizza joints are offering quick home delivery services to attract a large consumer base. Domino’s India, for instance, unveiled its 20-minute pizza delivery service across 20 areas in the country. With this launch, the company aims to enhance operational efficiencies, improve in-store process movements, extend stores within the vicinity, and upgrade existing technology.
Category-wise Insights
Which is the Most Preferred Type of Commercial Pizza Ovens Worldwide?
Demand for Convection Restaurant Pizza Ovens to Escalate across the Globe
Finding an ideal commercial pizza oven is essential for any restaurant, bakery, cafeteria, or other enterprise that depends on its ability to efficiently and swiftly feed various customers. One of the most common models of commercial pizza oven available today is convection oven.
To guarantee that the baked food is heated properly and uniformly, convection ovens contain a fan that circulates air inside the oven. They are hence considered to be a suitable option for even and consistent cooking.
Which is the Foremost Sales Channel for Purchasing Commercial Pizza Ovens?
Consumers Prefer Online Sales Channel for Buying Industrial Pizza Makers
One of the most convenient ways to choose products and compare them with other brands is through e-commerce platforms. Expansion of the e-commerce sector amid investments by key manufacturers in partnering with delivery services, adding direct-to-consumer operations, and developing an improved website experience is projected to drive the online segment in terms of sales channel. Another factor driving commercial pizza ovens demand through online sales channels is their ease of use and serviceability.
Competitive Landscape
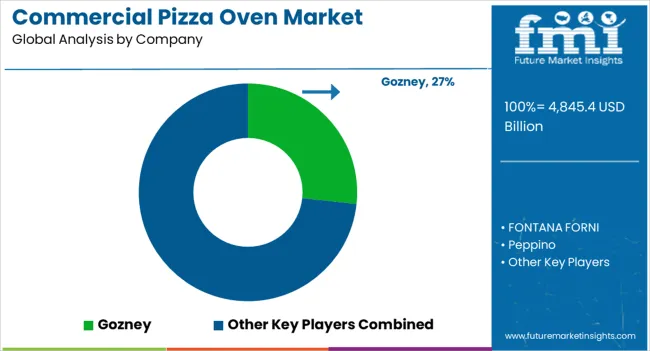
Key companies present in the global market for commercial pizza ovens are focusing on innovating their in-house products to gain a large consumer base. They are striving to customize their products to cater to specific needs of clients.
Gozney, one of the market's key companies, for instance, offers dual-fuel models with wood and liquefied petroleum gas/natural gas burners to meet high demand. Its products are Department for Environment Food and Rural Affairs certified and developed from high-quality materials. Such advancements could provide commercial pizza oven manufacturers an advantage over their rivals.
One of the recent industry developments are as follows:
- In June 2022, Pizza Pro, a one-stop-shop for all things pizza and an authorized Ooni pizza oven distributor in India, introduced the Pizza Pro Experience Store, its first flagship stores in Meherchand Market, New Delhi. The store has been mainly developed for pizza enthusiasts to enhance their shopping experience by offering a demo of numerous pizza oven models before they make a purchase decision. To make the experience fun, the company is allowing customers to bring their own dough and make pizzas by utilizing Ooni pizza ovens.
Scope of the Report
Attribute |
Details |
Estimated Market Size (2022) |
US$ 4000.0 million |
Projected Market Valuation (2032) |
US$ 7579.4 million |
Value-based CAGR (2022 to 2032) |
6.6% |
Forecast Period |
2022 to 2032 |
Historical Data Available for |
2017 to 2021 |
Market Analysis |
Value (US$ million) |
Key Regions Covered |
|
Key Countries Covered |
|
Key Segments Covered |
|
Key Companies Profiled |
|
Report Coverage |
Drivers, Restraints, Opportunities and Threats Analysis, Market Forecast, Company Share Analysis, Market Dynamics and Challenges, Competitive Landscape, and Strategic Growth Initiatives |
Commercial Pizza Oven Market Outlook by Category
By Product Type:
- Gas Pizza Oven
- Electric Pizza Oven
- Wood-fired Pizza Oven
By Type:
- Deck
- Convection
- Brick
- Conveyer
- Countertop
By Application:
- Hotels
- Restaurants
- Cafés
- Bakeries
- Catering Units
By Sales Channel:
- Online
- Offline
By Region:
- North America
- Latin America
- Europe
- South Asia
- East Asia
- Oceania
- Middle East & Africa
Frequently Asked Questions
The commercial pizza oven industry was projected to be valued at US$ 4,000.0 million in 2022.
The global market for commercial pizza ovens is expected to rise at a CAGR of 6.6% in the forecast period.
North America commercial pizza oven industry is likely to generate around 38% of share, and is set to be worth US$ 1,520.0 million.
The United States, China, and the United Kingdom are leading countries driving demand for commercial pizza ovens.
China is set to account for about 32% of market share and its valuation is likely to surpass US$ 230.4 million in the estimated time frame.
Europe is leading the commercial pizza oven industry and is expected to generate a share of 40%, as well as is set to be valued at US$ 1,520.0 million by 2032.
FONTANA FORNI, Forno Bravo, Le Panyol, Mugnaini Imports, Inc., and The Stone Bake Oven Company are the top 5 players operating in the market for commercial pizza ovens.
The global commercial pizza oven industry is estimated to surpass US$ 7,579.4 million by 2032.
Table of Content
1. Executive Summary
1.1. Global Market Outlook
1.2. Demand-side Trends
1.3. Supply-side Trends
1.4. Technology Roadmap Analysis
1.5. Analysis and Recommendations
2. Market Overview
2.1. Market Coverage / Taxonomy
2.2. Market Definition / Scope / Limitations
3. Market Background
3.1. Market Dynamics
3.1.1. Drivers
3.1.2. Restraints
3.1.3. Opportunity
3.1.4. Trends
3.2. Scenario Forecast
3.2.1. Demand in Optimistic Scenario
3.2.2. Demand in Likely Scenario
3.2.3. Demand in Conservative Scenario
3.3. Product launches & Recent Developments
3.4. Product Life Cycle Analysis
3.5. Value Chain Analysis
3.5.1. Supply Side Participants and their Roles
3.5.1.1. Producers
3.5.1.2. Mid-Level Participants (Traders/ Agents/ Brokers)
3.5.1.3. Wholesalers and Distributors
3.5.2. % of Operating Margin Analysis
3.5.3. List of Raw Material Suppliers
3.5.4. List of Existing and Potential Buyer’s
3.6. Global Commercial Pizza Oven Market - Pricing Analysis
3.6.1. Price Point Assessment by Region
3.6.2. Price Point Assessment by Product Type
3.6.3. Price Forecast till 2032
3.6.4. Factors affecting pricing
3.7. Forecast Factors - Relevance & Impact
3.8. PESTLE and Porter’s Analysis
3.9. Regulatory Landscape
3.9.1. Packaging & Labelling Regulations
3.9.2. Certifications and Certifying Agency Overview
3.9.3. Import/Export Policies
3.10. Regional Parent Market Outlook
3.11. Production and Consumption Statistics
3.12. Import and Export Statistics
3.13. Consumers Survey Analysis
3.14. Macro-Economic Factors
3.15. Product Claims & Nutritional Information Scan by Buyers
4. Global Commercial Pizza Oven Market Analysis 2017 to 2021 and Forecast, 2022 to 2032
4.1. Historical Market Size Value (US$ million) & Volume (Units) Analysis, 2017 to 2021
4.2. Current and Future Market Size Value (US$ million) & Volume (Units) Projections, 2022 to 2032
4.2.1. Y-o-Y Growth Trend Analysis
4.2.2. Absolute $ Opportunity Analysis
5. Global Commercial Pizza Oven Market Analysis 2017 to 2021 and Forecast 2022 to 2032, By Product Type
5.1. Introduction / Key Findings
5.2. Historical Market Size Value (US$ million) & Volume (Units) Analysis By Product Type, 2017 to 2021
5.3. Current and Future Market Size Value (US$ million) & Volume (Units) Analysis and Forecast By Product Type, 2022 to 2032
5.3.1. Gas Pizza Oven
5.3.2. Electric Pizza Oven
5.3.3. Wood-fired Pizza Oven
5.4. Y-o-Y Growth Trend Analysis By Product Type, 2017 to 2021
5.5. Absolute $ Opportunity Analysis By Product Type, 2022 to 2032
6. Global Commercial Pizza Oven Market Analysis 2017 to 2021 and Forecast 2022 to 2032, By Type
6.1. Introduction / Key Findings
6.2. Historical Market Size Value (US$ million) & Volume (Units) Analysis By Type, 2017 to 2021
6.3. Current and Future Market Size Value (US$ million) & Volume (Units) Analysis and Forecast By Type, 2022 to 2032
6.3.1. Deck
6.3.2. Convection
6.3.3. Brick
6.3.4. Conveyer
6.3.5. Countertop
6.4. Y-o-Y Growth Trend Analysis By Type, 2017 to 2021
6.5. Absolute $ Opportunity Analysis By Type, 2022 to 2032
7. Global Commercial Pizza Oven Market Analysis 2017 to 2021 and Forecast 2022 to 2032, By Application
7.1. Introduction / Key Findings
7.2. Historical Market Size Value (US$ million) & Volume (Units) Analysis By Application, 2017 to 2021
7.3. Current and Future Market Size Value (US$ million) & Volume (Units) Analysis and Forecast By Application, 2022 to 2032
7.3.1. Hotels
7.3.2. Restaurants
7.3.3. Cafés
7.3.4. Bakeries
7.3.5. Catering Units
7.4. Y-o-Y Growth Trend Analysis By Application, 2017 to 2021
7.5. Absolute $ Opportunity Analysis By Application, 2022 to 2032
8. Global Commercial Pizza Oven Market Analysis 2017 to 2021 and Forecast 2022 to 2032, By Sales Channel
8.1. Introduction / Key Findings
8.2. Historical Market Size Value (US$ million) & Volume (Units) Analysis By Sales Channel, 2017 to 2021
8.3. Current and Future Market Size Value (US$ million) & Volume (Units) Analysis and Forecast By Sales Channel, 2022 to 2032
8.3.1. Online
8.3.2. Offline
8.4. Y-o-Y Growth Trend Analysis By Sales Channel, 2017 to 2021
8.5. Absolute $ Opportunity Analysis By Sales Channel, 2022 to 2032
9. Global Commercial Pizza Oven Market Analysis 2017 to 2021 and Forecast 2022 to 2032, By Region
9.1. Introduction
9.2. Historical Market Size Value (US$ million) & Volume (Units) Analysis By Region, 2017 to 2021
9.3. Current Market Size Value (US$ million) & Volume (Units) Analysis and Forecast By Region, 2022 to 2032
9.3.1. North America
9.3.2. Latin America
9.3.3. Europe
9.3.4. East Asia
9.3.5. South Asia
9.3.6. Oceania
9.3.7. Middle East and Africa
9.4. Market Attractiveness Analysis By Region
10. North America Commercial Pizza Oven Market Analysis 2017 to 2021 and Forecast 2022 to 2032, By Country
10.1. Historical Market Size Value (US$ million) & Volume (Units) Trend Analysis By Market Taxonomy, 2017 to 2021
10.2. Market Size Value (US$ million) & Volume (Units) Forecast By Market Taxonomy, 2022 to 2032
10.2.1. By Country
10.2.1.1. United States
10.2.1.2. Canada
10.2.2. By Product Type
10.2.3. By Type
10.2.4. By Application
10.2.5. By Sales Channel
10.3. Market Attractiveness Analysis
10.3.1. By Country
10.3.2. By Product Type
10.3.3. By Type
10.3.4. By Application
10.3.5. By Sales Channel
10.4. Key Takeaways
11. Latin America Commercial Pizza Oven Market Analysis 2017 to 2021 and Forecast 2022 to 2032, By Country
11.1. Historical Market Size Value (US$ million) & Volume (Units) Trend Analysis By Market Taxonomy, 2017 to 2021
11.2. Market Size Value (US$ million) & Volume (Units) Forecast By Market Taxonomy, 2022 to 2032
11.2.1. By Country
11.2.1.1. Brazil
11.2.1.2. Mexico
11.2.1.3. Argentina
11.2.1.4. Chile
11.2.1.5. Peru
11.2.1.6. Rest of Latin America
11.2.2. By Product Type
11.2.3. By Type
11.2.4. By Application
11.2.5. By Sales Channel
11.3. Market Attractiveness Analysis
11.3.1. By Country
11.3.2. By Product Type
11.3.3. By Type
11.3.4. By Application
11.3.5. By Sales Channel
11.4. Key Takeaways
12. Europe Commercial Pizza Oven Market Analysis 2017 to 2021 and Forecast 2022 to 2032, By Country
12.1. Historical Market Size Value (US$ million) & Volume (Units) Trend Analysis By Market Taxonomy, 2017 to 2021
12.2. Market Size Value (US$ million) & Volume (Units) Forecast By Market Taxonomy, 2022 to 2032
12.2.1. By Country
12.2.1.1. Germany
12.2.1.2. Italy
12.2.1.3. France
12.2.1.4. United Kingdom
12.2.1.5. Spain
12.2.1.6. Russia
12.2.1.7. BENELUX
12.2.1.8. Poland
12.2.1.9. Nordic Countries
12.2.1.10. Rest of Europe
12.2.2. By Product Type
12.2.3. By Type
12.2.4. By Application
12.2.5. By Sales Channel
12.3. Market Attractiveness Analysis
12.3.1. By Country
12.3.2. By Product Type
12.3.3. By Type
12.3.4. By Application
12.3.5. By Sales Channel
12.4. Key Takeaways
13. East Asia Commercial Pizza Oven Market Analysis 2017 to 2021 and Forecast 2022 to 2032, By Country
13.1. Historical Market Size Value (US$ million) & Volume (Units) Trend Analysis By Market Taxonomy, 2017 to 2021
13.2. Market Size Value (US$ million) & Volume (Units) Forecast By Market Taxonomy, 2022 to 2032
13.2.1. By Country
13.2.1.1. China
13.2.1.2. Japan
13.2.1.3. South Korea
13.2.2. By Product Type
13.2.3. By Type
13.2.4. By Application
13.2.5. By Sales Channel
13.3. Market Attractiveness Analysis
13.3.1. By Country
13.3.2. By Product Type
13.3.3. By Type
13.3.4. By Application
13.3.5. By Sales Channel
13.4. Key Takeaways
14. South Asia Commercial Pizza Oven Market Analysis 2017 to 2021 and Forecast 2022 to 2032, By Country
14.1. Historical Market Size Value (US$ million) & Volume (Units) Trend Analysis By Market Taxonomy, 2017 to 2021
14.2. Market Size Value (US$ million) & Volume (Units) Forecast By Market Taxonomy, 2022 to 2032
14.2.1. By Country
14.2.1.1. India
14.2.1.2. Thailand
14.2.1.3. Malaysia
14.2.1.4. Indonesia
14.2.1.5. Singapore
14.2.1.6. Rest of South Asia
14.2.2. By Product Type
14.2.3. By Type
14.2.4. By Application
14.2.5. By Sales Channel
14.3. Market Attractiveness Analysis
14.3.1. By Country
14.3.2. By Product Type
14.3.3. By Type
14.3.4. By Application
14.3.5. By Sales Channel
14.4. Key Takeaways
15. Oceania Commercial Pizza Oven Market Analysis 2017 to 2021 and Forecast 2022 to 2032, By Country
15.1. Historical Market Size Value (US$ million) & Volume (Units) Trend Analysis By Market Taxonomy, 2017 to 2021
15.2. Market Size Value (US$ million) & Volume (Units) Forecast By Market Taxonomy, 2022 to 2032
15.2.1. By Country
15.2.1.1. Australia
15.2.1.2. New Zealand
15.2.2. By Product Type
15.2.3. By Type
15.2.4. By Application
15.2.5. By Sales Channel
15.3. Market Attractiveness Analysis
15.3.1. By Country
15.3.2. By Product Type
15.3.3. By Type
15.3.4. By Application
15.3.5. By Sales Channel
15.4. Key Takeaways
16. Middle East and Africa Commercial Pizza Oven Market Analysis 2017 to 2021 and Forecast 2022 to 2032, By Country
16.1. Historical Market Size Value (US$ million) & Volume (Units) Trend Analysis By Market Taxonomy, 2017 to 2021
16.2. Market Size Value (US$ million) & Volume (Units) Forecast By Market Taxonomy, 2022 to 2032
16.2.1. By Country
16.2.1.1. Gulf Cooperation Council Countries
16.2.1.2. South Africa
16.2.1.3. Central Africa
16.2.1.4. North Africa
16.2.2. By Product Type
16.2.3. By Type
16.2.4. By Application
16.2.5. By Sales Channel
16.3. Market Attractiveness Analysis
16.3.1. By Country
16.3.2. By Product Type
16.3.3. By Type
16.3.4. By Application
16.3.5. By Sales Channel
16.4. Key Takeaways
17. Key Countries Commercial Pizza Oven Market Analysis
17.1. United States
17.1.1. Pricing Analysis
17.1.2. Market Share Analysis, 2021
17.1.2.1. By Product Type
17.1.2.2. By Type
17.1.2.3. By Application
17.1.2.4. By Sales Channel
17.2. Canada
17.2.1. Pricing Analysis
17.2.2. Market Share Analysis, 2021
17.2.2.1. By Product Type
17.2.2.2. By Type
17.2.2.3. By Application
17.2.2.4. By Sales Channel
17.3. Brazil
17.3.1. Pricing Analysis
17.3.2. Market Share Analysis, 2021
17.3.2.1. By Product Type
17.3.2.2. By Type
17.3.2.3. By Application
17.3.2.4. By Sales Channel
17.4. Mexico
17.4.1. Pricing Analysis
17.4.2. Market Share Analysis, 2021
17.4.2.1. By Product Type
17.4.2.2. By Type
17.4.2.3. By Application
17.4.2.4. By Sales Channel
17.5. Argentina
17.5.1. Pricing Analysis
17.5.2. Market Share Analysis, 2021
17.5.2.1. By Product Type
17.5.2.2. By Type
17.5.2.3. By Application
17.5.2.4. By Sales Channel
17.6. Chile
17.6.1. Pricing Analysis
17.6.2. Market Share Analysis, 2021
17.6.2.1. By Product Type
17.6.2.2. By Type
17.6.2.3. By Application
17.6.2.4. By Sales Channel
17.7. Peru
17.7.1. Pricing Analysis
17.7.2. Market Share Analysis, 2021
17.7.2.1. By Product Type
17.7.2.2. By Type
17.7.2.3. By Application
17.7.2.4. By Sales Channel
17.8. Germany
17.8.1. Pricing Analysis
17.8.2. Market Share Analysis, 2021
17.8.2.1. By Product Type
17.8.2.2. By Type
17.8.2.3. By Application
17.8.2.4. By Sales Channel
17.9. Italy
17.9.1. Pricing Analysis
17.9.2. Market Share Analysis, 2021
17.9.2.1. By Product Type
17.9.2.2. By Type
17.9.2.3. By Application
17.9.2.4. By Sales Channel
17.10. France
17.10.1. Pricing Analysis
17.10.2. Market Share Analysis, 2021
17.10.2.1. By Product Type
17.10.2.2. By Type
17.10.2.3. By Application
17.10.2.4. By Sales Channel
17.11. Spain
17.11.1. Pricing Analysis
17.11.2. Market Share Analysis, 2021
17.11.2.1. By Product Type
17.11.2.2. By Type
17.11.2.3. By Application
17.11.2.4. By Sales Channel
17.12. United Kingdom
17.12.1. Pricing Analysis
17.12.2. Market Share Analysis, 2021
17.12.2.1. By Product Type
17.12.2.2. By Type
17.12.2.3. By Application
17.12.2.4. By Sales Channel
17.13. Russia
17.13.1. Pricing Analysis
17.13.2. Market Share Analysis, 2021
17.13.2.1. By Product Type
17.13.2.2. By Type
17.13.2.3. By Application
17.13.2.4. By Sales Channel
17.14. Poland
17.14.1. Pricing Analysis
17.14.2. Market Share Analysis, 2021
17.14.2.1. By Product Type
17.14.2.2. By Type
17.14.2.3. By Application
17.14.2.4. By Sales Channel
17.15. BENELUX
17.15.1. Pricing Analysis
17.15.2. Market Share Analysis, 2021
17.15.2.1. By Product Type
17.15.2.2. By Type
17.15.2.3. By Application
17.15.2.4. By Sales Channel
17.16. Nordic Countries
17.16.1. Pricing Analysis
17.16.2. Market Share Analysis, 2021
17.16.2.1. By Product Type
17.16.2.2. By Type
17.16.2.3. By Application
17.16.2.4. By Sales Channel
17.17. China
17.17.1. Pricing Analysis
17.17.2. Market Share Analysis, 2021
17.17.2.1. By Product Type
17.17.2.2. By Type
17.17.2.3. By Application
17.17.2.4. By Sales Channel
17.18. Japan
17.18.1. Pricing Analysis
17.18.2. Market Share Analysis, 2021
17.18.2.1. By Product Type
17.18.2.2. By Type
17.18.2.3. By Application
17.18.2.4. By Sales Channel
17.19. South Korea
17.19.1. Pricing Analysis
17.19.2. Market Share Analysis, 2021
17.19.2.1. By Product Type
17.19.2.2. By Type
17.19.2.3. By Application
17.19.2.4. By Sales Channel
17.20. India
17.20.1. Pricing Analysis
17.20.2. Market Share Analysis, 2021
17.20.2.1. By Product Type
17.20.2.2. By Type
17.20.2.3. By Application
17.20.2.4. By Sales Channel
17.21. Thailand
17.21.1. Pricing Analysis
17.21.2. Market Share Analysis, 2021
17.21.2.1. By Product Type
17.21.2.2. By Type
17.21.2.3. By Application
17.21.2.4. By Sales Channel
17.22. Indonesia
17.22.1. Pricing Analysis
17.22.2. Market Share Analysis, 2021
17.22.2.1. By Product Type
17.22.2.2. By Type
17.22.2.3. By Application
17.22.2.4. By Sales Channel
17.23. Malaysia
17.23.1. Pricing Analysis
17.23.2. Market Share Analysis, 2021
17.23.2.1. By Product Type
17.23.2.2. By Type
17.23.2.3. By Application
17.23.2.4. By Sales Channel
17.24. Singapore
17.24.1. Pricing Analysis
17.24.2. Market Share Analysis, 2021
17.24.2.1. By Product Type
17.24.2.2. By Type
17.24.2.3. By Application
17.24.2.4. By Sales Channel
17.25. Australia
17.25.1. Pricing Analysis
17.25.2. Market Share Analysis, 2021
17.25.2.1. By Product Type
17.25.2.2. By Type
17.25.2.3. By Application
17.25.2.4. By Sales Channel
17.26. New Zealand
17.26.1. Pricing Analysis
17.26.2. Market Share Analysis, 2021
17.26.2.1. By Product Type
17.26.2.2. By Type
17.26.2.3. By Application
17.26.2.4. By Sales Channel
17.27. Gulf Cooperation Council Countries
17.27.1. Pricing Analysis
17.27.2. Market Share Analysis, 2021
17.27.2.1. By Product Type
17.27.2.2. By Type
17.27.2.3. By Application
17.27.2.4. By Sales Channel
17.28. South Africa
17.28.1. Pricing Analysis
17.28.2. Market Share Analysis, 2021
17.28.2.1. By Product Type
17.28.2.2. By Type
17.28.2.3. By Application
17.28.2.4. By Sales Channel
17.29. North Africa
17.29.1. Pricing Analysis
17.29.2. Market Share Analysis, 2021
17.29.2.1. By Product Type
17.29.2.2. By Type
17.29.2.3. By Application
17.29.2.4. By Sales Channel
17.30. Central Africa
17.30.1. Pricing Analysis
17.30.2. Market Share Analysis, 2021
17.30.2.1. By Product Type
17.30.2.2. By Type
17.30.2.3. By Application
17.30.2.4. By Sales Channel
18. Market Structure Analysis
18.1. Competition Dashboard
18.2. Competition Benchmarking
18.3. Market Share Analysis of Top Players
18.3.1. By Regional
18.3.2. By Product Type
18.3.3. By Type
18.3.4. By Application
18.3.5. By Sales Channel
19. Competition Analysis
19.1. Competition Deep Dive
19.1.1. Gozney
19.1.1.1. Overview
19.1.1.2. Product Portfolio
19.1.1.3. Profitability by Market Segments (Product/Age /Sales Channel/Region)
19.1.1.4. Sales Footprint
19.1.1.5. Strategy Overview
19.1.1.5.1. Marketing Strategy
19.1.1.5.2. Product Strategy
19.1.1.5.3. Channel Strategy
19.1.2. FONTANA FORNI
19.1.2.1. Overview
19.1.2.2. Product Portfolio
19.1.2.3. Profitability by Market Segments (Product/Age /Sales Channel/Region)
19.1.2.4. Sales Footprint
19.1.2.5. Strategy Overview
19.1.2.5.1. Marketing Strategy
19.1.2.5.2. Product Strategy
19.1.2.5.3. Channel Strategy
19.1.3. Peppino
19.1.3.1. Overview
19.1.3.2. Product Portfolio
19.1.3.3. Profitability by Market Segments (Product/Age /Sales Channel/Region)
19.1.3.4. Sales Footprint
19.1.3.5. Strategy Overview
19.1.3.5.1. Marketing Strategy
19.1.3.5.2. Product Strategy
19.1.3.5.3. Channel Strategy
19.1.4. Forno Bravo
19.1.4.1. Overview
19.1.4.2. Product Portfolio
19.1.4.3. Profitability by Market Segments (Product/Age /Sales Channel/Region)
19.1.4.4. Sales Footprint
19.1.4.5. Strategy Overview
19.1.4.5.1. Marketing Strategy
19.1.4.5.2. Product Strategy
19.1.4.5.3. Channel Strategy
19.1.5. Mugnaini Imports, Inc.
19.1.5.1. Overview
19.1.5.2. Product Portfolio
19.1.5.3. Profitability by Market Segments (Product/Age /Sales Channel/Region)
19.1.5.4. Sales Footprint
19.1.5.5. Strategy Overview
19.1.5.5.1. Marketing Strategy
19.1.5.5.2. Product Strategy
19.1.5.5.3. Channel Strategy
19.1.6. Wachtel GmbH
19.1.6.1. Overview
19.1.6.2. Product Portfolio
19.1.6.3. Profitability by Market Segments (Product/Age /Sales Channel/Region)
19.1.6.4. Sales Footprint
19.1.6.5. Strategy Overview
19.1.6.5.1. Marketing Strategy
19.1.6.5.2. Product Strategy
19.1.6.5.3. Channel Strategy
19.1.7. Californo
19.1.7.1. Overview
19.1.7.2. Product Portfolio
19.1.7.3. Profitability by Market Segments (Product/Age /Sales Channel/Region)
19.1.7.4. Sales Footprint
19.1.7.5. Strategy Overview
19.1.7.5.1. Marketing Strategy
19.1.7.5.2. Product Strategy
19.1.7.5.3. Channel Strategy
19.1.8. Le Panyol
19.1.8.1. Overview
19.1.8.2. Product Portfolio
19.1.8.3. Profitability by Market Segments (Product/Age /Sales Channel/Region)
19.1.8.4. Sales Footprint
19.1.8.5. Strategy Overview
19.1.8.5.1. Marketing Strategy
19.1.8.5.2. Product Strategy
19.1.8.5.3. Channel Strategy
19.1.9. The Stone Bake Oven Market Company
19.1.9.1. Overview
19.1.9.2. Product Portfolio
19.1.9.3. Profitability by Market Segments (Product/Age /Sales Channel/Region)
19.1.9.4. Sales Footprint
19.1.9.5. Strategy Overview
19.1.9.5.1. Marketing Strategy
19.1.9.5.2. Product Strategy
19.1.9.5.3. Channel Strategy
20. Assumptions & Acronyms Used
21. Research Methodology
Let us know your requirement to get
100% FREE customization
List of Tables
Table 1: Global Market Value (US$ million) Forecast by Region, 2017 to 2032
Table 2: Global Market Volume (Units) Forecast by Region, 2017 to 2032
Table 3: Global Market Value (US$ million) Forecast by Product Type, 2017 to 2032
Table 4: Global Market Volume (Units) Forecast by Product Type, 2017 to 2032
Table 5: Global Market Value (US$ million) Forecast by Type, 2017 to 2032
Table 6: Global Market Volume (Units) Forecast by Type, 2017 to 2032
Table 7: Global Market Value (US$ million) Forecast by Application, 2017 to 2032
Table 8: Global Market Volume (Units) Forecast by Application, 2017 to 2032
Table 9: Global Market Value (US$ million) Forecast by Sales Channel, 2017 to 2032
Table 10: Global Market Volume (Units) Forecast by Sales Channel, 2017 to 2032
Table 11: North America Market Value (US$ million) Forecast by Country, 2017 to 2032
Table 12: North America Market Volume (Units) Forecast by Country, 2017 to 2032
Table 13: North America Market Value (US$ million) Forecast by Product Type, 2017 to 2032
Table 14: North America Market Volume (Units) Forecast by Product Type, 2017 to 2032
Table 15: North America Market Value (US$ million) Forecast by Type, 2017 to 2032
Table 16: North America Market Volume (Units) Forecast by Type, 2017 to 2032
Table 17: North America Market Value (US$ million) Forecast by Application, 2017 to 2032
Table 18: North America Market Volume (Units) Forecast by Application, 2017 to 2032
Table 19: North America Market Value (US$ million) Forecast by Sales Channel, 2017 to 2032
Table 20: North America Market Volume (Units) Forecast by Sales Channel, 2017 to 2032
Table 21: Latin America Market Value (US$ million) Forecast by Country, 2017 to 2032
Table 22: Latin America Market Volume (Units) Forecast by Country, 2017 to 2032
Table 23: Latin America Market Value (US$ million) Forecast by Product Type, 2017 to 2032
Table 24: Latin America Market Volume (Units) Forecast by Product Type, 2017 to 2032
Table 25: Latin America Market Value (US$ million) Forecast by Type, 2017 to 2032
Table 26: Latin America Market Volume (Units) Forecast by Type, 2017 to 2032
Table 27: Latin America Market Value (US$ million) Forecast by Application, 2017 to 2032
Table 28: Latin America Market Volume (Units) Forecast by Application, 2017 to 2032
Table 29: Latin America Market Value (US$ million) Forecast by Sales Channel, 2017 to 2032
Table 30: Latin America Market Volume (Units) Forecast by Sales Channel, 2017 to 2032
Table 31: Europe Market Value (US$ million) Forecast by Country, 2017 to 2032
Table 32: Europe Market Volume (Units) Forecast by Country, 2017 to 2032
Table 33: Europe Market Value (US$ million) Forecast by Product Type, 2017 to 2032
Table 34: Europe Market Volume (Units) Forecast by Product Type, 2017 to 2032
Table 35: Europe Market Value (US$ million) Forecast by Type, 2017 to 2032
Table 36: Europe Market Volume (Units) Forecast by Type, 2017 to 2032
Table 37: Europe Market Value (US$ million) Forecast by Application, 2017 to 2032
Table 38: Europe Market Volume (Units) Forecast by Application, 2017 to 2032
Table 39: Europe Market Value (US$ million) Forecast by Sales Channel, 2017 to 2032
Table 40: Europe Market Volume (Units) Forecast by Sales Channel, 2017 to 2032
Table 41: East Asia Market Value (US$ million) Forecast by Country, 2017 to 2032
Table 42: East Asia Market Volume (Units) Forecast by Country, 2017 to 2032
Table 43: East Asia Market Value (US$ million) Forecast by Product Type, 2017 to 2032
Table 44: East Asia Market Volume (Units) Forecast by Product Type, 2017 to 2032
Table 45: East Asia Market Value (US$ million) Forecast by Type, 2017 to 2032
Table 46: East Asia Market Volume (Units) Forecast by Type, 2017 to 2032
Table 47: East Asia Market Value (US$ million) Forecast by Application, 2017 to 2032
Table 48: East Asia Market Volume (Units) Forecast by Application, 2017 to 2032
Table 49: East Asia Market Value (US$ million) Forecast by Sales Channel, 2017 to 2032
Table 50: East Asia Market Volume (Units) Forecast by Sales Channel, 2017 to 2032
Table 51: South Asia Market Value (US$ million) Forecast by Country, 2017 to 2032
Table 52: South Asia Market Volume (Units) Forecast by Country, 2017 to 2032
Table 53: South Asia Market Value (US$ million) Forecast by Product Type, 2017 to 2032
Table 54: South Asia Market Volume (Units) Forecast by Product Type, 2017 to 2032
Table 55: South Asia Market Value (US$ million) Forecast by Type, 2017 to 2032
Table 56: South Asia Market Volume (Units) Forecast by Type, 2017 to 2032
Table 57: South Asia Market Value (US$ million) Forecast by Application, 2017 to 2032
Table 58: South Asia Market Volume (Units) Forecast by Application, 2017 to 2032
Table 59: South Asia Market Value (US$ million) Forecast by Sales Channel, 2017 to 2032
Table 60: South Asia Market Volume (Units) Forecast by Sales Channel, 2017 to 2032
Table 61: Oceania Market Value (US$ million) Forecast by Country, 2017 to 2032
Table 62: Oceania Market Volume (Units) Forecast by Country, 2017 to 2032
Table 63: Oceania Market Value (US$ million) Forecast by Product Type, 2017 to 2032
Table 64: Oceania Market Volume (Units) Forecast by Product Type, 2017 to 2032
Table 65: Oceania Market Value (US$ million) Forecast by Type, 2017 to 2032
Table 66: Oceania Market Volume (Units) Forecast by Type, 2017 to 2032
Table 67: Oceania Market Value (US$ million) Forecast by Application, 2017 to 2032
Table 68: Oceania Market Volume (Units) Forecast by Application, 2017 to 2032
Table 69: Oceania Market Value (US$ million) Forecast by Sales Channel, 2017 to 2032
Table 70: Oceania Market Volume (Units) Forecast by Sales Channel, 2017 to 2032
Table 71: Middle East and Africa Market Value (US$ million) Forecast by Country, 2017 to 2032
Table 72: Middle East and Africa Market Volume (Units) Forecast by Country, 2017 to 2032
Table 73: Middle East and Africa Market Value (US$ million) Forecast by Product Type, 2017 to 2032
Table 74: Middle East and Africa Market Volume (Units) Forecast by Product Type, 2017 to 2032
Table 75: Middle East and Africa Market Value (US$ million) Forecast by Type, 2017 to 2032
Table 76: Middle East and Africa Market Volume (Units) Forecast by Type, 2017 to 2032
Table 77: Middle East and Africa Market Value (US$ million) Forecast by Application, 2017 to 2032
Table 78: Middle East and Africa Market Volume (Units) Forecast by Application, 2017 to 2032
Table 79: Middle East and Africa Market Value (US$ million) Forecast by Sales Channel, 2017 to 2032
Table 80: Middle East and Africa Market Volume (Units) Forecast by Sales Channel, 2017 to 2032
Find your sweet spots for generating winning opportunities in this market.
Talk to AnalystList of Charts
Figure 1: Global Market Value (US$ million) by Product Type, 2022 to 2032
Figure 2: Global Market Value (US$ million) by Type, 2022 to 2032
Figure 3: Global Market Value (US$ million) by Application, 2022 to 2032
Figure 4: Global Market Value (US$ million) by Sales Channel, 2022 to 2032
Figure 5: Global Market Value (US$ million) by Region, 2022 to 2032
Figure 6: Global Market Value (US$ million) Analysis by Region, 2017 to 2032
Figure 7: Global Market Volume (Units) Analysis by Region, 2017 to 2032
Figure 8: Global Market Value Share (%) and BPS Analysis by Region, 2022 to 2032
Figure 9: Global Market Y-o-Y Growth (%) Projections by Region, 2022 to 2032
Figure 10: Global Market Value (US$ million) Analysis by Product Type, 2017 to 2032
Figure 11: Global Market Volume (Units) Analysis by Product Type, 2017 to 2032
Figure 12: Global Market Value Share (%) and BPS Analysis by Product Type, 2022 to 2032
Figure 13: Global Market Y-o-Y Growth (%) Projections by Product Type, 2022 to 2032
Figure 14: Global Market Value (US$ million) Analysis by Type, 2017 to 2032
Figure 15: Global Market Volume (Units) Analysis by Type, 2017 to 2032
Figure 16: Global Market Value Share (%) and BPS Analysis by Type, 2022 to 2032
Figure 17: Global Market Y-o-Y Growth (%) Projections by Type, 2022 to 2032
Figure 18: Global Market Value (US$ million) Analysis by Application, 2017 to 2032
Figure 19: Global Market Volume (Units) Analysis by Application, 2017 to 2032
Figure 20: Global Market Value Share (%) and BPS Analysis by Application, 2022 to 2032
Figure 21: Global Market Y-o-Y Growth (%) Projections by Application, 2022 to 2032
Figure 22: Global Market Value (US$ million) Analysis by Sales Channel, 2017 to 2032
Figure 23: Global Market Volume (Units) Analysis by Sales Channel, 2017 to 2032
Figure 24: Global Market Value Share (%) and BPS Analysis by Sales Channel, 2022 to 2032
Figure 25: Global Market Y-o-Y Growth (%) Projections by Sales Channel, 2022 to 2032
Figure 26: Global Market Attractiveness by Product Type, 2022 to 2032
Figure 27: Global Market Attractiveness by Type, 2022 to 2032
Figure 28: Global Market Attractiveness by Application, 2022 to 2032
Figure 29: Global Market Attractiveness by Sales Channel, 2022 to 2032
Figure 30: Global Market Attractiveness by Region, 2022 to 2032
Figure 31: North America Market Value (US$ million) by Product Type, 2022 to 2032
Figure 32: North America Market Value (US$ million) by Type, 2022 to 2032
Figure 33: North America Market Value (US$ million) by Application, 2022 to 2032
Figure 34: North America Market Value (US$ million) by Sales Channel, 2022 to 2032
Figure 35: North America Market Value (US$ million) by Country, 2022 to 2032
Figure 36: North America Market Value (US$ million) Analysis by Country, 2017 to 2032
Figure 37: North America Market Volume (Units) Analysis by Country, 2017 to 2032
Figure 38: North America Market Value Share (%) and BPS Analysis by Country, 2022 to 2032
Figure 39: North America Market Y-o-Y Growth (%) Projections by Country, 2022 to 2032
Figure 40: North America Market Value (US$ million) Analysis by Product Type, 2017 to 2032
Figure 41: North America Market Volume (Units) Analysis by Product Type, 2017 to 2032
Figure 42: North America Market Value Share (%) and BPS Analysis by Product Type, 2022 to 2032
Figure 43: North America Market Y-o-Y Growth (%) Projections by Product Type, 2022 to 2032
Figure 44: North America Market Value (US$ million) Analysis by Type, 2017 to 2032
Figure 45: North America Market Volume (Units) Analysis by Type, 2017 to 2032
Figure 46: North America Market Value Share (%) and BPS Analysis by Type, 2022 to 2032
Figure 47: North America Market Y-o-Y Growth (%) Projections by Type, 2022 to 2032
Figure 48: North America Market Value (US$ million) Analysis by Application, 2017 to 2032
Figure 49: North America Market Volume (Units) Analysis by Application, 2017 to 2032
Figure 50: North America Market Value Share (%) and BPS Analysis by Application, 2022 to 2032
Figure 51: North America Market Y-o-Y Growth (%) Projections by Application, 2022 to 2032
Figure 52: North America Market Value (US$ million) Analysis by Sales Channel, 2017 to 2032
Figure 53: North America Market Volume (Units) Analysis by Sales Channel, 2017 to 2032
Figure 54: North America Market Value Share (%) and BPS Analysis by Sales Channel, 2022 to 2032
Figure 55: North America Market Y-o-Y Growth (%) Projections by Sales Channel, 2022 to 2032
Figure 56: North America Market Attractiveness by Product Type, 2022 to 2032
Figure 57: North America Market Attractiveness by Type, 2022 to 2032
Figure 58: North America Market Attractiveness by Application, 2022 to 2032
Figure 59: North America Market Attractiveness by Sales Channel, 2022 to 2032
Figure 60: North America Market Attractiveness by Country, 2022 to 2032
Figure 61: Latin America Market Value (US$ million) by Product Type, 2022 to 2032
Figure 62: Latin America Market Value (US$ million) by Type, 2022 to 2032
Figure 63: Latin America Market Value (US$ million) by Application, 2022 to 2032
Figure 64: Latin America Market Value (US$ million) by Sales Channel, 2022 to 2032
Figure 65: Latin America Market Value (US$ million) by Country, 2022 to 2032
Figure 66: Latin America Market Value (US$ million) Analysis by Country, 2017 to 2032
Figure 67: Latin America Market Volume (Units) Analysis by Country, 2017 to 2032
Figure 68: Latin America Market Value Share (%) and BPS Analysis by Country, 2022 to 2032
Figure 69: Latin America Market Y-o-Y Growth (%) Projections by Country, 2022 to 2032
Figure 70: Latin America Market Value (US$ million) Analysis by Product Type, 2017 to 2032
Figure 71: Latin America Market Volume (Units) Analysis by Product Type, 2017 to 2032
Figure 72: Latin America Market Value Share (%) and BPS Analysis by Product Type, 2022 to 2032
Figure 73: Latin America Market Y-o-Y Growth (%) Projections by Product Type, 2022 to 2032
Figure 74: Latin America Market Value (US$ million) Analysis by Type, 2017 to 2032
Figure 75: Latin America Market Volume (Units) Analysis by Type, 2017 to 2032
Figure 76: Latin America Market Value Share (%) and BPS Analysis by Type, 2022 to 2032
Figure 77: Latin America Market Y-o-Y Growth (%) Projections by Type, 2022 to 2032
Figure 78: Latin America Market Value (US$ million) Analysis by Application, 2017 to 2032
Figure 79: Latin America Market Volume (Units) Analysis by Application, 2017 to 2032
Figure 80: Latin America Market Value Share (%) and BPS Analysis by Application, 2022 to 2032
Figure 81: Latin America Market Y-o-Y Growth (%) Projections by Application, 2022 to 2032
Figure 82: Latin America Market Value (US$ million) Analysis by Sales Channel, 2017 to 2032
Figure 83: Latin America Market Volume (Units) Analysis by Sales Channel, 2017 to 2032
Figure 84: Latin America Market Value Share (%) and BPS Analysis by Sales Channel, 2022 to 2032
Figure 85: Latin America Market Y-o-Y Growth (%) Projections by Sales Channel, 2022 to 2032
Figure 86: Latin America Market Attractiveness by Product Type, 2022 to 2032
Figure 87: Latin America Market Attractiveness by Type, 2022 to 2032
Figure 88: Latin America Market Attractiveness by Application, 2022 to 2032
Figure 89: Latin America Market Attractiveness by Sales Channel, 2022 to 2032
Figure 90: Latin America Market Attractiveness by Country, 2022 to 2032
Figure 91: Europe Market Value (US$ million) by Product Type, 2022 to 2032
Figure 92: Europe Market Value (US$ million) by Type, 2022 to 2032
Figure 93: Europe Market Value (US$ million) by Application, 2022 to 2032
Figure 94: Europe Market Value (US$ million) by Sales Channel, 2022 to 2032
Figure 95: Europe Market Value (US$ million) by Country, 2022 to 2032
Figure 96: Europe Market Value (US$ million) Analysis by Country, 2017 to 2032
Figure 97: Europe Market Volume (Units) Analysis by Country, 2017 to 2032
Figure 98: Europe Market Value Share (%) and BPS Analysis by Country, 2022 to 2032
Figure 99: Europe Market Y-o-Y Growth (%) Projections by Country, 2022 to 2032
Figure 100: Europe Market Value (US$ million) Analysis by Product Type, 2017 to 2032
Figure 101: Europe Market Volume (Units) Analysis by Product Type, 2017 to 2032
Figure 102: Europe Market Value Share (%) and BPS Analysis by Product Type, 2022 to 2032
Figure 103: Europe Market Y-o-Y Growth (%) Projections by Product Type, 2022 to 2032
Figure 104: Europe Market Value (US$ million) Analysis by Type, 2017 to 2032
Figure 105: Europe Market Volume (Units) Analysis by Type, 2017 to 2032
Figure 106: Europe Market Value Share (%) and BPS Analysis by Type, 2022 to 2032
Figure 107: Europe Market Y-o-Y Growth (%) Projections by Type, 2022 to 2032
Figure 108: Europe Market Value (US$ million) Analysis by Application, 2017 to 2032
Figure 109: Europe Market Volume (Units) Analysis by Application, 2017 to 2032
Figure 110: Europe Market Value Share (%) and BPS Analysis by Application, 2022 to 2032
Figure 111: Europe Market Y-o-Y Growth (%) Projections by Application, 2022 to 2032
Figure 112: Europe Market Value (US$ million) Analysis by Sales Channel, 2017 to 2032
Figure 113: Europe Market Volume (Units) Analysis by Sales Channel, 2017 to 2032
Figure 114: Europe Market Value Share (%) and BPS Analysis by Sales Channel, 2022 to 2032
Figure 115: Europe Market Y-o-Y Growth (%) Projections by Sales Channel, 2022 to 2032
Figure 116: Europe Market Attractiveness by Product Type, 2022 to 2032
Figure 117: Europe Market Attractiveness by Type, 2022 to 2032
Figure 118: Europe Market Attractiveness by Application, 2022 to 2032
Figure 119: Europe Market Attractiveness by Sales Channel, 2022 to 2032
Figure 120: Europe Market Attractiveness by Country, 2022 to 2032
Figure 121: East Asia Market Value (US$ million) by Product Type, 2022 to 2032
Figure 122: East Asia Market Value (US$ million) by Type, 2022 to 2032
Figure 123: East Asia Market Value (US$ million) by Application, 2022 to 2032
Figure 124: East Asia Market Value (US$ million) by Sales Channel, 2022 to 2032
Figure 125: East Asia Market Value (US$ million) by Country, 2022 to 2032
Figure 126: East Asia Market Value (US$ million) Analysis by Country, 2017 to 2032
Figure 127: East Asia Market Volume (Units) Analysis by Country, 2017 to 2032
Figure 128: East Asia Market Value Share (%) and BPS Analysis by Country, 2022 to 2032
Figure 129: East Asia Market Y-o-Y Growth (%) Projections by Country, 2022 to 2032
Figure 130: East Asia Market Value (US$ million) Analysis by Product Type, 2017 to 2032
Figure 131: East Asia Market Volume (Units) Analysis by Product Type, 2017 to 2032
Figure 132: East Asia Market Value Share (%) and BPS Analysis by Product Type, 2022 to 2032
Figure 133: East Asia Market Y-o-Y Growth (%) Projections by Product Type, 2022 to 2032
Figure 134: East Asia Market Value (US$ million) Analysis by Type, 2017 to 2032
Figure 135: East Asia Market Volume (Units) Analysis by Type, 2017 to 2032
Figure 136: East Asia Market Value Share (%) and BPS Analysis by Type, 2022 to 2032
Figure 137: East Asia Market Y-o-Y Growth (%) Projections by Type, 2022 to 2032
Figure 138: East Asia Market Value (US$ million) Analysis by Application, 2017 to 2032
Figure 139: East Asia Market Volume (Units) Analysis by Application, 2017 to 2032
Figure 140: East Asia Market Value Share (%) and BPS Analysis by Application, 2022 to 2032
Figure 141: East Asia Market Y-o-Y Growth (%) Projections by Application, 2022 to 2032
Figure 142: East Asia Market Value (US$ million) Analysis by Sales Channel, 2017 to 2032
Figure 143: East Asia Market Volume (Units) Analysis by Sales Channel, 2017 to 2032
Figure 144: East Asia Market Value Share (%) and BPS Analysis by Sales Channel, 2022 to 2032
Figure 145: East Asia Market Y-o-Y Growth (%) Projections by Sales Channel, 2022 to 2032
Figure 146: East Asia Market Attractiveness by Product Type, 2022 to 2032
Figure 147: East Asia Market Attractiveness by Type, 2022 to 2032
Figure 148: East Asia Market Attractiveness by Application, 2022 to 2032
Figure 149: East Asia Market Attractiveness by Sales Channel, 2022 to 2032
Figure 150: East Asia Market Attractiveness by Country, 2022 to 2032
Figure 151: South Asia Market Value (US$ million) by Product Type, 2022 to 2032
Figure 152: South Asia Market Value (US$ million) by Type, 2022 to 2032
Figure 153: South Asia Market Value (US$ million) by Application, 2022 to 2032
Figure 154: South Asia Market Value (US$ million) by Sales Channel, 2022 to 2032
Figure 155: South Asia Market Value (US$ million) by Country, 2022 to 2032
Figure 156: South Asia Market Value (US$ million) Analysis by Country, 2017 to 2032
Figure 157: South Asia Market Volume (Units) Analysis by Country, 2017 to 2032
Figure 158: South Asia Market Value Share (%) and BPS Analysis by Country, 2022 to 2032
Figure 159: South Asia Market Y-o-Y Growth (%) Projections by Country, 2022 to 2032
Figure 160: South Asia Market Value (US$ million) Analysis by Product Type, 2017 to 2032
Figure 161: South Asia Market Volume (Units) Analysis by Product Type, 2017 to 2032
Figure 162: South Asia Market Value Share (%) and BPS Analysis by Product Type, 2022 to 2032
Figure 163: South Asia Market Y-o-Y Growth (%) Projections by Product Type, 2022 to 2032
Figure 164: South Asia Market Value (US$ million) Analysis by Type, 2017 to 2032
Figure 165: South Asia Market Volume (Units) Analysis by Type, 2017 to 2032
Figure 166: South Asia Market Value Share (%) and BPS Analysis by Type, 2022 to 2032
Figure 167: South Asia Market Y-o-Y Growth (%) Projections by Type, 2022 to 2032
Figure 168: South Asia Market Value (US$ million) Analysis by Application, 2017 to 2032
Figure 169: South Asia Market Volume (Units) Analysis by Application, 2017 to 2032
Figure 170: South Asia Market Value Share (%) and BPS Analysis by Application, 2022 to 2032
Figure 171: South Asia Market Y-o-Y Growth (%) Projections by Application, 2022 to 2032
Figure 172: South Asia Market Value (US$ million) Analysis by Sales Channel, 2017 to 2032
Figure 173: South Asia Market Volume (Units) Analysis by Sales Channel, 2017 to 2032
Figure 174: South Asia Market Value Share (%) and BPS Analysis by Sales Channel, 2022 to 2032
Figure 175: South Asia Market Y-o-Y Growth (%) Projections by Sales Channel, 2022 to 2032
Figure 176: South Asia Market Attractiveness by Product Type, 2022 to 2032
Figure 177: South Asia Market Attractiveness by Type, 2022 to 2032
Figure 178: South Asia Market Attractiveness by Application, 2022 to 2032
Figure 179: South Asia Market Attractiveness by Sales Channel, 2022 to 2032
Figure 180: South Asia Market Attractiveness by Country, 2022 to 2032
Figure 181: Oceania Market Value (US$ million) by Product Type, 2022 to 2032
Figure 182: Oceania Market Value (US$ million) by Type, 2022 to 2032
Figure 183: Oceania Market Value (US$ million) by Application, 2022 to 2032
Figure 184: Oceania Market Value (US$ million) by Sales Channel, 2022 to 2032
Figure 185: Oceania Market Value (US$ million) by Country, 2022 to 2032
Figure 186: Oceania Market Value (US$ million) Analysis by Country, 2017 to 2032
Figure 187: Oceania Market Volume (Units) Analysis by Country, 2017 to 2032
Figure 188: Oceania Market Value Share (%) and BPS Analysis by Country, 2022 to 2032
Figure 189: Oceania Market Y-o-Y Growth (%) Projections by Country, 2022 to 2032
Figure 190: Oceania Market Value (US$ million) Analysis by Product Type, 2017 to 2032
Figure 191: Oceania Market Volume (Units) Analysis by Product Type, 2017 to 2032
Figure 192: Oceania Market Value Share (%) and BPS Analysis by Product Type, 2022 to 2032
Figure 193: Oceania Market Y-o-Y Growth (%) Projections by Product Type, 2022 to 2032
Figure 194: Oceania Market Value (US$ million) Analysis by Type, 2017 to 2032
Figure 195: Oceania Market Volume (Units) Analysis by Type, 2017 to 2032
Figure 196: Oceania Market Value Share (%) and BPS Analysis by Type, 2022 to 2032
Figure 197: Oceania Market Y-o-Y Growth (%) Projections by Type, 2022 to 2032
Figure 198: Oceania Market Value (US$ million) Analysis by Application, 2017 to 2032
Figure 199: Oceania Market Volume (Units) Analysis by Application, 2017 to 2032
Figure 200: Oceania Market Value Share (%) and BPS Analysis by Application, 2022 to 2032
Figure 201: Oceania Market Y-o-Y Growth (%) Projections by Application, 2022 to 2032
Figure 202: Oceania Market Value (US$ million) Analysis by Sales Channel, 2017 to 2032
Figure 203: Oceania Market Volume (Units) Analysis by Sales Channel, 2017 to 2032
Figure 204: Oceania Market Value Share (%) and BPS Analysis by Sales Channel, 2022 to 2032
Figure 205: Oceania Market Y-o-Y Growth (%) Projections by Sales Channel, 2022 to 2032
Figure 206: Oceania Market Attractiveness by Product Type, 2022 to 2032
Figure 207: Oceania Market Attractiveness by Type, 2022 to 2032
Figure 208: Oceania Market Attractiveness by Application, 2022 to 2032
Figure 209: Oceania Market Attractiveness by Sales Channel, 2022 to 2032
Figure 210: Oceania Market Attractiveness by Country, 2022 to 2032
Figure 211: Middle East and Africa Market Value (US$ million) by Product Type, 2022 to 2032
Figure 212: Middle East and Africa Market Value (US$ million) by Type, 2022 to 2032
Figure 213: Middle East and Africa Market Value (US$ million) by Application, 2022 to 2032
Figure 214: Middle East and Africa Market Value (US$ million) by Sales Channel, 2022 to 2032
Figure 215: Middle East and Africa Market Value (US$ million) by Country, 2022 to 2032
Figure 216: Middle East and Africa Market Value (US$ million) Analysis by Country, 2017 to 2032
Figure 217: Middle East and Africa Market Volume (Units) Analysis by Country, 2017 to 2032
Figure 218: Middle East and Africa Market Value Share (%) and BPS Analysis by Country, 2022 to 2032
Figure 219: Middle East and Africa Market Y-o-Y Growth (%) Projections by Country, 2022 to 2032
Figure 220: Middle East and Africa Market Value (US$ million) Analysis by Product Type, 2017 to 2032
Figure 221: Middle East and Africa Market Volume (Units) Analysis by Product Type, 2017 to 2032
Figure 222: Middle East and Africa Market Value Share (%) and BPS Analysis by Product Type, 2022 to 2032
Figure 223: Middle East and Africa Market Y-o-Y Growth (%) Projections by Product Type, 2022 to 2032
Figure 224: Middle East and Africa Market Value (US$ million) Analysis by Type, 2017 to 2032
Figure 225: Middle East and Africa Market Volume (Units) Analysis by Type, 2017 to 2032
Figure 226: Middle East and Africa Market Value Share (%) and BPS Analysis by Type, 2022 to 2032
Figure 227: Middle East and Africa Market Y-o-Y Growth (%) Projections by Type, 2022 to 2032
Figure 228: Middle East and Africa Market Value (US$ million) Analysis by Application, 2017 to 2032
Figure 229: Middle East and Africa Market Volume (Units) Analysis by Application, 2017 to 2032
Figure 230: Middle East and Africa Market Value Share (%) and BPS Analysis by Application, 2022 to 2032
Figure 231: Middle East and Africa Market Y-o-Y Growth (%) Projections by Application, 2022 to 2032
Figure 232: Middle East and Africa Market Value (US$ million) Analysis by Sales Channel, 2017 to 2032
Figure 233: Middle East and Africa Market Volume (Units) Analysis by Sales Channel, 2017 to 2032
Figure 234: Middle East and Africa Market Value Share (%) and BPS Analysis by Sales Channel, 2022 to 2032
Figure 235: Middle East and Africa Market Y-o-Y Growth (%) Projections by Sales Channel, 2022 to 2032
Figure 236: Middle East and Africa Market Attractiveness by Product Type, 2022 to 2032
Figure 237: Middle East and Africa Market Attractiveness by Type, 2022 to 2032
Figure 238: Middle East and Africa Market Attractiveness by Application, 2022 to 2032
Figure 239: Middle East and Africa Market Attractiveness by Sales Channel, 2022 to 2032
Figure 240: Middle East and Africa Market Attractiveness by Country, 2022 to 2032
Need specific information?
Request CustomizationExplore Process Automation Insights
View Reports