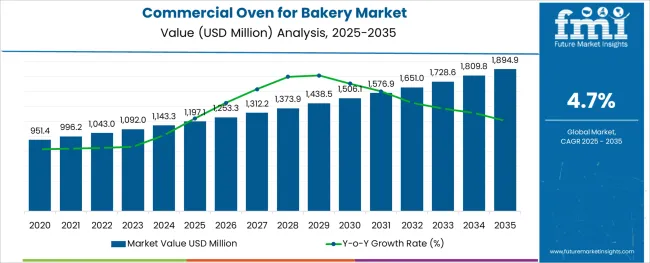
The global commercial oven for bakery market is projected to have a slow-paced CAGR of 4.7% during the forecast period. The current valuation of the market is USD 1092 million in 2023. The market value of the commercial oven for the bakery market is anticipated to reach a high of USD 1,635.5 million by the year 2033. A historical market valuation of USD 1037.9 million in 2022 has been recorded by the experts of Future Market Insights for the concerned market during the base year.
This growth is supported by the following:
The manufacturers are paying attention to energy conservation and energy-efficient designs because consumers are demanding an oven from which they can save money on electricity.
Commercial ovens for bakeries have gained popularity due to the high demand for baked goods. Restaurants, hotels, and bakeries have found an increase in the demand for commercial ovens because of the decline in the taste preferences of the customers in comparison with traditional food. As the consumption of pizzas, burgers, and pastries has increased, so has the demand for commercial ovens for bakeries.
There has been a growing increase in the number of people working, an increase in disposable income, and a change in living standards. These factors have all contributed to an increase in the growth of the global commercial market. A major factor that has contributed to the increase in the demand for commercial ovens has been the growth of online platforms such as Zomato and Swiggy. In these platforms, there is the opportunity for consumers to order food online and receive discounts, which has contributed to the growth of the commercial oven for the bakery market.
The commercial oven for the bakery market in North America has the highest percentage of revenue share due to the high demand for technology that varies according to the preferences of the customers in this market. In spite of the fact that the market is growing at a healthy rate, Future Market Insights has also found that certain aspects are likely to hamper the pace of advancement in the long run. The curbing element can be summed up as follows:
The high cost associated with the ownership of baking ovens, in addition to the high maintenance costs of these ovens, may hinder the growth of the commercial oven for the bakery market.
Moreover, in the bakery oven market, there is fragmentation, and it is expected that the degree of fragmentation will increase during the forecast period. Market vendors must strengthen their foothold in the fast-growing segments while maintaining their positions in the slow-growing segments in order to maximize the current opportunities.
As a result of factors such as increased demand for high-quality bakery products, the expansion of bakery processing plants, and the manufacture of commercial bakery ovens that will comply with industry standards, the bakery industry is expected to experience immense growth over the next few years.
Report Attribute | Details |
---|---|
Commercial Oven for Bakery Market Value (2023) | USD 1092 million |
Commercial Oven for Bakery Market Anticipated Value (2033) | USD 1635.5 million |
Commercial Oven for Bakery Projected Growth Rate (2023 to 2033) | 4.7% |
In a market analysis conducted by FMI experts, it has been revealed that the commercial oven market for bakeries has been experiencing unprecedented growth in recent years. From 2022 to 2023, the market is expected to grow by approximately USD 54 million. During the period 2017 to 2022, the market registered a 3.2% CAGR.
As a result of the demand for the high volume of bakery products such as cakes, pies, cooking, bread, brownies, and other pastries, there has been a spike in the sale of commercial ovens for bakeries. As consumers’ preferences and needs change, bakery manufacturers are working to improve their product offerings to meet these changes.
Electrically Operated- By Operation Type
It is identified that the electrically operated commercial oven for bakery is the most recognized in the operation type category and has accounted for major shares during the base year. Currently, the electrically operated segment is anticipated to propel at a substantial rate, registering a CAGR of 4.4%. The segment accounted for a historical CAGR of 3.7% during the base period of 2017 to 2022. The reasons attributing to the steady advancement of the electrically operated commercial ovens for the bakery are identified as follows:
An increasing number of restaurants and hotels produce a large volume of food that must be reheated and defrosted. These restaurants find a wide range of applications for ovens.
Process- By Process Type
FMI has analyzed that the process segment accounts for the highest market share in the global commercial oven for the bakery market. At present, this segment is moving forward at a moderate pace, recording a CAGR of 3.8%. The segment accounted for a historical CAGR of 3% during the period from 2017 to 2022.
Country | United States of America |
---|---|
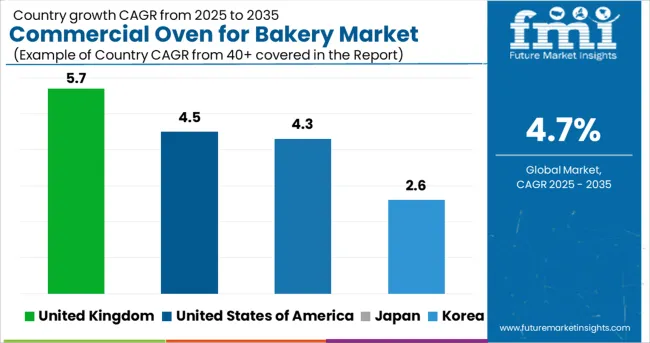
Statistics | The commercial oven for the bakery market in the USA currently holds the maximum number of shares and has registered a market valuation of USD 146.8 million in 2023. The market is projected to reach a valuation of USD 408.8 million by the end of 2033. CAGR for 2023 to 2033: 4.5% Historical CAGR (2018 to 2022): 4% |
Growth Propellants | The expanding market shares can be attributed to:
|
Country | United Kingdom |
---|---|
Statistics | Europe is identified to hold a significant market share in the commercial oven for the bakery market. Currently, the UK is the leading country and is accountable for a market valuation of USD 48.9 million in 2023, advancing at a moderate-paced CAGR of 5.7%. The market valuation is expected to surpass USD 114.4 Million by 2033. Historical CAGR (2018 to 2022): 3.2% |
Growth Propellants | Elements contributing to the growth of the market in the European region are:
|
Country | Japan |
---|---|
Statistics | Japan is projected to advance at a rapid pace, registering a CAGR of 4.3% through the forecast period. The country is currently holding a market valuation of USD 35.3 million in 2023. FMI estimates valuation to surpass USD 103.1 million by the end of 2033. Historical CAGR (2018 to 2022): 3.2% |
Growth Propellants | Factors contributing to the growth of the commercial oven for bakery market in Japan are:
|
Country | Korea |
---|---|
Statistics | The Korean commercial oven for bakery market is anticipated to advance at a slow-paced CAGR of 2.6% during the forecast period. At present, the market is holding a valuation of USD 9.2 million in 2023. The analysts at FMI have projected a market value of USD 40.8 million by 2033. Historical CAGR (2018 to 2022): 2.5% |
Growth Propellants | The factors attributing to the growth of the market in Korea are:
|
Emerging Companies Add an Edge to the Commercial Oven for Bakery Market Dynamics
The new entrants in the commercial oven for the bakery market are leveraging advances in technology to launch new products and gain a competitive advantage by leveraging advancements in technology. In order to remain competitive with consumer preferences and end-use industry demands, these firms invest continuously in research and development activities. As part of their efforts to strengthen their position within the forum and to assist in the further development of the bakery oven, efforts are being made to strengthen their foothold in the industry.
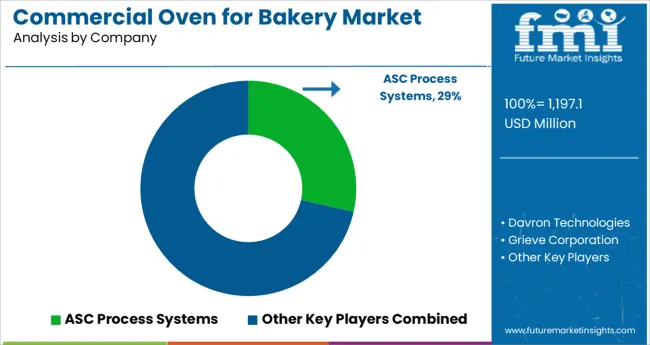
The Key Players are making an Effort to Revamp the Market Dynamics by Revising their Strategies
A statistical study conducted by Future Market Insights in the concerned machinery market reveals several successful business strategies deployed by the major vendors of commercial ovens in the industry. In order to compete in the highly fragmented bakery oven market, vendors are deploying both organic and inorganic growth strategies to compete against each other.
In order to provide the end users with the finest quality bakery products, the manufacturers invest a significant number of resources into research and development activities, which helps them acquire more shares of the global market as they continue to make technological advancements in the machinery.
Some Commercial Oven for Bakery Global Forums
Recent Developments
Attribute | Details |
---|---|
Forecast Period | 2023 to 2033 |
Historical Data Available for | 2018 to 2022 |
Market Analysis | USD Billion for Value and MT for Volume |
Key Regions Covered | North America; Latin America; Europe; East Asia; South Asia; Oceania; and the Middle East & Africa |
Key Countries Covered | USA, Canada, Brazil, Mexico, Chile, Peru, Germany, UK, Spain, Italy, France, Russia, Poland, China, India, Japan, Australia, New Zealand, GCC Countries, North Africa, South Africa, and Turkey |
Key Segments Covered | Operation Mode, Installation Type, Process, Sales Channel, Region |
Key Companies Profiled | ASC Process Systems; Harper International; Rowan Technologies; Wisconsin Oven Corporation; JPW Ovens; Davron Technologies |
Report Coverage | Market Forecast, Company Share Analysis, Competition Intelligence, Drivers, Restraints, Opportunities and Threats Analysis, Market Dynamics and Challenges, and Strategic Growth Initiatives |
Customization & Pricing | Available upon Request |
{Food Equipment Speciality Retailers, Brand Franchised Stores, Modern Trade, E-commerce Platforms, Others}
Table 1: Global Market Value (US$ Million) Analysis, by Operation Type, 2018 to 2022
Table 2: Global Market Value (US$ Million) Analysis, by Operation Type, 2023 to 2033
Table 3: Global Market Value (US$ Million) Analysis, By Installation Type, 2018 to 2022
Table 4: Global Market Value (US$ Million) Analysis, By Installation Type, 2023 to 2033
Table 5: Global Market Value (US$ Million) Analysis, By Process, 2018 to 2022
Table 6: Global Market Value (US$ Million) Analysis, By Process, 2023 to 2033
Table 7: Global Market Value (US$ Million) Analysis, by Sales Channel, 2018 to 2022
Table 8: Global Market Value (US$ Million) Analysis, by Sales Channel, 2023 to 2033
Table 9: Global Market Value (US$ Million) Analysis, by Region, 2018 to 2022
Table 10: Global Market Value (US$ Million) Analysis, by Region, 2023 to 2033
Table 11: North America Market Value (US$ Million) Analysis, by Operation Type, 2018 to 2022
Table 12: North America Market Value (US$ Million) Analysis, by Operation Type, 2023 to 2033
Table 13: North America Market Value (US$ Million) Analysis, By Installation Type, 2018 to 2022
Table 14: North America Market Value (US$ Million) Analysis, By Installation Type, 2023 to 2033
Table 15: North America Market Value (US$ Million) Analysis, By Process, 2018 to 2022
Table 16: North America Market Value (US$ Million) Analysis, By Process, 2023 to 2033
Table 17: North America Market Value (US$ Million) Analysis, by Sales Channel, 2018 to 2022
Table 18: North America Market Value (US$ Million) Analysis, by Sales Channel, 2023 to 2033
Table 19: North America Market Value (US$ Million) Analysis, by Region, 2018 to 2022
Table 20: North America Market Value (US$ Million) Analysis, by Region, 2023 to 2033
Table 21: Latin America Market Value (US$ Million) Analysis, by Operation Type, 2018 to 2022
Table 22: Latin America Market Value (US$ Million) Analysis, by Operation Type, 2023 to 2033
Table 23: Latin America Market Value (US$ Million) Analysis, By Installation Type, 2018 to 2022
Table 24: Latin America Market Value (US$ Million) Analysis, By Installation Type, 2023 to 2033
Table 25: Latin America Market Value (US$ Million) Analysis, By Process, 2018 to 2022
Table 26: Latin America Market Value (US$ Million) Analysis, By Process, 2023 to 2033
Table 27: Latin America Market Value (US$ Million) Analysis, by Sales Channel, 2018 to 2022
Table 28: Latin America Market Value (US$ Million) Analysis, by Sales Channel, 2023 to 2033
Table 29: Latin America Market Value (US$ Million) Analysis, by Region, 2018 to 2022
Table 30: Latin America Market Value (US$ Million) Analysis, by Region, 2023 to 2033
Table 31: Europe Market Value (US$ Million) Analysis, by Operation Type, 2018 to 2022
Table 32: Europe Market Value (US$ Million) Analysis, by Operation Type, 2023 to 2033
Table 33: Europe Market Value (US$ Million) Analysis, By Installation Type, 2018 to 2022
Table 34: Europe Market Value (US$ Million) Analysis, By Installation Type, 2023 to 2033
Table 35: Europe Market Value (US$ Million) Analysis, By Process, 2018 to 2022
Table 36: Europe Market Value (US$ Million) Analysis, By Process, 2023 to 2033
Table 37: Europe Market Value (US$ Million) Analysis, by Sales Channel, 2018 to 2022
Table 38: Europe Market Value (US$ Million) Analysis, by Sales Channel, 2023 to 2033
Table 39: Europe Market Value (US$ Million) Analysis, by Region, 2018 to 2022
Table 40: Europe Market Value (US$ Million) Analysis, by Region, 2023 to 2033
Table 41: East Asia Market Value (US$ Million) Analysis, by Operation Type, 2018 to 2022
Table 42: East Asia Market Value (US$ Million) Analysis, by Operation Type, 2023 to 2033
Table 43: East Asia Market Value (US$ Million) Analysis, By Installation Type, 2018 to 2022
Table 44: East Asia Market Value (US$ Million) Analysis, By Installation Type, 2023 to 2033
Table 45: East Asia Market Value (US$ Million) Analysis, By Process, 2018 to 2022
Table 46: East Asia Market Value (US$ Million) Analysis, By Process, 2023 to 2033
Table 47: East Asia Market Value (US$ Million) Analysis, by Sales Channel, 2018 to 2022
Table 48: East Asia Market Value (US$ Million) Analysis, by Sales Channel, 2023 to 2033
Table 49: East Asia Market Value (US$ Million) Analysis, by Region, 2018 to 2022
Table 50: East Asia Market Value (US$ Million) Analysis, by Region, 2023 to 2033
Table 51: South Asia & Oceania Market Value (US$ Million) Analysis, by Operation Type, 2018 to 2022
Table 52: South Asia & Oceania Market Value (US$ Million) Analysis, by Operation Type, 2023 to 2033
Table 53: South Asia & Oceania Market Value (US$ Million) Analysis, By Installation Type, 2018 to 2022
Table 54: South Asia & Oceania Market Value (US$ Million) Analysis, By Installation Type, 2023 to 2033
Table 55: South Asia & Oceania Market Value (US$ Million) Analysis, By Process, 2018 to 2022
Table 56: South Asia & Oceania Market Value (US$ Million) Analysis, By Process, 2023 to 2033
Table 57: South Asia & Oceania Market Value (US$ Million) Analysis, by Sales Channel, 2018 to 2022
Table 58: South Asia & Oceania Market Value (US$ Million) Analysis, by Sales Channel, 2023 to 2033
Table 59: South Asia & Oceania Market Value (US$ Million) Analysis, by Region, 2018 to 2022
Table 60: South Asia & Oceania Market Value (US$ Million) Analysis, by Region, 2023 to 2033
Table 61: MEA Market Value (US$ Million) Analysis, by Operation Type, 2018 to 2022
Table 62: MEA Market Value (US$ Million) Analysis, by Operation Type, 2023 to 2033
Table 63: MEA Market Value (US$ Million) Analysis, By Installation Type, 2018 to 2022
Table 64: MEA Market Value (US$ Million) Analysis, By Installation Type, 2023 to 2033
Table 65: MEA Market Value (US$ Million) Analysis, By Process, 2018 to 2022
Table 66: MEA Market Value (US$ Million) Analysis, By Process, 2023 to 2033
Table 67: MEA Market Value (US$ Million) Analysis, by Sales Channel, 2018 to 2022
Table 68: MEA Market Value (US$ Million) Analysis, by Sales Channel, 2023 to 2033
Table 69: MEA Market Value (US$ Million) Analysis, by Region, 2018 to 2022
Table 70: MEA Market Value (US$ Million) Analysis, by Region, 2023 to 2033
Figure 1: Global Market Value (US$ Million) Historical Analysis, 2018 to 2022
Figure 2: Global Market Value (US$ Million) Forecast and Analysis, 2023 to 2033
Figure 3: Global Market Value Y-o-Y Growth and Forecast, 2019 to 2033
Figure 4: Global Market Incremental $ Opportunity, 2023 to 2033
Figure 5: Global Market Share and BPS Analysis By Operation Mode, 2023 to 2033
Figure 6: Global Market Y-o-Y Growth Projections By Operation Mode, 2023 to 2033
Figure 7: Global Market Attractiveness Analysis By Operation Mode, 2023 to 2033
Figure 8: Global Market Share and BPS Analysis By Installation Type, 2023 to 2033
Figure 9: Global Market Y-o-Y Growth Projections By Installation Type, 2023 to 2033
Figure 10: Global Market Attractiveness Analysis By Installation Type, 2023 to 2033
Figure 11: Global Market Share and BPS Analysis By Process, 2023 to 2033
Figure 12: Global Market Y-o-Y Growth Projections By Process, 2023 to 2033
Figure 13: Global Market Attractiveness Analysis By Process, 2023 to 2033
Figure 14: Global Market Share and BPS Analysis by Sales Channel, 2023 to 2033
Figure 15: Global Market Y-o-Y Growth Projections by Sales Channel, 2023 to 2033
Figure 16: Global Market Attractiveness Analysis by Sales Channel, 2023 to 2033
Figure 17: Global Market Share and BPS Analysis by Region, 2023 to 2033
Figure 18: Global Market Y-o-Y Growth Projections by Region, 2023 to 2033
Figure 19: Global Market Attractiveness Analysis by Region, 2023 to 2033
Figure 20: North America Market Value (US$ Million) Historical Analysis, 2018 to 2022
Figure 21: North America Market Value (US$ Million) Forecast and Analysis, 2023 to 2033
Figure 22: North America Market Value Y-o-Y Growth and Forecast, 2019 to 2033
Figure 23: North America Market Incremental $ Opportunity, 2023 to 2033
Figure 24: North America Market Share Analysis by Country, 2023 to 2033
Figure 25: North America Market Y-o-Y Growth Projection by Country, 2023 to 2033
Figure 26: North America Market Attractiveness Analysis by Country, 2023 to 2033
Figure 27: North America Market Share and BPS Analysis By Operation Mode, 2023 to 2033
Figure 28: North America Market Y-o-Y Growth Projections By Operation Mode, 2023 to 2033
Figure 29: North America Market Attractiveness Analysis By Operation Mode, 2023 to 2033
Figure 30: North America Market Share and BPS Analysis By Installation Type, 2023 to 2033
Figure 31: North America Market Y-o-Y Growth Projections By Installation Type, 2023 to 2033
Figure 32: North America Market Attractiveness Analysis By Installation Type, 2023 to 2033
Figure 33: North America Market Share and BPS Analysis By Process, 2023 to 2033
Figure 34: North America Market Y-o-Y Growth Projections By Process, 2023 to 2033
Figure 35: North America Market Attractiveness Analysis By Process, 2023 to 2033
Figure 36: North America Market Share and BPS Analysis by Sales Channel, 2023 to 2033
Figure 37: North America Market Y-o-Y Growth Projections by Sales Channel, 2023 to 2033
Figure 38: North America Market Attractiveness Analysis by Sales Channel, 2023 to 2033
Figure 39: Latin America Market Value (US$ Million) Historical Analysis, 2018 to 2022
Figure 40: Latin America Market Value (US$ Million) Forecast and Analysis, 2023 to 2033
Figure 41: Latin America Market Value Y-o-Y Growth and Forecast, 2019 to 2033
Figure 42: Latin America Market Incremental $ Opportunity, 2023 to 2033
Figure 43: Latin America Market Share Analysis by Country, 2023 to 2033
Figure 44: Latin America Market Y-o-Y Growth Projection by Country, 2023 to 2033
Figure 45: Latin America Market Attractiveness Analysis by Country, 2023 to 2033
Figure 46: Latin America Market Share and BPS Analysis By Operation Mode, 2023 to 2033
Figure 47: Latin America Market Y-o-Y Growth Projections By Operation Mode, 2023 to 2033
Figure 48: Latin America Market Attractiveness Analysis By Operation Mode, 2023 to 2033
Figure 49: Latin America Market Share and BPS Analysis By Installation Type, 2023 to 2033
Figure 50: Latin America Market Y-o-Y Growth Projections By Installation Type, 2023 to 2033
Figure 51: Latin America Market Attractiveness Analysis By Installation Type, 2023 to 2033
Figure 52: Latin America Market Share and BPS Analysis By Process, 2023 to 2033
Figure 53: Latin America Market Y-o-Y Growth Projections By Process, 2023 to 2033
Figure 54: Latin America Market Attractiveness Analysis By Process, 2023 to 2033
Figure 55: Latin America Market Share and BPS Analysis by Sales Channel, 2023 to 2033
Figure 56: Latin America Market Y-o-Y Growth Projections by Sales Channel, 2023 to 2033
Figure 57: Latin America Market Attractiveness Analysis by Sales Channel, 2023 to 2033
Figure 58: Europe Market Value (US$ Million) Historical Analysis, 2018 to 2022
Figure 59: Europe Market Value (US$ Million) Forecast and Analysis, 2023 to 2033
Figure 60: Europe Market Value Y-o-Y Growth and Forecast, 2019 to 2033
Figure 61: Europe Market Incremental $ Opportunity, 2023 to 2033
Figure 62: Europe Market Share Analysis by Country, 2023 to 2033
Figure 63: Europe Market Y-o-Y Growth Projection by Country, 2023 to 2033
Figure 64: Europe Market Attractiveness Analysis by Country, 2023 to 2033
Figure 65: Europe Market Share and BPS Analysis By Operation Mode, 2023 to 2033
Figure 66: Europe Market Y-o-Y Growth Projections By Operation Mode, 2023 to 2033
Figure 67: Europe Market Attractiveness Analysis By Operation Mode, 2023 to 2033
Figure 68: Europe Market Share and BPS Analysis By Installation Type, 2023 to 2033
Figure 69: Europe Market Y-o-Y Growth Projections By Installation Type, 2023 to 2033
Figure 70: Europe Market Attractiveness Analysis By Installation Type, 2023 to 2033
Figure 71: Europe Market Share and BPS Analysis By Process, 2023 to 2033
Figure 72: Europe Market Y-o-Y Growth Projections By Process, 2023 to 2033
Figure 73: Europe Market Attractiveness Analysis By Process, 2023 to 2033
Figure 74: Europe Market Share and BPS Analysis by Sales Channel, 2023 to 2033
Figure 75: Europe Market Y-o-Y Growth Projections by Sales Channel, 2023 to 2033
Figure 76: Europe Market Attractiveness Analysis by Sales Channel, 2023 to 2033
Figure 77: East Asia Market Value (US$ Million) Historical Analysis, 2018 to 2022
Figure 78: East Asia Market Value (US$ Million) Forecast and Analysis, 2023 to 2033
Figure 79: East Asia Market Value Y-o-Y Growth and Forecast, 2019 to 2033
Figure 80: East Asia Market Incremental $ Opportunity, 2023 to 2033
Figure 81: East Asia Market Share Analysis by Country, 2023 to 2033
Figure 82: East Asia Market Y-o-Y Growth Projection by Country, 2023 to 2033
Figure 83: East Asia Market Attractiveness Analysis by Country, 2023 to 2033
Figure 84: East Asia Market Share and BPS Analysis By Operation Mode, 2023 to 2033
Figure 85: East Asia Market Y-o-Y Growth Projections By Operation Mode, 2023 to 2033
Figure 86: East Asia Market Attractiveness Analysis By Operation Mode, 2023 to 2033
Figure 87: East Asia Market Share and BPS Analysis By Installation Type, 2023 to 2033
Figure 88: East Asia Market Y-o-Y Growth Projections By Installation Type, 2023 to 2033
Figure 89: East Asia Market Attractiveness Analysis By Installation Type, 2023 to 2033
Figure 90: East Asia Market Share and BPS Analysis By Process, 2023 to 2033
Figure 91: East Asia Market Y-o-Y Growth Projections By Process, 2023 to 2033
Figure 92: East Asia Market Attractiveness Analysis By Process, 2023 to 2033
Figure 93: East Asia Market Share and BPS Analysis by Sales Channel, 2023 to 2033
Figure 94: East Asia Market Y-o-Y Growth Projections by Sales Channel, 2023 to 2033
Figure 95: East Asia Market Attractiveness Analysis by Sales Channel, 2023 to 2033
Figure 96: South Asia & Oceania Market Value (US$ Million) Historical Analysis, 2018 to 2022
Figure 97: South Asia & Oceania Market Value (US$ Million) Forecast and Analysis, 2023 to 2033
Figure 98: South Asia & Oceania Market Value Y-o-Y Growth and Forecast, 2019 to 2033
Figure 99: South Asia & Oceania Market Incremental $ Opportunity, 2023 to 2033
Figure 100: South Asia & Oceania Market Share Analysis by Country, 2023 to 2033
Figure 101: South Asia & Oceania Market Y-o-Y Growth Projection by Country, 2023 to 2033
Figure 102: South Asia & Oceania Market Attractiveness Analysis by Country, 2023 to 2033
Figure 103: South Asia & Oceania Market Share and BPS Analysis By Operation Mode, 2023 to 2033
Figure 104: South Asia & Oceania Market Y-o-Y Growth Projections By Operation Mode, 2023 to 2033
Figure 105: South Asia & Oceania Market Attractiveness Analysis By Operation Mode, 2023 to 2033
Figure 106: South Asia & Oceania Market Share and BPS Analysis By Installation Type, 2023 to 2033
Figure 107: South Asia & Oceania Market Y-o-Y Growth Projections By Installation Type, 2023 to 2033
Figure 108: South Asia & Oceania Market Attractiveness Analysis By Installation Type, 2023 to 2033
Figure 109: South Asia & Oceania Market Share and BPS Analysis By Process, 2023 to 2033
Figure 110: South Asia & Oceania Market Y-o-Y Growth Projections By Process, 2023 to 2033
Figure 111: South Asia & Oceania Market Attractiveness Analysis By Process, 2023 to 2033
Figure 112: South Asia & Oceania Market Share and BPS Analysis by Sales Channel, 2023 to 2033
Figure 113: South Asia & Oceania Market Y-o-Y Growth Projections by Sales Channel, 2023 to 2033
Figure 114: South Asia & Oceania Market Attractiveness Analysis by Sales Channel, 2023 to 2033
Figure 115: MEA Market Value (US$ Million) Historical Analysis, 2018 to 2022
Figure 116: MEA Market Value (US$ Million) Forecast and Analysis, 2023 to 2033
Figure 117: MEA Market Value Y-o-Y Growth and Forecast, 2019 to 2033
Figure 118: MEA Market Incremental $ Opportunity, 2023 to 2033
Figure 119: MEA Market Share Analysis by Country, 2023 to 2033
Figure 120: MEA Market Y-o-Y Growth Projection by Country, 2023 to 2033
Figure 121: MEA Market Attractiveness Analysis by Country, 2023 to 2033
Figure 122: MEA Market Share and BPS Analysis By Operation Mode, 2023 to 2033
Figure 123: MEA Market Y-o-Y Growth Projections By Operation Mode, 2023 to 2033
Figure 124: MEA Market Attractiveness Analysis By Operation Mode, 2023 to 2033
Figure 125: MEA Market Share and BPS Analysis By Installation Type, 2023 to 2033
Figure 126: MEA Market Y-o-Y Growth Projections By Installation Type, 2023 to 2033
Figure 127: MEA Market Attractiveness Analysis By Installation Type, 2023 to 2033
Figure 128: MEA Market Share and BPS Analysis By Process, 2023 to 2033
Figure 129: MEA Market Y-o-Y Growth Projections By Process, 2023 to 2033
Figure 130: MEA Market Attractiveness Analysis By Process, 2023 to 2033
Figure 131: MEA Market Share and BPS Analysis by Sales Channel, 2023 to 2033
Figure 132: MEA Market Y-o-Y Growth Projections by Sales Channel, 2023 to 2033
Figure 133: MEA Market Attractiveness Analysis by Sales Channel, 2023 to 2033
The North American region is anticipated to lead the commercial oven for the bakery market during the forecast period.
The market valuation of the commercial oven for the bakery market stands at USD 1092 million in 2023.
The growth outlook for the commercial oven for the bakery market is predicted to advance at a CAGR of 4.7% from 2023 to 2033.
The commercial oven for the bakery market is likely to hold a valuation of USD 1635.5 million by 2033.
The electrically operated ovens are the key driver in the commercial oven for the bakery market.
Explore Similar Insights
Thank you!
You will receive an email from our Business Development Manager. Please be sure to check your SPAM/JUNK folder too.