Automotive Casting Market Size, Share, and Forecast Outlook (2025 to 2035)

The automotive casting market is valued at USD 6 billion in 2025 and is forecasted to reach nearly USD 11.6 billion by 2035, growing at a compound annual growth rate of 6.8%. The multiplying factor for this period is around 1.93x, showing that the market in 2035 will be nearly twice the size of its 2025 base. A 10-year growth comparison highlights a strong trajectory supported by increasing demand for lightweight components, rising production of electric vehicles, and advancements in casting techniques that improve efficiency and durability.
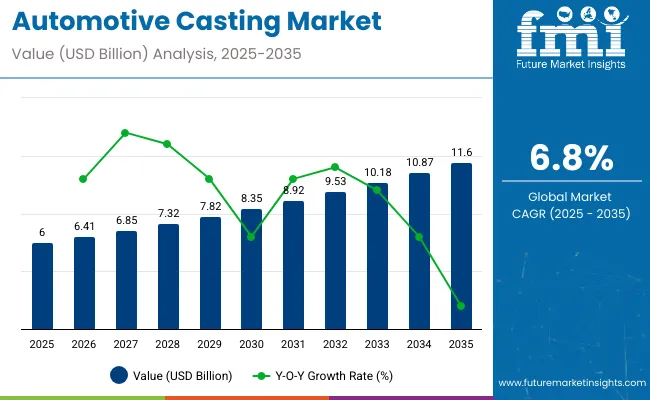
Quick stats of Automotive Casting Market

  • Automotive Casting Market Size (2025): USD 6 billion
  • Projected Automotive Casting Market Size (2035): USD 11.6 billion
  • Forecast CAGR of Automotive Casting Market (2025-2035): 6.8%
  • Leading Segment of Automotive Casting Market (2025): Die Casting with 45% share
  • Key Growth Regions of Automotive Casting Market: Asia Pacific, North America, Europe
  • Top Key Players of Automotive Casting Market: Endurance Technologies, Gibbs Die Casting, RegensburgerDruckgusswerk Wolf GmbH

Automotive Casting Market

Between 2025 and 2030, the market is expected to accelerate as automakers focus on weight reduction to meet stricter fuel efficiency and emission norms. This phase will see high adoption of aluminum and magnesium castings in powertrain, structural, and body applications. From 2030 to 2035, growth continues at a steady pace, driven by replacement of traditional materials with advanced alloys, expansion of electric vehicle manufacturing, and wider application of precision casting technologies.

The 10-year comparison highlights an almost twofold increase in market value, reflecting both the technological transformation of the automotive sector and consistent demand from manufacturers seeking cost-effective, durable, and lightweight casting solutions.

The automotive casting market draws strength from five broad parent markets. Automotive components contribute around 40%, since castings are essential in powertrain parts, chassis elements, and body structures. The global automotive sector adds nearly 25%, with overall vehicle production volumes dictating casting demand.

The metals and foundry segment accounts for about 20%, delivering aluminum, iron, and steel used in both lightweight and heavy-duty vehicle parts. Industrial manufacturing provides close to 10%, supporting machinery and processes that improve casting efficiency. Information and communication technology contributes roughly 5%, enabling design software, digital simulation, and process automation in modern casting.Current developments in the market are centered on efficiency, lightweight materials, and digital transformation. Leading companies including Nemak, Ryobi, Rheinmetall, and Endurance Technologies are investing in aluminum and magnesium alloys to cut vehicle weight and improve performance.

The shift toward electric mobility is boosting demand for precision-cast battery enclosures, motor housings, and structural supports. Advanced manufacturing techniques such as high-pressure die casting, additive manufacturing, and robotics are reshaping production capabilities. Strategic alliances between carmakers and foundry operators are common, as firms work toward lower emissions, reduced energy consumption, and higher durability while maintaining cost competitiveness.

Top Automotive Casting Market Dynamics

The automotive casting market is experiencing strong demand as vehicle manufacturers focus on efficiency and performance. Castings are widely applied in engines, chassis, and structural elements. In 2024, overall casting demand linked to automotive production crossed 80 million tons, with Asia Pacific contributing a large share. Aluminum and magnesium castings are increasingly replacing steel, enabling lighter vehicles with improved fuel efficiency. The expansion of electric and hybrid vehicles further increases the requirement for housings, battery casings, and lightweight drivetrain parts.

Driving Force Rising Vehicle Output and Lightweight Engineering

Vehicle production growth, particularly in passenger cars and logistics fleets, is boosting the need for cast components. Lightweight alloys lower the overall vehicle mass, helping automakers meet emission standards and fuel efficiency regulations. More than two-thirds of new vehicle designs now rely on cast structures for their cost-effectiveness and strength. Asia Pacific is the largest production hub, supported by low-cost manufacturing and domestic demand. Automotive OEMs are also pushing for stronger yet lighter castings to balance safety and energy efficiency.

  • Global automotive production exceeded 95 million units in 2024.
  • Magnesium castings reduce vehicle weight by an additional 10-12% compared to aluminum.
  • Casting adoption in commercial vehicles grew 6-7% annually.

Growth Avenue Technological Progress and EV Applications

Technological advancements are creating growth opportunities in automotive casting. High-pressure die casting and vacuum processes are increasingly favored for producing high-precision, defect-free parts. The shift to electric vehicles raises demand for aluminum and magnesium housings, improving thermal management and efficiency. Manufacturers are focusing on automation and robotics to achieve greater reliability and faster cycle times. The integration of 3D printing into mold design is further transforming production capabilities, allowing customized components to reach markets quickly.

  • Battery housings alone are expected to account for 12–14% of total aluminum casting output.
  • Robotic integration lowers casting defect rates to below 2%.
  • Investment in digital foundry solutions has grown at 9–10% annually.

Emerging Trend Aluminum Dominance and Digital Casting Methods

Aluminum casting has become central to modern vehicle design as automakers prioritize fuel efficiency and emission compliance. Recycling initiatives are reducing reliance on virgin material, with secondary aluminum contributing over 45% of industry supply. New digital tools, such as AI-based monitoring systems, are being deployed to optimize pouring and cooling cycles. Additive manufacturing continues to expand mold and core-making capabilities, offering greater design freedom and efficiency. These innovations support large-scale production while aligning with environmental and regulatory requirements.

  • Demand for aluminum die-cast parts in EVs has grown by 11–13% annually.
  • Secondary aluminum reduces production costs by up to 20%.
  • AI monitoring shortens defect detection time by 30–35%.

Market Challenge Cost Pressure and Quality Complexity

Automotive casting is capital intensive, requiring advanced machinery and strict quality standards. Complex casting techniques raise manufacturing costs, while raw material volatility in aluminum and magnesium markets creates price instability. Small-scale manufacturers struggle with the expense of adopting automation, limiting competitiveness. Ensuring dimensional accuracy and avoiding porosity remain challenges in large-scale production. Skilled workforce shortages also add to operational hurdles. Maintaining consistent quality and affordability is essential to meet growing demand from automakers.

  • Raw material fluctuations increased casting costs by 12–15% in 2024.
  • Quality rejection rates can reach 5–6% in high-volume production.
  • Labor shortages increased operational expenses by 8–10%.

Analyzing Automotive Casting Market by Top Investment Segments

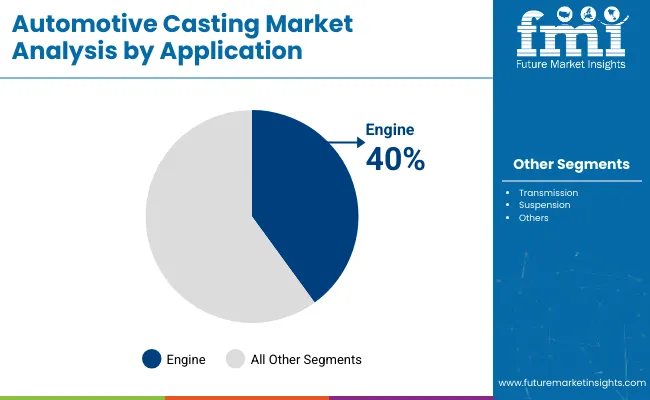
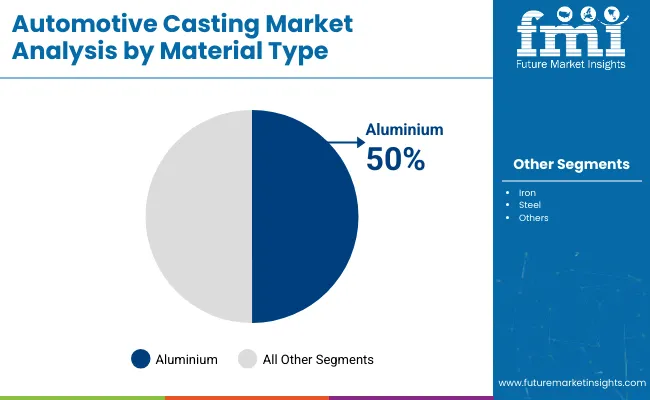
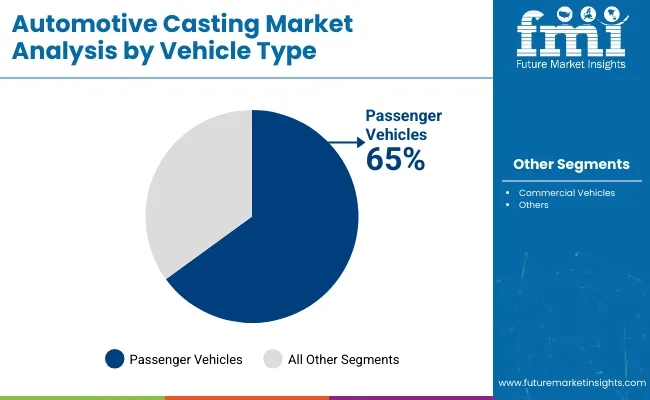
The automotive casting market is shaped by processes, applications, material choices, and vehicle demand. Die casting leads with 45%, supported by precision and high-volume production. Engines remain the largest application at 40%, reflecting their reliance on durable and lightweight castings. Aluminium dominates materials with 50%, valued for weight reduction and efficiency. Passenger vehicles represent 65% of demand, driven by global ownership growth and replacement needs. Together, these segments highlight consistent casting consumption patterns, where process efficiency, material strength, and automotive usage drive long-term component requirements worldwide.
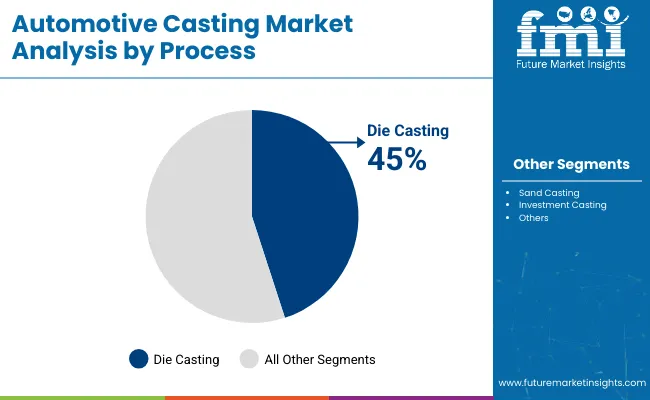
Die Casting Maintains 45% Market Share

Automotive Casting Market By Process

Die casting leads at 45%, supported by its ability to deliver high precision and complex geometries required in automotive parts. It is widely applied in components like engine blocks, housings, and transmission cases. Automakers favor die casting due to its faster cycle times and suitability for large-scale production. The method also supports thinner wall designs, improving weight optimization in vehicles. Leading suppliers invest in automated die casting machinery to enhance efficiency and meet rising demand from OEMs. This keeps die casting the dominant process within the casting segment.
  • Average rejection rate in die casting is below 5%
  • Typical cycle time per unit ranges between 30 and 60 seconds
  • Production runs often exceed 100,000 units annually for OEMs

Engines Dominate Applications with 40% Share

Automotive Casting Market By Application

Engines account for 40% of automotive casting demand, reflecting their reliance on durable, heat-resistant parts. Cast components such as cylinder blocks, heads, and manifolds are integral to engine reliability and performance. Lightweight alloys are increasingly used to reduce overall vehicle weight while maintaining durability. Engine casting replacement demand remains high due to continuous wear and operating stress. Automotive manufacturers prioritize precision casting in engines to achieve fuel efficiency targets and regulatory compliance. This ensures engines remain the most consistent driver of casting requirements across global automotive markets.
  • Cast engine blocks typically last 150,000–200,000 km
  • Cylinder head demand forms nearly 35% of engine casting volume
  • Replacement cycles are shorter in commercial vehicles due to heavy load

Aluminium Leads Material Segment at 50% Share

Automotive Casting Market By Material Type

Aluminium holds 50% of casting demand, favored for its lightweight and corrosion-resistant properties. Its use improves fuel efficiency and reduces emissions while maintaining structural strength in vehicle parts. Aluminium castings are applied in engines, transmission cases, wheels, and structural components. Automakers also prefer aluminium for its recyclability and availability, which reduce lifecycle costs. The material supports complex designs and high-volume production through die casting. Growing electrification in vehicles also supports aluminium demand for battery housing and lightweight structural applications, reinforcing its leadership in casting materials.
  • Aluminium reduces component weight by 30–40% compared to iron
  • Recycling rates exceed 90% in automotive aluminium castings
  • Demand rising in EVs for battery enclosures and motor housings

Passenger Vehicles Hold 65% Market Share

Automotive Casting Market By Vehicle Type

Passenger vehicles represent 65% of automotive casting demand, driven by their global ownership base and frequent replacement cycles. Castings are used in engines, transmission systems, and suspension assemblies, which experience higher wear from daily commuting. Automakers integrate precision-cast parts to meet performance, safety, and durability standards. Passenger car ownership expansion in Asia-Pacific contributes to rising casting consumption. Manufacturers continue to rely on lightweight cast alloys to optimize efficiency without compromising strength. Passenger vehicles remain the central focus for casting suppliers, reflecting their scale and consistent demand globally.
  • Passenger car sales exceeded 70 million units globally in 2024
  • Casting replacement parts form nearly 60% of aftermarket sales
  • Demand rising for aluminium suspension castings in premium vehicles

Top Countries Growing in the Automotive Casting Market

Country Wise Analysis Of Automotive Casting Market

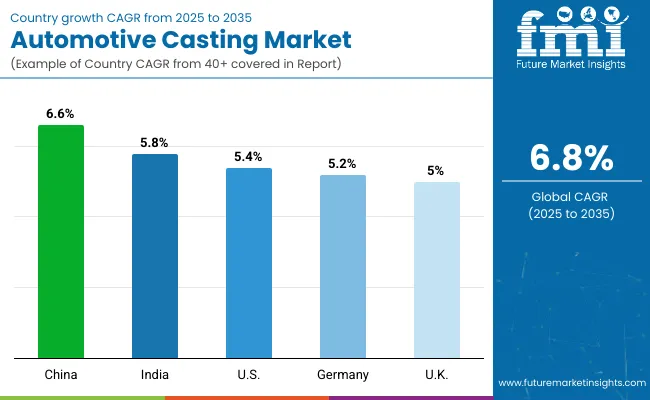
The global market is expected to expand at a CAGR of 6.8% between 2025 and 2035. China records 6.6%, slightly below the global rate at −3%, supported by BRICS-driven automotive manufacturing and lightweight component demand. India follows with 5.8%, showing a −15% difference, influenced by ASEAN-linked industrial collaborations and rising domestic vehicle production.

The United States posts 5.4%, which is −21% under the global benchmark, reflecting steady yet measured adoption in OECD markets. Germany registers 5.2%, or −24% below the global rate, tied to structured integration of advanced casting technologies within its automotive sector. The United Kingdom stands at 5%, lagging −26% compared with the global average, with gradual modernization in production facilities. The trend indicates that while the global market maintains healthy momentum, BRICS economies such as China and India are progressing close to the benchmark, whereas OECD members are advancing at more moderate levels.

Automotive Casting Market Growth Outlook in China

China is registering a CAGR of 6.6% in the automotive casting market, slightly below the global level of 6.8%. Expansion is driven by strong vehicle production capacity and rising electric vehicle demand. Domestic manufacturers are investing in advanced casting facilities with automation and robotics to enhance accuracy and efficiency.

Lightweight castings made from aluminum and magnesium are in demand for use in engines, chassis, and structural components. Rapid scaling in industrial hubs such as Shanghai and Guangzhou supports both domestic and export supply chains. Continuous modernization of foundries is allowing suppliers to keep pace with evolving performance and safety requirements.

  • Aluminum casting demand forecast to grow 18% by 2026 in China
  • Over 40% of EV models using high-strength magnesium castings
  • Automated production lines increasing plant efficiency by 15%

Automotive Casting Market Analysis in India

India is showing a CAGR of 5.8% in the automotive casting market, below the global benchmark of 6.8%. Growth is linked to increased vehicle manufacturing and the gradual modernization of domestic foundries. Passenger car and commercial vehicle segments are boosting demand for both aluminum and steel castings.

Regional hubs such as Pune, Chennai, and Gujarat are leading the expansion, supported by international investments and supply partnerships. Exports of automotive cast components are becoming increasingly important, with India positioning itself as a cost-effective source for global manufacturers. Semi-automated systems are improving production standards and reducing rejection rates across the sector.

  • Aluminum casting production forecast to rise 14% annually in India
  • Export share of cast components projected to expand 20% by 2026
  • Semi-automated processes reducing defect ratios by 12%

Automotive Casting Market Forecast in the United States

The United States is projected to grow at a CAGR of 5.4% in the automotive casting market, lower than the global average of 6.8%. Market growth is influenced by demand for lightweight aluminum and iron castings for passenger and commercial vehicles. Manufacturers are adopting vacuum casting and simulation-based design tools to increase efficiency and reliability.

Rising production of electric and hybrid vehicles is further boosting demand for lightweight structural components. The aftermarket for replacement parts also contributes to consumption, creating consistent demand alongside new vehicle production. Technological improvements and compliance with regulatory standards continue to guide investments in foundries.

  • Aluminum castings projected to grow 16% by 2026 in the US
  • Vacuum casting methods improving production accuracy by 10%
  • Aftermarket casting demand forecast to rise 12% annually

Automotive Casting Industry Growth Outlook in Germany

Germany is recording a CAGR of 5.2% in the automotive casting market, which is below the global rate of 6.8%. The country’s automotive manufacturers emphasize precision and durability, boosting demand for high-quality aluminum and steel castings. Foundries are adopting advanced die casting systems to reduce production defects while maintaining efficiency.

Lightweight castings are playing a vital role in the production of electric vehicles, particularly in structural and safety components. Research and development in alloy design is strengthening product durability and reducing overall component weight. Germany’s steady growth reflects its strong focus on engineering standards and technological innovation.

  • Precision aluminum castings expected to grow 15% by 2026 in Germany
  • High-pressure die casting systems projected to account for 45% of production
  • Alloy research increasing casting strength by 12%

Automotive Casting Market Analysis in the United Kingdom

The United Kingdom is advancing at a CAGR of 5% in the automotive casting market, the lowest compared to the global benchmark of 6.8%. Growth is supported by demand for lightweight castings across both passenger and commercial vehicle categories.

Manufacturers are focusing on aluminum and magnesium alloys to improve efficiency. Export markets remain a strong driver, with UK suppliers serving automotive hubs across Europe. Investments in automation and digital inspection technologies are helping manufacturers reduce costs and improve quality standards. Despite limited domestic production compared with larger countries, adoption of modern casting techniques continues to stabilize market performance.
  • Export demand forecast to increase 10% annually from UK suppliers
  • Automated systems expected to improve casting output by 14%
  • Aluminum alloy usage in UK automotive production projected to rise 12%

Leading Automotive Casting Manufacturers, Suppliers, Distributors

Automotive Casting Market By Company

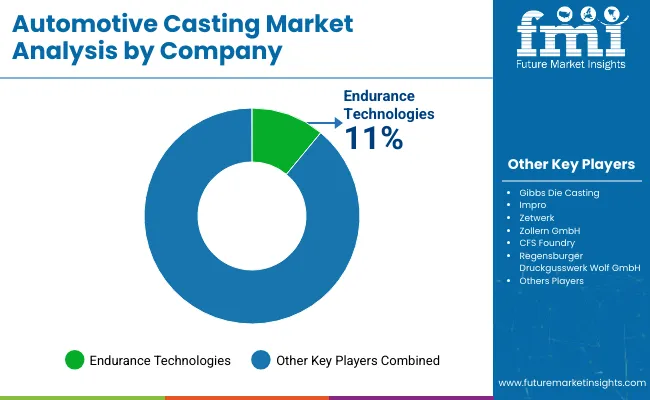
The global market is supported by established manufacturers and emerging suppliers who focus on strengthening their presence through product innovation, research, and partnerships. Gibbs Die Casting continues to expand its portfolio with lightweight aluminum castings designed for engine and transmission components, while RegensburgerDruckgusswerk Wolf GmbH emphasizes precision casting for European automotive brands. CFS Foundry invests in advanced casting processes and material research to provide high-performance parts that meet automaker requirements.

Endurance Technologies has broadened its casting operations across Asia with new facilities, enabling it to serve both domestic and international vehicle manufacturers. Impro focuses on high-quality iron and steel casting solutions and has been diversifying its product lines to serve multiple automotive applications.

Zetwerk and Zollern GmbH are also actively contributing to the industry’s growth through focused strategies. Zetwerk supports global automakers with supply chain integration and contract manufacturing, enabling timely delivery of customized castings. Zollern GmbH concentrates on high-precision casting techniques for complex automotive parts, particularly in drivetrain and engine applications.

These companies are reinforcing their market positions by introducing new casting methods, investing in research, and expanding their distribution networks. Through a combination of regional expansion and product-focused strategies, they continue to meet the evolving requirements of the automotive casting industry.

Recent Industry News In December 2024, Wu Xiaofei, General Manager of Dongfeng Electronic Technology, announced that the company’s technology can reduce overall vehicle weight by streamlining stamping and welding processes while strengthening body rigidity. He noted that this approach extends vehicle lifespan and improves the safety of new energy vehicles. Wu made the statement during the signing and groundbreaking ceremony of the Dongfeng Integrated Die-Casting Industrialization Project in the Wuhan Economic and Technological Development Zone on November 22.

Leading Players

  • Gibbs Die Casting
  • RegensburgerDruckgusswerk Wolf GmbH
  • CFS Foundry
  • Endurance Technologies
  • Zetwerk
  • Zollern GmbH
  • Others

Report Scope

Report Attributes Details
Market Size (2025) USD 6 billion
Projected Market Size (2035) USD 11.6 billion
CAGR (2025 to 2035) 6.8%
Base Year for Estimation 2024
Historical Period 2020 to 2024
Projections Period 2025 to 2035
Quantitative Units USD billion for value
Processes Analyzed (Segment 1) Die Casting, Sand Casting, Investment Casting
Applications Analyzed (Segment 2) Transmission, Engine, Suspension
Material Types Analyzed (Segment 3) Steel, Iron, Aluminium
Vehicle Types Analyzed (Segment 4) Commercial Vehicles, Passenger Vehicles
Regions Covered North America; Europe; South America; Asia Pacific; Middle East & Africa
Countries Covered United States, Canada, Germany, United Kingdom, France, Italy, Brazil, Mexico, China, Japan, India, South Korea, UAE, South Africa
Key Players Influencing the Market Gibbs Die Casting, Regensburger Druckgusswerk Wolf GmbH, CFS Foundry, Endurance Technologies, Impro, Zetwerk, Zollern GmbH, Others
Additional Attributes Dollar sales by casting type and vehicle component, demand dynamics across passenger, commercial, and electric vehicles, regional adoption trends, innovation in lightweight alloys and precision methods, recyclability impact, emerging adoption in EV components

Key Segments

By Process:

  • Die Casting
  • Sand Casting
  • Investment Casting

By Application:

  • Transmission
  • Engine
  • Suspension

By Material Type:

  • Steel
  • Iron
  • Aluminium

By Vehicle Type:

  • Commercial Vehicles
  • Passenger Vehicles

By Region:

  • North America
  • Europe
  • South America
  • Asia Pacific
  • Middle East and Africa

Table of Content

  1. Executive Summary
    • Global Market Outlook
    • Demand-side Trends
    • Supply-side Trends
    • Technology Roadmap Analysis
    • Analysis and Recommendations
  2. Market Overview
    • Market Coverage / Taxonomy
    • Market Definition / Scope / Limitations
  3. Market Background
    • Market Dynamics
      • Drivers
      • Restraints
      • Opportunity
      • Trends
    • Scenario Forecast
      • Demand in Optimistic Scenario
      • Demand in Likely Scenario
      • Demand in Conservative Scenario
    • Opportunity Map Analysis
    • Product Life Cycle Analysis
    • Supply Chain Analysis
      • Supply Side Participants and their Roles
        • Producers
        • Mid-Level Participants (Traders/ Agents/ Brokers)
        • Wholesalers and Distributors
      • Value Added and Value Created at Node in the Supply Chain
      • List of Raw Material Suppliers
      • List of Existing and Potential Buyer’s
    • Investment Feasibility Matrix
    • Value Chain Analysis
      • Profit Margin Analysis
      • Wholesalers and Distributors
      • Retailers
    • PESTLE and Porter’s Analysis
    • Regulatory Landscape
      • By Key Regions
      • By Key Countries
    • Regional Parent Market Outlook
    • Production and Consumption Statistics
    • Import and Export Statistics
  4. Global Market Analysis 2020-2024 and Forecast, 2025-2035
    • Historical Market Size Value (USD Billion) & Volume (Units) Analysis, 2020-2024
    • Current and Future Market Size Value (USD Billion) & Volume (Units) Projections, 2025-2035
      • Y-o-Y Growth Trend Analysis
      • Absolute $ Opportunity Analysis
  5. Global Market Pricing Analysis 2020-2024 and Forecast 2025-2035
  6. Global Market Analysis 2020-2024 and Forecast 2025-2035, By Process
    • Introduction / Key Findings
    • Historical Market Size Value (USD Billion) & Volume (Units) Analysis By Process, 2020-2024
    • Current and Future Market Size Value (USD Billion) & Volume (Units) Analysis and Forecast By Process, 2025-2035
      • Die Casting
      • Sand Casting
      • Investment Casting
    • Y-o-Y Growth Trend Analysis By Process, 2020-2024
    • Absolute $ Opportunity Analysis By Process, 2025-2035
  7. Global Market Analysis 2020-2024 and Forecast 2025-2035, By Application
    • Introduction / Key Findings
    • Historical Market Size Value (USD Billion) & Volume (Units) Analysis By Application, 2020-2024
    • Current and Future Market Size Value (USD Billion) & Volume (Units) Analysis and Forecast By Application, 2025-2035
      • Engine
      • Transmission
      • Suspension
    • Y-o-Y Growth Trend Analysis By Application, 2020-2024
    • Absolute $ Opportunity Analysis By Application, 2025-2035
  8. Global Market Analysis 2020-2024 and Forecast 2025-2035, By Material Type
    • Introduction / Key Findings
    • Historical Market Size Value (USD Billion) & Volume (Units) Analysis By Material Type, 2020-2024
    • Current and Future Market Size Value (USD Billion) & Volume (Units) Analysis and Forecast By Material Type, 2025-2035
      • Aluminium
      • Steel
      • Iron
    • Y-o-Y Growth Trend Analysis By Material Type, 2020-2024
    • Absolute $ Opportunity Analysis By Material Type, 2025-2035
  9. Global Market Analysis 2020-2024 and Forecast 2025-2035, By Vehicle Type
    • Introduction / Key Findings
    • Historical Market Size Value (USD Billion) & Volume (Units) Analysis By Vehicle Type, 2020-2024
    • Current and Future Market Size Value (USD Billion) & Volume (Units) Analysis and Forecast By Vehicle Type, 2025-2035
      • Passenger Vehicles
      • Commercial Vehicles
    • Y-o-Y Growth Trend Analysis By Vehicle Type, 2020-2024
    • Absolute $ Opportunity Analysis By Vehicle Type, 2025-2035
  10. Global Market Analysis 2020-2024 and Forecast 2025-2035, By Region
    • Introduction
    • Historical Market Size Value (USD Billion) & Volume (Units) Analysis By Region, 2020-2024
    • Current Market Size Value (USD Billion) & Volume (Units) Analysis and Forecast By Region, 2025-2035
      • North America
      • Latin America
      • Western Europe
      • Eastern Europe
      • East Asia
      • South Asia & Pacific
      • Middle East and Africa
    • Market Attractiveness Analysis By Region
  11. North America Market Analysis 2020-2024 and Forecast 2025-2035, By Country
    • Historical Market Size Value (USD Billion) & Volume (Units) Trend Analysis By Market Taxonomy, 2020-2024
    • Market Size Value (USD Billion) & Volume (Units) Forecast By Market Taxonomy, 2025-2035
      • By Country
        • U.S.
        • Canada
        • Mexico
      • By Process
      • By Application
      • By Material Type
      • By Vehicle Type
    • Market Attractiveness Analysis
      • By Country
      • By Process
      • By Application
      • By Material Type
      • By Vehicle Type
    • Key Takeaways
  12. Latin America Market Analysis 2020-2024 and Forecast 2025-2035, By Country
    • Historical Market Size Value (USD Billion) & Volume (Units) Trend Analysis By Market Taxonomy, 2020-2024
    • Market Size Value (USD Billion) & Volume (Units) Forecast By Market Taxonomy, 2025-2035
      • By Country
        • Brazil
        • Argentina
        • Rest of LATAM
      • By Process
      • By Application
      • By Material Type
      • By Vehicle Type
    • Market Attractiveness Analysis
      • By Country
      • By Process
      • By Application
      • By Material Type
      • By Vehicle Type
    • Key Takeaways
  13. Western Europe Market Analysis 2020-2024 and Forecast 2025-2035, By Country
    • Historical Market Size Value (USD Billion) & Volume (Units) Trend Analysis By Market Taxonomy, 2020-2024
    • Market Size Value (USD Billion) & Volume (Units) Forecast By Market Taxonomy, 2025-2035
      • By Country
        • Germany
        • Italy
        • France
        • UK
        • Spain
        • BENELUX
        • Nordic
        • Rest of W.Europe
      • By Process
      • By Application
      • By Material Type
      • By Vehicle Type
    • Market Attractiveness Analysis
      • By Country
      • By Process
      • By Application
      • By Material Type
      • By Vehicle Type
    • Key Takeaways
  14. Eastern Europe Market Analysis 2020-2024 and Forecast 2025-2035, By Country
    • Historical Market Size Value (USD Billion) & Volume (Units) Trend Analysis By Market Taxonomy, 2020-2024
    • Market Size Value (USD Billion) & Volume (Units) Forecast By Market Taxonomy, 2025-2035
      • By Country
        • Russia
        • Hungary
        • Poland
        • Balkan & Baltics
        • Rest of E. Europe
      • By Process
      • By Application
      • By Material Type
      • By Vehicle Type
    • Market Attractiveness Analysis
      • By Country
      • By Process
      • By Application
      • By Material Type
      • By Vehicle Type
    • Key Takeaways
  15. East Asia Market Analysis 2020-2024 and Forecast 2025-2035, By Country
    • Historical Market Size Value (USD Billion) & Volume (Units) Trend Analysis By Market Taxonomy, 2020-2024
    • Market Size Value (USD Billion) & Volume (Units) Forecast By Market Taxonomy, 2025-2035
      • By Country
        • China
        • Japan
        • South Korea
      • By Process
      • By Application
      • By Material Type
      • By Vehicle Type
    • Market Attractiveness Analysis
      • By Country
      • By Process
      • By Application
      • By Material Type
      • By Vehicle Type
    • Key Takeaways
  16. South Asia & Pacific Market Analysis 2020-2024 and Forecast 2025-2035, By Country
    • Historical Market Size Value (USD Billion) & Volume (Units) Trend Analysis By Market Taxonomy, 2020-2024
    • Market Size Value (USD Billion) & Volume (Units) Forecast By Market Taxonomy, 2025-2035
      • By Country
        • India
        • Australia & New Zealand
        • ASEAN
        • Rest of SAP
      • By Process
      • By Application
      • By Material Type
      • By Vehicle Type
    • Market Attractiveness Analysis
      • By Country
      • By Process
      • By Application
      • By Material Type
      • By Vehicle Type
    • Key Takeaways
  17. Middle East and Africa Market Analysis 2020-2024 and Forecast 2025-2035, By Country
    • Historical Market Size Value (USD Billion) & Volume (Units) Trend Analysis By Market Taxonomy, 2020-2024
    • Market Size Value (USD Billion) & Volume (Units) Forecast By Market Taxonomy, 2025-2035
      • By Country
        • GCC Countries
        • Northern Africa
        • South Africa
        • Turkiye
        • Rest of MEA
      • By Process
      • By Application
      • By Material Type
      • By Vehicle Type
    • Market Attractiveness Analysis
      • By Country
      • By Process
      • By Application
      • By Material Type
      • By Vehicle Type
    • Key Takeaways
  18. Key Countries Market Analysis
    • U.S.
      • Pricing Analysis
      • Market Share Analysis, 2024
        • By Process
        • By Application
        • By Material Type
        • By Vehicle Type
    • Canada
      • Pricing Analysis
      • Market Share Analysis, 2024
        • By Process
        • By Application
        • By Material Type
        • By Vehicle Type
    • Brazil
      • Pricing Analysis
      • Market Share Analysis, 2024
        • By Process
        • By Application
        • By Material Type
        • By Vehicle Type
    • Mexico
      • Pricing Analysis
      • Market Share Analysis, 2024
        • By Process
        • By Application
        • By Material Type
        • By Vehicle Type
    • Argentina
      • Pricing Analysis
      • Market Share Analysis, 2024
        • By Process
        • By Application
        • By Material Type
        • By Vehicle Type
  19. Market Structure Analysis
    • Competition Dashboard
    • Competition Benchmarking
    • Market Share Analysis of Top Players
      • By Regional
      • By Process
      • By Application
      • By Material Type
      • By Vehicle Type
  20. Competition Analysis
    • Competition Deep Dive
      • Endurance Technologies
        • Overview
        • Product Portfolio
        • Profitability by Market Segments (Product/Age /Sales Channel/Region)
        • Sales Footprint
        • Strategy Overview
          • Marketing Strategy
          • Product Strategy
          • Channel Strategy
      • Regensburger Druckgusswerk Wolf GmbH
        • Overview
        • Product Portfolio
        • Profitability by Market Segments (Product/Age /Sales Channel/Region)
        • Sales Footprint
        • Strategy Overview
          • Marketing Strategy
          • Product Strategy
          • Channel Strategy
      • Gibbs Die Casting
        • Overview
        • Product Portfolio
        • Profitability by Market Segments (Product/Age /Sales Channel/Region)
        • Sales Footprint
        • Strategy Overview
          • Marketing Strategy
          • Product Strategy
          • Channel Strategy
      • Impro
        • Overview
        • Product Portfolio
        • Profitability by Market Segments (Product/Age /Sales Channel/Region)
        • Sales Footprint
        • Strategy Overview
          • Marketing Strategy
          • Product Strategy
          • Channel Strategy
      • Zetwerk
        • Overview
        • Product Portfolio
        • Profitability by Market Segments (Product/Age /Sales Channel/Region)
        • Sales Footprint
        • Strategy Overview
          • Marketing Strategy
          • Product Strategy
          • Channel Strategy
      • Zollern GmbH
        • Overview
        • Product Portfolio
        • Profitability by Market Segments (Product/Age /Sales Channel/Region)
        • Sales Footprint
        • Strategy Overview
          • Marketing Strategy
          • Product Strategy
          • Channel Strategy
      • CFS Foundry
        • Overview
        • Product Portfolio
        • Profitability by Market Segments (Product/Age /Sales Channel/Region)
        • Sales Footprint
        • Strategy Overview
          • Marketing Strategy
          • Product Strategy
          • Channel Strategy
  21. Assumptions & Acronyms Used
  22. Research Methodology

List of Tables

  • Table 1: Global Market Value (USD Billion) Forecast by Region, 2020-2035
  • Table 2: Global Market Volume (Units) Forecast by Region, 2020-2035
  • Table 3: Global Market Value (USD Billion) Forecast by Process, 2020-2035
  • Table 4: Global Market Volume (Units) Forecast by Process, 2020-2035
  • Table 5: Global Market Value (USD Billion) Forecast by Application, 2020-2035
  • Table 6: Global Market Volume (Units) Forecast by Application, 2020-2035
  • Table 7: Global Market Value (USD Billion) Forecast by Material Type, 2020-2035
  • Table 8: Global Market Volume (Units) Forecast by Material Type, 2020-2035
  • Table 9: Global Market Value (USD Billion) Forecast by Vehicle Type, 2020-2035
  • Table 10: Global Market Volume (Units) Forecast by Vehicle Type, 2020-2035
  • Table 11: North America Market Value (USD Billion) Forecast by Country, 2020-2035
  • Table 12: North America Market Volume (Units) Forecast by Country, 2020-2035
  • Table 13: North America Market Value (USD Billion) Forecast by Process, 2020-2035
  • Table 14: North America Market Volume (Units) Forecast by Process, 2020-2035
  • Table 15: North America Market Value (USD Billion) Forecast by Application, 2020-2035
  • Table 16: North America Market Volume (Units) Forecast by Application, 2020-2035
  • Table 17: North America Market Value (USD Billion) Forecast by Material Type, 2020-2035
  • Table 18: North America Market Volume (Units) Forecast by Material Type, 2020-2035
  • Table 19: North America Market Value (USD Billion) Forecast by Vehicle Type, 2020-2035
  • Table 20: North America Market Volume (Units) Forecast by Vehicle Type, 2020-2035
  • Table 21: Latin America Market Value (USD Billion) Forecast by Country, 2020-2035
  • Table 22: Latin America Market Volume (Units) Forecast by Country, 2020-2035
  • Table 23: Latin America Market Value (USD Billion) Forecast by Process, 2020-2035
  • Table 24: Latin America Market Volume (Units) Forecast by Process, 2020-2035
  • Table 25: Latin America Market Value (USD Billion) Forecast by Application, 2020-2035
  • Table 26: Latin America Market Volume (Units) Forecast by Application, 2020-2035
  • Table 27: Latin America Market Value (USD Billion) Forecast by Material Type, 2020-2035
  • Table 28: Latin America Market Volume (Units) Forecast by Material Type, 2020-2035
  • Table 29: Latin America Market Value (USD Billion) Forecast by Vehicle Type, 2020-2035
  • Table 30: Latin America Market Volume (Units) Forecast by Vehicle Type, 2020-2035
  • Table 31: Western Europe Market Value (USD Billion) Forecast by Country, 2020-2035
  • Table 32: Western Europe Market Volume (Units) Forecast by Country, 2020-2035
  • Table 33: Western Europe Market Value (USD Billion) Forecast by Process, 2020-2035
  • Table 34: Western Europe Market Volume (Units) Forecast by Process, 2020-2035
  • Table 35: Western Europe Market Value (USD Billion) Forecast by Application, 2020-2035
  • Table 36: Western Europe Market Volume (Units) Forecast by Application, 2020-2035
  • Table 37: Western Europe Market Value (USD Billion) Forecast by Material Type, 2020-2035
  • Table 38: Western Europe Market Volume (Units) Forecast by Material Type, 2020-2035
  • Table 39: Western Europe Market Value (USD Billion) Forecast by Vehicle Type, 2020-2035
  • Table 40: Western Europe Market Volume (Units) Forecast by Vehicle Type, 2020-2035
  • Table 41: Eastern Europe Market Value (USD Billion) Forecast by Country, 2020-2035
  • Table 42: Eastern Europe Market Volume (Units) Forecast by Country, 2020-2035
  • Table 43: Eastern Europe Market Value (USD Billion) Forecast by Process, 2020-2035
  • Table 44: Eastern Europe Market Volume (Units) Forecast by Process, 2020-2035
  • Table 45: Eastern Europe Market Value (USD Billion) Forecast by Application, 2020-2035
  • Table 46: Eastern Europe Market Volume (Units) Forecast by Application, 2020-2035
  • Table 47: Eastern Europe Market Value (USD Billion) Forecast by Material Type, 2020-2035
  • Table 48: Eastern Europe Market Volume (Units) Forecast by Material Type, 2020-2035
  • Table 49: Eastern Europe Market Value (USD Billion) Forecast by Vehicle Type, 2020-2035
  • Table 50: Eastern Europe Market Volume (Units) Forecast by Vehicle Type, 2020-2035
  • Table 51: East Asia Market Value (USD Billion) Forecast by Country, 2020-2035
  • Table 52: East Asia Market Volume (Units) Forecast by Country, 2020-2035
  • Table 53: East Asia Market Value (USD Billion) Forecast by Process, 2020-2035
  • Table 54: East Asia Market Volume (Units) Forecast by Process, 2020-2035
  • Table 55: East Asia Market Value (USD Billion) Forecast by Application, 2020-2035
  • Table 56: East Asia Market Volume (Units) Forecast by Application, 2020-2035
  • Table 57: East Asia Market Value (USD Billion) Forecast by Material Type, 2020-2035
  • Table 58: East Asia Market Volume (Units) Forecast by Material Type, 2020-2035
  • Table 59: East Asia Market Value (USD Billion) Forecast by Vehicle Type, 2020-2035
  • Table 60: East Asia Market Volume (Units) Forecast by Vehicle Type, 2020-2035
  • Table 61: South Asia & Pacific Market Value (USD Billion) Forecast by Country, 2020-2035
  • Table 62: South Asia & Pacific Market Volume (Units) Forecast by Country, 2020-2035
  • Table 63: South Asia & Pacific Market Value (USD Billion) Forecast by Process, 2020-2035
  • Table 64: South Asia & Pacific Market Volume (Units) Forecast by Process, 2020-2035
  • Table 65: South Asia & Pacific Market Value (USD Billion) Forecast by Application, 2020-2035
  • Table 66: South Asia & Pacific Market Volume (Units) Forecast by Application, 2020-2035
  • Table 67: South Asia & Pacific Market Value (USD Billion) Forecast by Material Type, 2020-2035
  • Table 68: South Asia & Pacific Market Volume (Units) Forecast by Material Type, 2020-2035
  • Table 69: South Asia & Pacific Market Value (USD Billion) Forecast by Vehicle Type, 2020-2035
  • Table 70: South Asia & Pacific Market Volume (Units) Forecast by Vehicle Type, 2020-2035
  • Table 71: Middle East and Africa Market Value (USD Billion) Forecast by Country, 2020-2035
  • Table 72: Middle East and Africa Market Volume (Units) Forecast by Country, 2020-2035
  • Table 73: Middle East and Africa Market Value (USD Billion) Forecast by Process, 2020-2035
  • Table 74: Middle East and Africa Market Volume (Units) Forecast by Process, 2020-2035
  • Table 75: Middle East and Africa Market Value (USD Billion) Forecast by Application, 2020-2035
  • Table 76: Middle East and Africa Market Volume (Units) Forecast by Application, 2020-2035
  • Table 77: Middle East and Africa Market Value (USD Billion) Forecast by Material Type, 2020-2035
  • Table 78: Middle East and Africa Market Volume (Units) Forecast by Material Type, 2020-2035
  • Table 79: Middle East and Africa Market Value (USD Billion) Forecast by Vehicle Type, 2020-2035
  • Table 80: Middle East and Africa Market Volume (Units) Forecast by Vehicle Type, 2020-2035

List of Figures

  • Figure 1: Global Market Volume (Units) Forecast 2020-2035
  • Figure 2: Global Market Pricing Analysis
  • Figure 3: Global Market Value (US$ Bn) Forecast 2020-2035
  • Figure 4: Global Market Value Share and BPS Analysis by Process, 2025 and 2035
  • Figure 5: Global Market Y-o-Y Growth Comparison by Process, 2025-2035
  • Figure 6: Global Market Attractiveness Analysis by Process
  • Figure 7: Global Market Value Share and BPS Analysis by Application, 2025 and 2035
  • Figure 8: Global Market Y-o-Y Growth Comparison by Application, 2025-2035
  • Figure 9: Global Market Attractiveness Analysis by Application
  • Figure 10: Global Market Value Share and BPS Analysis by Material Type, 2025 and 2035
  • Figure 11: Global Market Y-o-Y Growth Comparison by Material Type, 2025-2035
  • Figure 12: Global Market Attractiveness Analysis by Material Type
  • Figure 13: Global Market Value Share and BPS Analysis by Vehicle Type, 2025 and 2035
  • Figure 14: Global Market Y-o-Y Growth Comparison by Vehicle Type, 2025-2035
  • Figure 15: Global Market Attractiveness Analysis by Vehicle Type
  • Figure 16: Global Market Value (US$ Bn) Share and BPS Analysis by Region, 2025 and 2035
  • Figure 17: Global Market Y-o-Y Growth Comparison by Region, 2025-2035
  • Figure 18: Global Market Attractiveness Analysis by Region
  • Figure 19: North America Market Incremental $ Opportunity, 2025-2035
  • Figure 20: Latin America Market Incremental $ Opportunity, 2025-2035
  • Figure 21: Western Europe Market Incremental $ Opportunity, 2025-2035
  • Figure 22: Eastern Europe Market Incremental $ Opportunity, 2025-2035
  • Figure 23: East Asia Market Incremental $ Opportunity, 2025-2035
  • Figure 24: South Asia & Pacific Market Incremental $ Opportunity, 2025-2035
  • Figure 25: Middle East and Africa Market Incremental $ Opportunity, 2025-2035
  • Figure 26: North America Market Value Share and BPS Analysis by Country, 2025 and 2035
  • Figure 27: North America Market Value Share and BPS Analysis by Process, 2025 and 2035
  • Figure 28: North America Market Y-o-Y Growth Comparison by Process, 2025-2035
  • Figure 29: North America Market Attractiveness Analysis by Process
  • Figure 30: North America Market Value Share and BPS Analysis by Application, 2025 and 2035
  • Figure 31: North America Market Y-o-Y Growth Comparison by Application, 2025-2035
  • Figure 32: North America Market Attractiveness Analysis by Application
  • Figure 33: North America Market Value Share and BPS Analysis by Material Type, 2025 and 2035
  • Figure 34: North America Market Y-o-Y Growth Comparison by Material Type, 2025-2035
  • Figure 35: North America Market Attractiveness Analysis by Material Type
  • Figure 36: North America Market Value Share and BPS Analysis by Vehicle Type, 2025 and 2035
  • Figure 37: North America Market Y-o-Y Growth Comparison by Vehicle Type, 2025-2035
  • Figure 38: North America Market Attractiveness Analysis by Vehicle Type
  • Figure 39: Latin America Market Value Share and BPS Analysis by Country, 2025 and 2035
  • Figure 40: Latin America Market Value Share and BPS Analysis by Process, 2025 and 2035
  • Figure 41: Latin America Market Y-o-Y Growth Comparison by Process, 2025-2035
  • Figure 42: Latin America Market Attractiveness Analysis by Process
  • Figure 43: Latin America Market Value Share and BPS Analysis by Application, 2025 and 2035
  • Figure 44: Latin America Market Y-o-Y Growth Comparison by Application, 2025-2035
  • Figure 45: Latin America Market Attractiveness Analysis by Application
  • Figure 46: Latin America Market Value Share and BPS Analysis by Material Type, 2025 and 2035
  • Figure 47: Latin America Market Y-o-Y Growth Comparison by Material Type, 2025-2035
  • Figure 48: Latin America Market Attractiveness Analysis by Material Type
  • Figure 49: Latin America Market Value Share and BPS Analysis by Vehicle Type, 2025 and 2035
  • Figure 50: Latin America Market Y-o-Y Growth Comparison by Vehicle Type, 2025-2035
  • Figure 51: Latin America Market Attractiveness Analysis by Vehicle Type
  • Figure 52: Western Europe Market Value Share and BPS Analysis by Country, 2025 and 2035
  • Figure 53: Western Europe Market Value Share and BPS Analysis by Process, 2025 and 2035
  • Figure 54: Western Europe Market Y-o-Y Growth Comparison by Process, 2025-2035
  • Figure 55: Western Europe Market Attractiveness Analysis by Process
  • Figure 56: Western Europe Market Value Share and BPS Analysis by Application, 2025 and 2035
  • Figure 57: Western Europe Market Y-o-Y Growth Comparison by Application, 2025-2035
  • Figure 58: Western Europe Market Attractiveness Analysis by Application
  • Figure 59: Western Europe Market Value Share and BPS Analysis by Material Type, 2025 and 2035
  • Figure 60: Western Europe Market Y-o-Y Growth Comparison by Material Type, 2025-2035
  • Figure 61: Western Europe Market Attractiveness Analysis by Material Type
  • Figure 62: Western Europe Market Value Share and BPS Analysis by Vehicle Type, 2025 and 2035
  • Figure 63: Western Europe Market Y-o-Y Growth Comparison by Vehicle Type, 2025-2035
  • Figure 64: Western Europe Market Attractiveness Analysis by Vehicle Type
  • Figure 65: Eastern Europe Market Value Share and BPS Analysis by Country, 2025 and 2035
  • Figure 66: Eastern Europe Market Value Share and BPS Analysis by Process, 2025 and 2035
  • Figure 67: Eastern Europe Market Y-o-Y Growth Comparison by Process, 2025-2035
  • Figure 68: Eastern Europe Market Attractiveness Analysis by Process
  • Figure 69: Eastern Europe Market Value Share and BPS Analysis by Application, 2025 and 2035
  • Figure 70: Eastern Europe Market Y-o-Y Growth Comparison by Application, 2025-2035
  • Figure 71: Eastern Europe Market Attractiveness Analysis by Application
  • Figure 72: Eastern Europe Market Value Share and BPS Analysis by Material Type, 2025 and 2035
  • Figure 73: Eastern Europe Market Y-o-Y Growth Comparison by Material Type, 2025-2035
  • Figure 74: Eastern Europe Market Attractiveness Analysis by Material Type
  • Figure 75: Eastern Europe Market Value Share and BPS Analysis by Vehicle Type, 2025 and 2035
  • Figure 76: Eastern Europe Market Y-o-Y Growth Comparison by Vehicle Type, 2025-2035
  • Figure 77: Eastern Europe Market Attractiveness Analysis by Vehicle Type
  • Figure 78: East Asia Market Value Share and BPS Analysis by Country, 2025 and 2035
  • Figure 79: East Asia Market Value Share and BPS Analysis by Process, 2025 and 2035
  • Figure 80: East Asia Market Y-o-Y Growth Comparison by Process, 2025-2035
  • Figure 81: East Asia Market Attractiveness Analysis by Process
  • Figure 82: East Asia Market Value Share and BPS Analysis by Application, 2025 and 2035
  • Figure 83: East Asia Market Y-o-Y Growth Comparison by Application, 2025-2035
  • Figure 84: East Asia Market Attractiveness Analysis by Application
  • Figure 85: East Asia Market Value Share and BPS Analysis by Material Type, 2025 and 2035
  • Figure 86: East Asia Market Y-o-Y Growth Comparison by Material Type, 2025-2035
  • Figure 87: East Asia Market Attractiveness Analysis by Material Type
  • Figure 88: East Asia Market Value Share and BPS Analysis by Vehicle Type, 2025 and 2035
  • Figure 89: East Asia Market Y-o-Y Growth Comparison by Vehicle Type, 2025-2035
  • Figure 90: East Asia Market Attractiveness Analysis by Vehicle Type
  • Figure 91: South Asia & Pacific Market Value Share and BPS Analysis by Country, 2025 and 2035
  • Figure 92: South Asia & Pacific Market Value Share and BPS Analysis by Process, 2025 and 2035
  • Figure 93: South Asia & Pacific Market Y-o-Y Growth Comparison by Process, 2025-2035
  • Figure 94: South Asia & Pacific Market Attractiveness Analysis by Process
  • Figure 95: South Asia & Pacific Market Value Share and BPS Analysis by Application, 2025 and 2035
  • Figure 96: South Asia & Pacific Market Y-o-Y Growth Comparison by Application, 2025-2035
  • Figure 97: South Asia & Pacific Market Attractiveness Analysis by Application
  • Figure 98: South Asia & Pacific Market Value Share and BPS Analysis by Material Type, 2025 and 2035
  • Figure 99: South Asia & Pacific Market Y-o-Y Growth Comparison by Material Type, 2025-2035
  • Figure 100: South Asia & Pacific Market Attractiveness Analysis by Material Type
  • Figure 101: South Asia & Pacific Market Value Share and BPS Analysis by Vehicle Type, 2025 and 2035
  • Figure 102: South Asia & Pacific Market Y-o-Y Growth Comparison by Vehicle Type, 2025-2035
  • Figure 103: South Asia & Pacific Market Attractiveness Analysis by Vehicle Type
  • Figure 104: Middle East and Africa Market Value Share and BPS Analysis by Country, 2025 and 2035
  • Figure 105: Middle East and Africa Market Value Share and BPS Analysis by Process, 2025 and 2035
  • Figure 106: Middle East and Africa Market Y-o-Y Growth Comparison by Process, 2025-2035
  • Figure 107: Middle East and Africa Market Attractiveness Analysis by Process
  • Figure 108: Middle East and Africa Market Value Share and BPS Analysis by Application, 2025 and 2035
  • Figure 109: Middle East and Africa Market Y-o-Y Growth Comparison by Application, 2025-2035
  • Figure 110: Middle East and Africa Market Attractiveness Analysis by Application
  • Figure 111: Middle East and Africa Market Value Share and BPS Analysis by Material Type, 2025 and 2035
  • Figure 112: Middle East and Africa Market Y-o-Y Growth Comparison by Material Type, 2025-2035
  • Figure 113: Middle East and Africa Market Attractiveness Analysis by Material Type
  • Figure 114: Middle East and Africa Market Value Share and BPS Analysis by Vehicle Type, 2025 and 2035
  • Figure 115: Middle East and Africa Market Y-o-Y Growth Comparison by Vehicle Type, 2025-2035
  • Figure 116: Middle East and Africa Market Attractiveness Analysis by Vehicle Type
  • Figure 117: Global Market - Tier Structure Analysis
  • Figure 118: Global Market - Company Share Analysis

Frequently Asked Questions

What is the projected automotive casting market size by 2035?

The market is expected to reach nearly USD 11.6 billion by 2035.

What is the CAGR of the automotive casting market from 2025 to 2035?

The market is growing at a CAGR of 6.8% during this period.

Which casting process holds the largest market share in 2025?

Die Casting leads with 45% market share in 2025.

What percentage of the automotive casting industry is captured by aluminium material type in 2025?

Aluminium captures 50% of the market by share.

Which company holds the largest market share among automotive casting industry players?

Endurance Technologies holds a leading 11% industry share.

Explore Similar Insights

Future Market Insights

Automotive Casting Market