Reports

- Global Locations -

Headquarters

Future Market Insights, Inc.

Christiana Corporate, 200
Continental Drive, Suite 401,
Newark, Delaware - 19713,
United States

T: +1-845-579-5705

Americas

Future Market Insights, Inc.

616 Corporate Way, Suite 2-9018,
Valley Cottage, NY 10989, United States

T: +1-347-918-3531

MEA

Future Market Insights

1602-6 Jumeirah Bay X2 Tower, Plot No: JLT-PH2-X2A,
Jumeirah Lakes Towers, Dubai,
United Arab Emirates

Europe

Future Market Insights

3rd Floor, 207 Regent Street,
W1B 3HH London
United Kingdom

T: + 44 (0) 20 8123 9659
D: +44 (0) 20 3287 4268

Asia Pacific

Future Market Insights

IndiaLand Global Tech Park, Unit UG-1, Behind Grand HighStreet, Phase 1, Hinjawadi, MH, Pune – 411057, India

Gaming Gadgets Market Outlook (2022-2032)

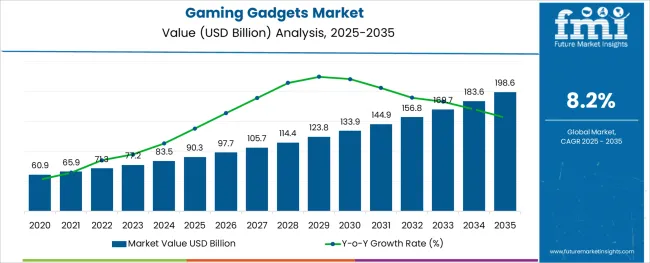
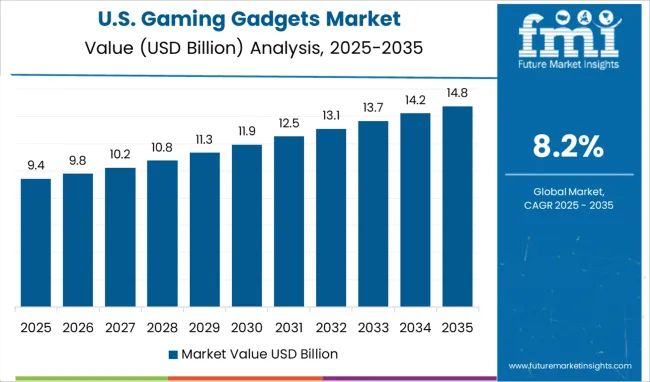
[333 Pages Report] The gaming gadgets industry is predicted to be worth US$ 71,305.3 Million by 2022 and US$ 156,774.9 Million by 2032, according to FMI. Between 2022 and 2032, the market is estimated to increase at a compound yearly growth rate of 8.2%. During the assessment period, Wii gadgets are predicted to rise at a faster-than-average CAGR of 10.8%.

The market is anticipated to grow at a stellar pace owing to the following factors:

  • The advent of next-generation home consoles may promote the expansion of the gaming gadgets industry. Gaming consoles with next-generation accessories are being released by the biggest gaming providers. The remote, headset, controllers, and media remote are among the peripherals having next-generation functionality. These accessories have the potential to attract a big number of end-users to the market.
  • The introduction of accessories may greatly enhance the supply rate of gaming gadgets on the market. In the approaching years, there may be new game material with a high graphic feature. Complex gear is required for this 4k gaming experience. In response to considerable public demand, these game assets were generated. Some manufacturers are also developing 8K screens to accommodate the new high-resolution game content.
  • Each of these economic developments has the potential to have beneficial results. The popularity of gaming devices may surge throughout the predicted period. Furthermore, increased rivalry among key companies may result in a quick rise of the gaming devices industry. The gaming accessory industry is seeing new entrants. This might lead to a slew of new ideas and increased market competitiveness. These chances for growth may raise market revenue.
  • Many competitive e-sports organisations have formed in recent years, organising and competing in e-sports contests for games. These rivals need a significant number of gaming devices, the sales of which contribute to the expansion of the gaming gadgets industry.

Several gaming accessory manufacturers encountered shipment delays during the Covid-19 pandemic because to a scarcity of manufacturing components and raw materials, given the majority of manufacturing operations are in China. After selling their inventory, the firms were left with an inadequate supply of the goods.

However, revenues in the first quarter of 2020 were offset by year-over-year revenue growth owing to increased demand for Corsair Gaming accessories as more individuals in more countries face shelter-in-place limitations.

Attributes Details
Gaming Gadgets Market CAGR (2022 to 2032) 8.2%
Gaming Gadgets Market Size (2022) US$ 71,305.3 million
Gaming Gadgets Market Size (2032) US$ 156,774.9 million

Don't pay for what you don't need

Customize your report by selecting specific countries or regions and save 30%!

Development Of Gaming Gadgets Market In North America

During the projection period, the US market is estimated to increase at a 6.3% CAGR. The United States is predicted to account for more than 79.4% of the market share in North America by 2021, owing to increasing affordability and higher discretionary income levels. The region's gaming devices industry is being driven by free-to-play and mobile games.

This country's gaming business is continually changing to stay up with the latest technology, such as augmented reality and virtual reality, in order to grab the interest and imagination of players worldwide. Furthermore, with the introduction of cloud gaming, increased internet penetration and gaming platform usage may offer a favourable atmosphere for development.

Opportunities Abound In The Residential Gaming Devices Segment

Residential gaming device use is estimated to account for a large 70.0% market share of gaming gadgets. The global usage of gaming devices is aided by the rising trend of linked homes. Furthermore, when the global population's income level rises, they will be able to spend more on housing and outfit their homes with new technology items, such as immersive gaming systems, at a quicker rate.

Because of the increased interest in casual leisure, devices for novices account for more than 53% of the market. The professional category, on the other hand, is predicted to increase at a faster rate, with a CAGR of 12.9% throughout the projection period.

In terms of gaming products, active gamers all over the world are spoiled for choice. They are also demonstrating a willingness to spend money on high-end products. The gaming gadgets market is growing as a result of frequent technological innovations such as augmented reality (AR) and virtual reality (VR). According to Future Market Insights (FMI), the gaming gadgets market may grow at a rate of 3.8% year on year.

Sneha Verghese
Sneha Verghese

Principal Consultant

Talk to Analyst

Find your sweet spots for generating winning opportunities in this market.

Impactful Influencers in Gaming Gadgets Market

  • A Spike in the Proportion of Game-Related Content Creators

Gaming has become a quite popular due to an increase in gaming-related content creators such as live streamers, players, and competitive e-sports players. The growing number of gaming content creators is driving growth in the gaming gadgets market, as these creators buy multiple types of gaming devices to play platform exclusive games and provide various types of content surrounding these devices.

  • Emergence of a Slew of Competitive E-Sports Organisations

In recent years, many competitive e-sports organisations have emerged, organising and competing in e-sports competitions for games. These competitors necessitate a large number of gaming devices; the sales of which contribute to the gaming gadgets market growth.

  • Current Market Developments

Some gaming gadgets innovations are more recent and critical to propelling the market forward. For example, the release of the Steam Deck, a portable gaming console with PC-like performance that can also be used as a PC, paves the way for further advancements in the gaming gadgets market.

Dipping Points Limiting the Gaming Gadgets Market Growth

Due to hardware scalpers, the prices of hardware used in devices are rising. This is causing a rise in the overall price of game consoles, which may negatively impact the gaming gadgets market over the long term.

The rising price of gaming peripherals is a stifling factor in the gaming gadgets market. Gaming is one of the most expensive industries. Gaming consoles and their accessories are more expensive. However, they have become more cost-effective in recent years. Nonetheless, some of the high-end accessories are pricey.

Some more expensive accessories include the DPI mouse and the ghost switch. This high-sensitivity mouse can provide the user with an exceptional gaming experience. Notwithstanding, it is only reasonably priced for a few o game enthusiasts. The high cost may limit demand for gaming gadgets and the gaming gadgets market expansion in the coming years.

Get the data you need at a Fraction of the cost

Personalize your report by choosing insights you need
and save 40%!

Crucial Gaming Gadgets Market Dynamics

  • Emergence of Next-Gen Nintendo Consoles ·

The release of next-generation home consoles may drive the gaming gadgets market growth. The leading gaming services are releasing gaming consoles with next-generation accessories. Some of the accessories with next-generation features include the remote, headset, controllers, and media remote. These accessories may draw a large number of end-users to the market.

  • Introduction of Accessories

The introduction of the accessories may significantly increase the gaming gadgets market supply rate. There may be new game content with a high graphic feature in the coming years. The need for complex hardware is essential for this 4k gaming experience. These gaming assets were created in response to widespread audience demand. Some manufacturers are also working on 8K displays for the new high-resolution gaming content.

  • Financial Developments

Every one of these economic trends may lead to positive changes. During the forecast period, the adoption of gaming gadgets may skyrocket. Furthermore, rising competition among key players may result in rapid gaming gadgets market expansion. New market players are entering the gaming accessory market. This may spur numerous innovations and increase market competition. These expansion prospects may boost market revenue.

Comparative View of Adjacent Gaming Gadgets Market 

Gaming Gadgets Market:

Attributes Gaming Gadgets Market
CAGR (2022 to 2032) 8.2%
Market Value (2027) US$ 110.84 billion
Growth Factor Smartphone adoption is a market demand driver that is steadily increasing.
Opportunity AR integration is yet another market demand generator. Many avid gamers require high-quality games.
Key Trends The Arrival of Nintendo's Next-Generation Consoles

Gaming Simulation Market:

Attributes Gaming Simulation Market
CAGR (2022 to 2032) 15.2%
Market Value (2027) US$ 12.92 billion
Growth Factor Steadily increasing use of gaming simulation for training and analysis in a variety of industries.
Opportunity The global gaming simulation market is growing as demand for virtual reality (VR) headsets rises.
Key Trends Adoption of AI and cloud computing for better experience, as well as increased collaboration between the entertainment industries and gaming simulator companies around the world, are expected to provide lucrative opportunities for the gaming simulation industry to grow.

Gaming Projector Market:

Attributes Gaming Projector Market
CAGR (2022 to 2032) 8.4%
Market Value (2027) US$ 1.78 billion
Growth Factor The increased demand for in-home entertainment solutions is expected to boost the gaming projector market opportunity.
Opportunity The gaming projector market is expected to grow due to an increase in disposable income in emerging economies.
Key Trends The gaming projector market is expected to grow due to an increase in demand for e-sports gaming solutions.

Top Gadget Type Segment in the Gaming Gadgets Market

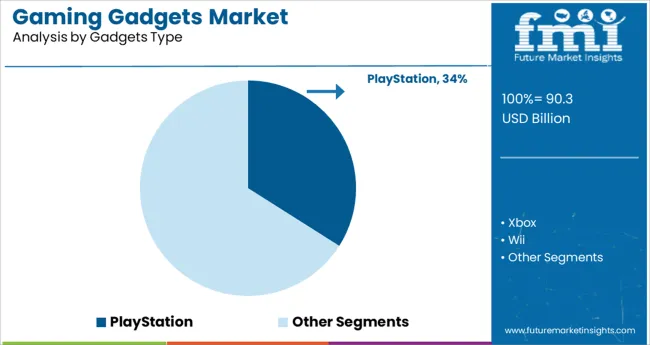
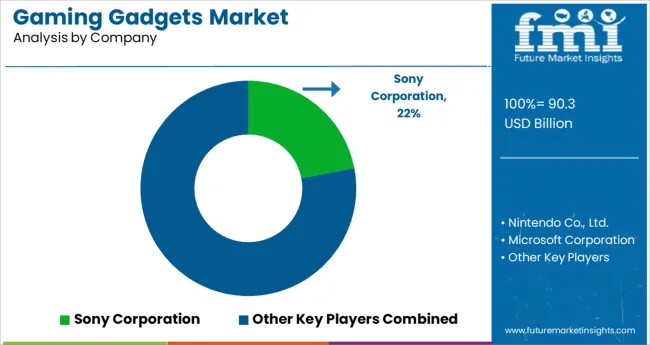
PlayStation and Xbox control a sizable portion of the gaming gadgets market. However, PlayStation is the market leader in the gadget type segment, with 46.3% of the market. Frequent technical and system updates have drawn a larger number of gamers to this brand.

In addition to this, the influence of social media is high on the end users. As a result, manufacturers adopt attractive social media strategy by collaborating with influencers to push the products into the space of end users.

Home Consoles to Remain the Preferred Category

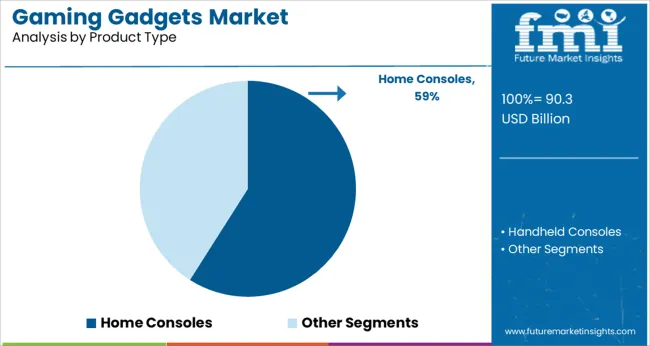
Home consoles accounted for roughly one-third of sales of gaming gadgets and are expected to grow the fastest, with a CAGR of more than 7.1% over the forecast period. To play video games, home consoles can be easily connected to display devices such as televisions and an external power source.

Most consoles have customized components to maximize space and power consumption in order to provide the best gaming performance while lowering costs through reduced storage and memory configurations. Due to their superior portability and lower cost, handheld consoles are expected to grow significantly during the forecast period.

Multi-brand Store-based Retailing Remains Major Sales Channel in the Gaming Gadgets Market

The multi-brand store-based retailing remains dominant, accounting for a significant 28.2% gaming gadgets market share. Customers can now compare and select from a wide range of available products, increasing foot traffic in these stores.

The convenience provided by online platforms is expected to boost market growth at a CAGR of 17.2%. Due to the closure of retail stores, COVID-19 lockdowns have increased the use of e-commerce websites. In the midst of the pandemic, market participants have used this opportunity to strengthen their presence through online channels.

Which is the Leading Segment in the Gaming Gadgets Market, by Age?

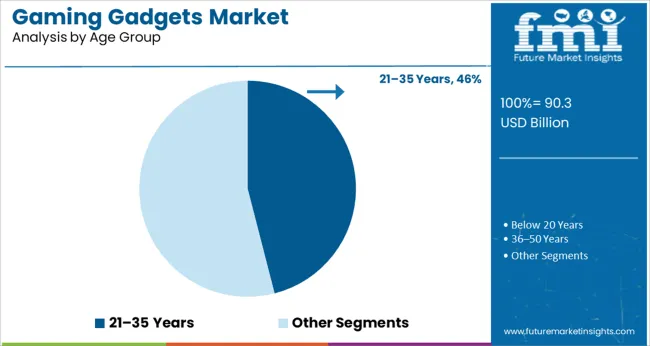
Gamers under the age of 20 accounts for a significant gaming gadgets market share of 53.9% of all devices. The Generation Z demographic has had a significant impact on industry trends. Gen Z is increasingly turning to video games for entertainment and recreation.

Many young gamers use games to form social connections. This demographic is more likely to spend money on gaming gadgets, which may boost sales.

By End Use, the Residential Gaming Device is Leading in the Gaming Gadgets Market

Residential gaming device use is expected to account for a sizable 70.0% gaming gadgets market share. The growing trend of connected homes assists the global adoption of gaming devices. Furthermore, the global population's income level is rising, allowing them to spend more on housing and equip their homes with new technological goods, such as immersive gaming devices, at a faster rate.

Due to widespread interest in casual entertainment, gadgets for beginners account for a significant share of more than 53%. However, the professional category is expected to grow at a faster rate, with a CAGR of 12.9% during the forecast period.
Prospects For the Future in Different Regions

How are the U.S. Millennials Cruising Gaming Gadget Sales?

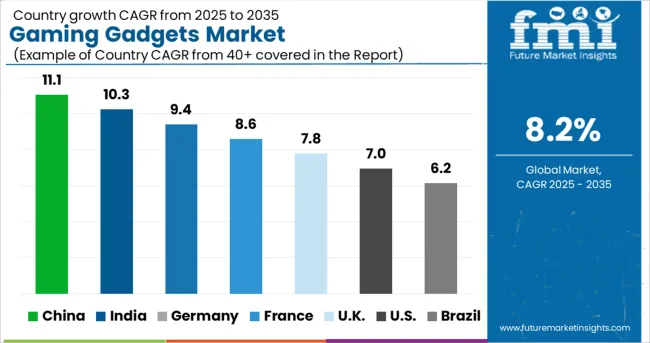
The US market is expected to grow at a 6.3% CAGR during the forecast period. Due to increased affordability and higher discretionary income levels, the United States is expected to account for more than 79.4% of the market share in North America by 2021. Free-to-play and mobile games are driving the gaming gadgets market growth in the region.

The gaming industry in this country is constantly evolving to keep up with the latest technologies, such as augmented reality and virtual reality, to capture the attention and imagination of gamers all over the world. Furthermore, with the advent of cloud gaming, rising internet penetration and adoption of gaming platforms may create a favorable environment for growth.

How is the Chinese Gaming Gadgets Market Holding Up to the Sales Expectations?

During the forecast period, East Asia is expected to be one of the most appealing markets. China is expected to account for more than 52.6% of the East Asian gaming gadgets market by 2021.

A key factor driving regional growth is China's increasing smartphone penetration and rising demand for entertainment. Due to the growing number of online gamers and online tournaments in East Asia, vendors are launching various platforms that allow gamers to access AAA-rated games.

With the inauguration and growing popularity of eSports in the country, China may overtake the United States as the second-largest Esports market. China has even established an Esports town in Hangzhou to train the next generation of competitive gamers. As a result of the increased demand for online gaming, the market for gaming gadgets has increased.

Why is there a Rise in the Demand for Gaming Gadgets in India?

The Indian market is expected to grow at a 14.1% CAGR during the forecast period. India may account for more than 31.2% of the South Asian market. As the gaming industry expands, the Indian government is expected to facilitate and regulate it actively.

Due to the high availability of skilled game developers and the country's rapid growth in the market, India is emerging as a popular outsourcing destination for global gaming companies. The primary reasons for this popularity are growth in the Internet and smart homes, improved digital payment infrastructure, technological advancement, rising income levels, ecosystem upgrades with 4G networks, and game preferences.

Digital gaming includes various genres available on mobile, computer, and console devices. The Indian gaming industry is currently experiencing a paradigm shift from mobile gaming to console gaming as wireless connectivity in the country improves, paving the way for gaming gadget sales.

How is the Start-up Ecosystem in the Gaming Gadgets Market?

The gaming gadgets market is thriving. The startups in this space are a diverse mix of hyper-growth scaleups, small creative startups, and everything in between.
  • Eloelo, a live streaming and social gaming app, has reached 2 million users since its release in September 2020. Eloelo embeds indigenous games within a live video chat room using ground-breaking technology.
  • Lightbox, March Gaming, and Duane Park Ventures led a $25 million (Rs 185 crore) Series A funding round for Rooter, a game streaming and e-sports platform.
  • Lysto, a Singapore and Bengaluru-based gaming platform, announced that it has raised more than $12 million in Pre-Series A funding as part of its mission to bring a billion gamers and their credentials on-chain.
  • Turnip, an online gaming community platform, announced a $12.5 million funding round led by Greenoaks and existing investor Elevation Capital.

How Competition Influences the Gaming Gadgets Market?

The gaming gadgets market is highly competitive due to the presence of a small number of global vendors with a significant market share. To remain competitive in the global market, manufacturers are primarily focused on improving their portfolio of gaming gadgets.

Nintendo Co., Ltd., Sony Corporation, Microsoft Corporation, Atari, Inc., Hyperkin, Inc., Razer Inc., NVIDIA Corporation, SEGA of America, Inc., Valve Corporation, Dell Technologies Inc., and Mad Catz Global Ltd. are key players.

Recent Development:

Samsung:

Date July 2021
Company Samsung
Strategy Launch
Details Samsung launched the Odessey Neo G9 gaming monitor with quantum mini-LED technology for HDR applications in July 2021.

Microsoft Corporation:

Date January 2021
Company Microsoft Corporation
Strategy Product Launch
Details Microsoft Corporation announced the release of Pulse red wireless controllers that can be used on multiple devices to switch between an Xbox console, a PC, and an Android device without having to repeat the setup process each time.

Logitech G:

Date February 2020
Company Logitech G
Strategy Partnership
Details Logitech G, a Logitech and Herman Miller brand, announced an exclusive partnership in February 2020 to research, design, and manufacture the next generation of high-performance furniture solutions for gamers. Both companies bring years of design and engineering expertise to their respective fields and may address the needs of esports athletes, players, and streamers when combined.

Sony:

Date February 2021
Company Sony
Strategy Announcement
Details Sony announced a next-generation VR headset for its PlayStation 5 console, which may be available sometime after 2021. The new VR system is expected to have higher resolution, more accurate head-tracking, and a wider field of view. It may also include the latest VR motion controller, as well as some of the new features of the PS5's DualSense pad.

Amazon:

Date October 2020
Company Amazon
Strategy Launch
Details Amazon launches Luna, a cloud gaming platform. In line with this, Amazon also announced its own Alexa-enabled Luna Controller, which may cost USD 49.99 during the early access period. It has a multi-antenna design that prioritises uninterrupted Wi-Fi for lower latency gaming. When playing Luna Controller with Cloud Direct vs.

Key Players 

  • Nintendo Co., Ltd
  • Sony Corporation
  • Microsoft Corporation
  • Atari, Inc.
  • Hyperkin, Inc.
  • Razer Inc.
  • NVIDIA Corporation
  • SEGA of America, Inc.
  • Valve Corp.
  • Dell Technologies Inc.
  • Mad Catz Global Ltd.

Key Segments  

By Gadgets Type:

  • PlayStation
  • Xbox
  • Wii
  • Others

By Product Type:

  • Handheld Consoles
  • Home Consoles

By Age Group:

  • Below 20 Years
  • 21-35 years
  • 36-50 Years
  • 51 Years and Above

By End Use:

  • Residential/Households
  • Commercial

By End User:

  • Beginners
  • Intermediates
  • Professional

By Sales Channel:

  • Direct Sales
  • Specialty Stores
  • Multi-brand Stores
  • Independent Small Stores
  • Online Retailers
  • Others

By Region:

  • North America
  • Latin America
  • Europe
  • East Asia
  • South Asia
  • Oceania
  • Middle East and Africa (MEA)

Frequently Asked Questions

How is the Gaming Gadgets Market Growing?

The gaming gadgets market is predicted to grow at 8.2% CAGR through 2032.

Which Region Holds the Highest Revenue Potential in the Gaming Gadgets Market?

United States gaming gadgets market holds the highest revenue potential.

What is the Current Gaming Gadgets Market Size?

The gaming gadgets market size is anticipated to be over US$ 75.74 billion in 2022.

What is the Future Scope of Growth for the Gaming Gadgets Market?

The gaming gadgets market is expected to surpass US$ 180.23 billion by 2032.

Table of Content

1. Executive Summary

    1.1. Global Market Outlook

    1.2. Summary of Key Statistics

    1.3. Summary of Key Findings

    1.4. Product Evolution Analysis

    1.5. FMI Analysis and Recommendations

2. Market Overview

    2.1. Market Taxonomy

    2.2. Market Definition

3. Key Market Trends

    3.1. Key Trends Impacting the Market

        3.1.1. Growing Trend of Professional Gamer Worldwide

        3.1.2. Motion Gaming - Revolutionized The Way People Play Games

        3.1.3. Global Interest in eSports Grows Explosively

        3.1.4. eSports Practically Prints Money

        3.1.5. Virtual Reality’s Influence Will Grow

        3.1.6. Key Shifts In Subscriptions Economy

        3.1.7. Growing Wireless Gadgets and Trend of Miniaturized Electronics

        3.1.8. Leverage The Power of Retailer Supremacy

        3.1.9. The Great Demand For The Smart Electronic Devices

        3.1.10. Consumer Touch Point Matters

        3.1.11. Social Media Is Must

        3.1.12. Rise of Mobile Commerce

    3.2. Product Development Trends

        3.2.1. Gadgets Is in the Spotlight

        3.2.2. Companies Increasingly Spending on R&D and Stepping Up Innovation

        3.2.3. Growing Consumer Interest in Multifunctional Products

        3.2.4. Prominent Players are Now Diversifying Into other Profitable Segments

        3.2.5. Evolution in Product Design

        3.2.6. Companies are Focusing on Strengthening the Premium Market Leadership

    3.3. Evolution of The Electronics and Semiconductor Industry

        3.3.1. Key Developments Roadmap

        3.3.2. Product Launches

        3.3.3. Acquisition & Mergers

        3.3.4. Expansion

4. The Video Gaming Industry Outlook

    4.1. Global The Video Game Market Analysis, 2019

    4.2. The Top Companies Making The Most From Video Games

    4.3. Low-Growth Giants vs High-Growth Indies Analysis

    4.4. The Video Gaming Market Outlook, Consumer Profile (% of Demand)

        4.4.1. By Gender Type (% of Demand)

            4.4.1.1. Male

            4.4.1.2. Female

        4.4.2. By Age Group (% of Demand)

            4.4.2.1. Below 20 Yrs.

            4.4.2.2. 21- 35 Yrs.

            4.4.2.3. 36 – 50 Yrs.

            4.4.2.4. 51 Yrs. and Above

        4.4.3. By Device Type (% of Demand)

            4.4.3.1. PC

            4.4.3.2. Mobile Phones/Tablets

            4.4.3.3. Gaming Devices (Console + Handheld)

            4.4.3.4. Others

        4.4.4. By Source to Find New Games (% of Demand)

            4.4.4.1. Friends/Family

            4.4.4.2. Game Sites/Reviews

            4.4.4.3. Online Video Channels

            4.4.4.4. Social Networks

            4.4.4.5. Online Advertising

            4.4.4.6. TV Commercial

            4.4.4.7. Ranking in App Stores

            4.4.4.8. Others

5. Virtual Reality (VR) in Gaming Industry

    5.1. The Virtual Reality in Gaming Market Size, 2019

    5.2. VR Gaming Offers an Unprecedented Immersive Experience

    5.3. The Amazing Potential of VR eSports

    5.4. VR Arcades are A “New Old” Development In The Video Games Industry

    5.5. Educational Uses of VR Video Games

6. Brand Mapping Analysis

    6.1. Price v/s Product

    6.2. Value for Money

    6.3. Top of Mind Gaming Gadgets Brands

    6.4. Brand Portfolio-by Key Players

    6.5. Usage Pattern Overview

7. Impact of Covid-19 on Gaming Gadgets Market

    7.1. Impact of Covid-19 on Electronics Industry

    7.2. Gaming Gadgets Sales Projection, Q1-Q4 2020 During Covid-19 Pandemic

    7.3. Pre Covid-19 Market Forecast v/s Post covid-19 Market Forecast

8. Covid-19 Impact on Retail Industry

    8.1. Coronavirus Impact Matrix

    8.2. Sales Increased Dramatically Across Most Categories; Paper Products, Home Care and Frozen Foods Spiked in all Countries

    8.3. Consumers Impact – Winning and Losing Segment Spending

    8.4. Consumers Shifting Toward Spending Online Shopping

    8.5. Consumer Sentiment Reflects Fear of the Virus and of Recession

9. Global Gaming Gadgets Market Demand Analysis 2016-2020 and Forecast, 2022-2032

    9.1. Historical Market Volume (Units) Analysis, 2016-2020

    9.2. Current and Future Market Volume (Units) Projections, 2022-2032

    9.3. Y-o-Y Growth Trend Analysis

10. Global Gaming Gadgets Market- Pricing Analysis

    10.1. Regional Pricing Analysis By Product Type

    10.2. Pricing Break-up

        10.2.1. Manufacturer Level Pricing

        10.2.2. Distributor Level Pricing

11. Global Gaming Gadgets Market Demand (in Value or Size in US$ Mn) Analysis 2016-2020 and Forecast, 2022-2032

    11.1. Historical Market Value (US$ Mn) Analysis, 2016-2020

    11.2. Current and Future Market Value (US$ Mn) Projections, 2022-2032

        11.2.1. Y-o-Y Growth Trend Analysis

        11.2.2. Absolute $ Opportunity Analysis

12. Social Media Sentiment Analysis

    12.1. Consumer perception for target products on social media platforms- Positive and Negative Mentions

    12.2. Trending Brands

    12.3. Trending #hashtags

    12.4. Social Media Platform Mentions (% of total mentions)

    12.5. Social Media Platform Mentions (% of total mentions)

    12.6. Trending Subject Titles

13. Market Background

    13.1. Macro-Economic Factors

        13.1.1. Global GDP Growth Outlook

        13.1.2. Global Consumer Spending Outlook

        13.1.3. Global Manufacturing Industry Outlook

        13.1.4. Retail Sector GVA and Growth

        13.1.5. Global Electronic Expenditure Outlook

        13.1.6. Global Electronic Industry Outlook

        13.1.7. Global Gaming Industry Outlook

        13.1.8. Global Urbanization Overview

        13.1.9. Outbreak of Covid-19 Pandemic

        13.1.10. Economic Instability

        13.1.11. Global e-Sports Participation Outlook

        13.1.12. Income Group Population Overview

        13.1.13. Impact of Online Sales

    13.2. Forecast Factors - Relevance & Impact

        13.2.1. Top Companies Historical Growth

        13.2.2. Global GDP Per Capita

        13.2.3. Electronics Industry Contribution to GDP Outlook

        13.2.4. Global Industry Production Outlook

        13.2.5. Manufacturing Sector Gross Value Added

        13.2.6. Global Retail Sales Outlook

        13.2.7. Urbanization Outlook

        13.2.8. Consumer Price Index

        13.2.9. Others

    13.3. Consumer Sentiment Analysis

        13.3.1. Which Specific Brand Is Preferred By The Consumers And Why?

        13.3.2. Factors Influencing Market Behaviour

        13.3.3. Are Consumers Ready To Pay Premium Price For Products?

        13.3.4. Does Social Media Influence Customer’s Decision Making?

        13.3.5. Which Mode of Advertisement Does Vendors Prefer?

        13.3.6. Which of The Social Media Platforms Does Companies Prefers For Branding?

        13.3.7. What Are The Key Challenges Associated With The Market Suppliers?

        13.3.8. Others

    13.4. PESTLE Analysis of Global Gaming Gadgets Market

    13.5. Porter’s Five Forces Analysis of Global Gaming Gadgets Market

    13.6. Market Dynamics

        13.6.1. Drivers

        13.6.2. Restraints

        13.6.3. Opportunity Analysis

14. Global Gaming Gadgets Market Analysis 2016-2020 and Forecast 2022-2032, by Gadget Type

    14.1. Introduction / Key Findings

    14.2. Historical Market Size (US$ Mn) and Volume (Mn Units) Analysis By Gadget Type, 2016 - 2020

    14.3. Current and Future Market Size (US$ Mn) and Volume (Mn Units) Analysis and Forecast By Gadget Type, 2022 - 2032

        14.3.1. PlayStation

        14.3.2. Xbox

        14.3.3. Wii

        14.3.4. Others (Sega, Atari, Game Boy, Switch, 3DS, GameCube, Vita)

    14.4. Market Attractiveness Analysis By Gadget Type

15. Global Gaming Gadgets Market Analysis 2016-2020 and Forecast 2022-2032, by Product Type

    15.1. Introduction / Key Findings

    15.2. Historical Market Size (US$ Mn) and Volume (Mn Units) Analysis By Product Type, 2016 - 2020

    15.3. Current and Future Market Size (US$ Mn) and Volume (Mn Units) Analysis and Forecast By Product Type, 2022 - 2032

        15.3.1. Handheld Consoles

        15.3.2. Home Consoles

    15.4. Market Attractiveness Analysis By Product Type

16. Global Gaming Gadgets Market Analysis 2016-2020 and Forecast 2022-2032, by Age Group

    16.1. Introduction / Key Findings

    16.2. Historical Market Size (US$ Mn) and Volume (Mn Units) Analysis By Age Group, 2016 - 2020

    16.3. Current and Future Market Size (US$ Mn) and Volume (Mn Units) Analysis and Forecast By Age Group, 2022 - 2032

        16.3.1. Below 20 Yrs.

        16.3.2. 21- 35 Yrs.

        16.3.3. 36 – 50 Yrs.

        16.3.4. 51 Yrs. and Above

    16.4. Market Attractiveness Analysis By Age Group

17. Global Gaming Gadgets Market Analysis 2016-2020 and Forecast 2022-2032, by End Use

    17.1. Introduction / Key Findings

    17.2. Historical Market Size (US$ Mn) and Volume (Mn Units) Analysis By End Use, 2016 - 2020

    17.3. Current and Future Market Size (US$ Mn) and Volume (Mn Units) Analysis and Forecast By End Use, 2022 - 2032

        17.3.1. Residential/Household

        17.3.2. Commercial

            17.3.2.1. Game Parlors/Centers

            17.3.2.2. Automotive

            17.3.2.3. Cafes & Restaurants

            17.3.2.4. Events

    17.4. Market Attractiveness Analysis By End Use

18. Global Gaming Gadgets Market Analysis 2016-2020 and Forecast 2022-2032, by End User

    18.1. Introduction / Key Findings

    18.2. Historical Market Size (US$ Mn) and Volume (Mn Units) Analysis By End User, 2016 - 2020

    18.3. Current and Future Market Size (US$ Mn) and Volume (Mn Units) Analysis and Forecast By End User, 2022 - 2032

        18.3.1. Beginners

        18.3.2. Intermediates

        18.3.3. Professional

    18.4. Market Attractiveness Analysis By End User

19. Global Gaming Gadgets Market Analysis 2016-2020 and Forecast 2022-2032, by Sales Channel

    19.1. Introduction / Key Findings

    19.2. Historical Market Size (US$ Mn) and Volume (Mn Units) Analysis By Sales Channel, 2016 - 2020

    19.3. Current and Future Market Size (US$ Mn) and Volume (Mn Units) Analysis and Forecast By Sales Channel, 2022 - 2032

        19.3.1. Direct Sales

        19.3.2. Specialty Stores

        19.3.3. Multi-brand Stores

        19.3.4. Independent Small Stores

        19.3.5. Online Retailers

        19.3.6. Others

    19.4. Market Attractiveness Analysis By Sales Channel

20. Global Gaming Gadgets Market Analysis 2016-2020 and Forecast 2022-2032, by Region

    20.1. Introduction

    20.2. Historical Market Size (US$ Mn) and Volume (Units) Analysis By Region, 2016-2020

    20.3. Current Market Size (US$ Mn) and Volume (Units) Analysis and Forecast By Region, 2022-2032

        20.3.1. North America

        20.3.2. Latin America

        20.3.3. Europe

        20.3.4. East Asia

        20.3.5. South Asia

        20.3.6. Oceania

        20.3.7. MEA

    20.4. Market Attractiveness Analysis By Region

21. North America Gaming Gadgets Market Analysis 2016-2020 and Forecast 2022-2032

    21.1. Introduction

    21.2. Pricing Analysis

    21.3. Historical Market Size (US$ Mn) and Volume Trend (Units) Analysis By Market Taxonomy, 2016-2020

    21.4. Market Size (US$ Mn) and Volume (Units) Forecast By Market Taxonomy, 2022-2032

        21.4.1. By Country

            21.4.1.1. U.S.

            21.4.1.2. Canada

        21.4.2. By Gadgets Type

        21.4.3. By Product Type

        21.4.4. By Age Group

        21.4.5. By End Use

        21.4.6. End User

        21.4.7. By Sales Channel

    21.5. Market Attractiveness Analysis

        21.5.1. By Country

        21.5.2. By Gadgets Type

        21.5.3. By Product Type

        21.5.4. By Age Group

        21.5.5. By End Use

        21.5.6. End user

        21.5.7. By Sales Channel

22. Latin America Gaming Gadgets Market Analysis 2016-2020 and Forecast 2022-2032

    22.1. Introduction

    22.2. Pricing Analysis

    22.3. Historical Market Size (US$ Mn) and Volume Trend (Units) Analysis By Market Taxonomy, 2016-2020

    22.4. Market Size (US$ Mn) and Volume (Units) Forecast By Market Taxonomy, 2022-2032

        22.4.1. By Country

            22.4.1.1. Mexico

            22.4.1.2. Brazil

            22.4.1.3. Rest of Latin America

        22.4.2. By Gadgets Type

        22.4.3. By Product Type

        22.4.4. By Age Group

        22.4.5. By End Use

        22.4.6. End user

        22.4.7. By Sales Channel

    22.5. Market Attractiveness Analysis

        22.5.1. By Country

        22.5.2. By Gadgets Type

        22.5.3. By Product Type

        22.5.4. By Age Group

        22.5.5. By End Use

        22.5.6. End User

        22.5.7. By Sales Channel

23. Europe Gaming Gadgets Market Analysis 2016-2020 and Forecast 2022-2032

    23.1. Introduction

    23.2. Pricing Analysis

    23.3. Historical Market Size (US$ Mn) and Volume Trend (Units) Analysis By Market Taxonomy, 2016-2020

    23.4. Market Size (US$ Mn) and Volume (Units) Forecast By Market Taxonomy, 2022-2032

        23.4.1. By Country

            23.4.1.1. Germany

            23.4.1.2. Italy

            23.4.1.3. France

            23.4.1.4. UK

            23.4.1.5. Spain

            23.4.1.6. Benelux

            23.4.1.7. Russia

            23.4.1.8. Rest of Europe

        23.4.2. By Gadgets Type

        23.4.3. By Product Type

        23.4.4. By Age Group

        23.4.5. By End Use

        23.4.6. End User

        23.4.7. By Sales Channel

    23.5. Market Attractiveness Analysis

        23.5.1. By Country

        23.5.2. By Gadgets Type

        23.5.3. By Product Type

        23.5.4. By Age Group

        23.5.5. By End Use

        23.5.6. End User

        23.5.7. By Sales Channel

24. East Asia Gaming Gadgets Market Analysis 2016-2020 and Forecast 2022-2032

    24.1. Introduction

    24.2. Pricing Analysis

    24.3. Historical Market Size (US$ Mn) and Volume Trend (Units) Analysis By Market Taxonomy, 2016-2020

    24.4. Market Size (US$ Mn) and Volume (Units) Forecast By Market Taxonomy, 2022-2032

        24.4.1. By Country

            24.4.1.1. China

            24.4.1.2. Japan

            24.4.1.3. South Korea

        24.4.2. By Gadgets Type

        24.4.3. By Product Type

        24.4.4. By Age Group

        24.4.5. By End Use

        24.4.6. End User

        24.4.7. By Sales Channel

    24.5. Market Attractiveness Analysis

        24.5.1. By Country

        24.5.2. By Gadgets Type

        24.5.3. By Product Type

        24.5.4. By Age Group

        24.5.5. By End Use

        24.5.6. End User

        24.5.7. By Sales Channel

25. South Asia Gaming Gadgets Market Analysis 2016-2020 and Forecast 2022-2032

    25.1. Introduction

    25.2. Pricing Analysis

    25.3. Historical Market Size (US$ Mn) and Volume Trend (Units) Analysis By Market Taxonomy, 2016-2020

    25.4. Market Size (US$ Mn) and Volume (Units) Forecast By Market Taxonomy, 2022-2032

        25.4.1. By Country

            25.4.1.1. India

            25.4.1.2. Thailand

            25.4.1.3. Indonesia

            25.4.1.4. Malaysia

            25.4.1.5. Rest of South Asia

        25.4.2. By Gadgets Type

        25.4.3. By Product Type

        25.4.4. By Age Group

        25.4.5. By End Use

        25.4.6. End User

        25.4.7. By Sales Channel

    25.5. Market Attractiveness Analysis

        25.5.1. By Country

        25.5.2. By Gadgets Type

        25.5.3. By Product Type

        25.5.4. By Age Group

        25.5.5. By End Use

        25.5.6. End User

        25.5.7. By Sales Channel

26. Oceania Gaming Gadgets Market Analysis 2016-2020 and Forecast 2022-2032

    26.1. Introduction

    26.2. Pricing Analysis

    26.3. Historical Market Size (US$ Mn) and Volume Trend (Units) Analysis By Market Taxonomy, 2016-2020

    26.4. Market Size (US$ Mn) and Volume (Units) Forecast By Market Taxonomy, 2022-2032

        26.4.1. By Country

            26.4.1.1. Australia

            26.4.1.2. New Zealand

        26.4.2. By Gadgets Type

        26.4.3. By Product Type

        26.4.4. By Age Group

        26.4.5. By End Use

        26.4.6. End User

        26.4.7. By Sales Channel

    26.5. Market Attractiveness Analysis

        26.5.1. By Country

        26.5.2. By Gadgets Type

        26.5.3. By Product Type

        26.5.4. By Age Group

        26.5.5. By End Use

        26.5.6. End User

        26.5.7. By Sales Channel

27. MEA Gaming Gadgets Market Analysis 2016-2020 and Forecast 2022-2032

    27.1. Introduction

    27.2. Pricing Analysis

    27.3. Historical Market Size (US$ Mn) and Volume Trend (Units) Analysis By Market Taxonomy, 2016-2020

    27.4. Market Size (US$ Mn) and Volume (Units) Forecast By Market Taxonomy, 2022-2032

        27.4.1. By Country

            27.4.1.1. GCC Countries

            27.4.1.2. Turkey

            27.4.1.3. Northern Africa

            27.4.1.4. South Africa

            27.4.1.5. Rest of MEA

        27.4.2. By Gadgets Type

        27.4.3. By Product Type

        27.4.4. By Age Group

        27.4.5. By End Use

        27.4.6. End User

        27.4.7. By Sales Channel

    27.5. Market Attractiveness Analysis

        27.5.1. By Country

        27.5.2. By Gadgets Type

        27.5.3. By Product Type

        27.5.4. By Age Group

        27.5.5. By End Use

        27.5.6. End User

        27.5.7. By Sales Channel

28. Market Structure Analysis

    28.1. Market Analysis by Tier of Companies (Gaming Gadgets)

    28.2. Market Concentration

    28.3. Market Share Analysis of Top Players

    28.4. Market Presence Analysis

        28.4.1. By Regional footprint of Players

        28.4.2. Product foot print by Players

        28.4.3. Channel Foot Print by Players

29. Competition Analysis

    29.1. Competition Dashboard

    29.2. Pricing Analysis by Competition

    29.3. Competition Benchmarking

    29.4. Competition Deep Dive

        29.4.1. Nintendo Co., Ltd.

            29.4.1.1. Overview

            29.4.1.2. Product Portfolio

            29.4.1.3. Profitability by Market Segments (Product/Channel/Region)

            29.4.1.4. Sales Footprint

            29.4.1.5. Strategy Overview

                29.4.1.5.1. Marketing Strategy

                29.4.1.5.2. Product Strategy

                29.4.1.5.3. Channel Strategy

        29.4.2. Sony Corporation

            29.4.2.1. Overview

            29.4.2.2. Product Portfolio

            29.4.2.3. Profitability by Market Segments (Product/Channel/Region)

            29.4.2.4. Sales Footprint

            29.4.2.5. Strategy Overview

                29.4.2.5.1. Marketing Strategy

                29.4.2.5.2. Product Strategy

                29.4.2.5.3. Channel Strategy

        29.4.3. Microsoft Corporation

            29.4.3.1. Overview

            29.4.3.2. Product Portfolio

            29.4.3.3. Profitability by Market Segments (Product/Channel/Region)

            29.4.3.4. Sales Footprint

            29.4.3.5. Strategy Overview

                29.4.3.5.1. Marketing Strategy

                29.4.3.5.2. Product Strategy

                29.4.3.5.3. Channel Strategy

        29.4.4. Atari, Inc.

            29.4.4.1. Overview

            29.4.4.2. Product Portfolio

            29.4.4.3. Profitability by Market Segments (Product/Channel/Region)

            29.4.4.4. Sales Footprint

            29.4.4.5. Strategy Overview

                29.4.4.5.1. Marketing Strategy

                29.4.4.5.2. Product Strategy

                29.4.4.5.3. Channel Strategy

        29.4.5. Hyperkin, Inc.

            29.4.5.1. Overview

            29.4.5.2. Product Portfolio

            29.4.5.3. Profitability by Market Segments (Product/Channel/Region)

            29.4.5.4. Sales Footprint

            29.4.5.5. Strategy Overview

                29.4.5.5.1. Marketing Strategy

                29.4.5.5.2. Product Strategy

                29.4.5.5.3. Channel Strategy

        29.4.6. Razer Inc.

            29.4.6.1. Overview

            29.4.6.2. Product Portfolio

            29.4.6.3. Profitability by Market Segments (Product/Channel/Region)

            29.4.6.4. Sales Footprint

            29.4.6.5. Strategy Overview

                29.4.6.5.1. Marketing Strategy

                29.4.6.5.2. Product Strategy

                29.4.6.5.3. Channel Strategy

        29.4.7. NVIDIA Corporation

            29.4.7.1. Overview

            29.4.7.2. Product Portfolio

            29.4.7.3. Profitability by Market Segments (Product/Channel/Region)

            29.4.7.4. Sales Footprint

            29.4.7.5. Strategy Overview

                29.4.7.5.1. Marketing Strategy

                29.4.7.5.2. Product Strategy

                29.4.7.5.3. Channel Strategy

        29.4.8. SEGA of America, Inc.

            29.4.8.1. Overview

            29.4.8.2. Product Portfolio

            29.4.8.3. Profitability by Market Segments (Product/Channel/Region)

            29.4.8.4. Sales Footprint

            29.4.8.5. Strategy Overview

                29.4.8.5.1. Marketing Strategy

                29.4.8.5.2. Product Strategy

                29.4.8.5.3. Channel Strategy

        29.4.9. Valve Corp.

            29.4.9.1. Overview

            29.4.9.2. Product Portfolio

            29.4.9.3. Profitability by Market Segments (Product/Channel/Region)

            29.4.9.4. Sales Footprint

            29.4.9.5. Strategy Overview

                29.4.9.5.1. Marketing Strategy

                29.4.9.5.2. Product Strategy

                29.4.9.5.3. Channel Strategy

        29.4.10. Dell Technologies Inc.

            29.4.10.1. Overview

            29.4.10.2. Product Portfolio

            29.4.10.3. Profitability by Market Segments (Product/Channel/Region)

            29.4.10.4. Sales Footprint

            29.4.10.5. Strategy Overview

                29.4.10.5.1. Marketing Strategy

                29.4.10.5.2. Product Strategy

                29.4.10.5.3. Channel Strategy

        29.4.11. Mad Catz Global Ltd.

            29.4.11.1. Overview

            29.4.11.2. Product Portfolio

            29.4.11.3. Profitability by Market Segments (Product/Channel/Region)

            29.4.11.4. Sales Footprint

            29.4.11.5. Strategy Overview

                29.4.11.5.1. Marketing Strategy

                29.4.11.5.2. Product Strategy

                29.4.11.5.3. Channel Strategy

        29.4.12. Mattel Inc.

            29.4.12.1. Overview

            29.4.12.2. Product Portfolio

            29.4.12.3. Profitability by Market Segments (Product/Channel/Region)

            29.4.12.4. Sales Footprint

            29.4.12.5. Strategy Overview

                29.4.12.5.1. Marketing Strategy

                29.4.12.5.2. Product Strategy

                29.4.12.5.3. Channel Strategy

        29.4.13. Others (As Per Request)

            29.4.13.1. Overview

            29.4.13.2. Product Portfolio

            29.4.13.3. Profitability by Market Segments (Product/Channel/Region)

            29.4.13.4. Sales Footprint

            29.4.13.5. Strategy Overview

                29.4.13.5.1. Marketing Strategy

                29.4.13.5.2. Product Strategy

                29.4.13.5.3. Channel Strategy

30. Assumptions and Acronyms Used

31. Research Methodology

Don't pay for what you don't need

Customize your report by selecting specific countries or regions and save 30%!

List of Tables

Table 1: Global Gaming Gadgets Market Value (US$ Mn) Forecast, By Gadget Type, 2016-2032

Table 2: Global Gaming Gadgets Market Volume ('000 Units) Forecast, By Gadget Type, 2016-2032

Table 3: Global Gaming Gadgets Market Value (US$ Mn) Forecast, By Product Type, 2016-2032

Table 4: Global Gaming Gadgets Market Volume ('000 Units) Forecast, By Product Type, 2016-2032

Table 5: Global Gaming Gadgets Market Value (US$ Mn) Forecast, By Age Group, 2016-2032

Table 6: Global Gaming Gadgets Market Volume ('000 Units) Forecast, By Age Group, 2016-2032

Table 7: Global Gaming Gadgets Market Value (US$ Mn) Forecast, By End Use, 2016-2032

Table 8: Global Gaming Gadgets Market Volume ('000 Units) Forecast, By End Use, 2016-2032

Table 9: Global Gaming Gadgets Market Value (US$ Mn) Forecast, By End User, 2016-2032

Table 10: Global Gaming Gadgets Market Volume ('000 Units) Forecast, By End User, 2016-2032

Table 11: Global Gaming Gadgets Market Value (US$ Mn) Forecast, By Sales Channel, 2016-2032

Table 12: Global Gaming Gadgets Market Volume ('000 Units) Forecast, By Sales Channel, 2016-2032

Table 13: Global Gaming Gadgets Market Value (US$ Mn) Forecast, By Region, 2016-2032

Table 14: Global Gaming Gadgets Market Volume ('000 Units) Forecast, By Region, 2016-2032

Table 15: North America Gaming Gadgets Market Value (US$ Mn) Forecast, By Gadget Type, 2016-2032

Table 16: North America Gaming Gadgets Market Volume ('000 Units) Forecast, By Gadget Type, 2016-2032

Table 17: North America Gaming Gadgets Market Value (US$ Mn) Forecast, By Product Type, 2016-2032

Table 18: North America Gaming Gadgets Market Volume ('000 Units) Forecast, By Product Type, 2016-2032

Table 19: North America Gaming Gadgets Market Value (US$ Mn) Forecast, By Age Group, 2016-2032

Table 20: North America Gaming Gadgets Market Volume ('000 Units) Forecast, By Age Group, 2016-2032

Table 21: North America Gaming Gadgets Market Value (US$ Mn) Forecast, By End Use, 2016-2032

Table 22: North America Gaming Gadgets Market Volume ('000 Units) Forecast, By End Use, 2016-2032

Table 23: North America Gaming Gadgets Market Value (US$ Mn) Forecast, By End User, 2016-2032

Table 24: North America Gaming Gadgets Market Volume ('000 Units) Forecast, By End User, 2016-2032

Table 25: North America Gaming Gadgets Market Value (US$ Mn) Forecast, By Sales Channel, 2016-2032

Table 26: North America Gaming Gadgets Market Volume ('000 Units) Forecast, By Sales Channel, 2016-2032

Table 27: North America Gaming Gadgets Market Value (US$ Mn) Forecast, By Country, 2016-2032

Table 28: North America Gaming Gadgets Market Volume ('000 Units) Forecast, By Country, 2016-2032

Table 29: Latin America Gaming Gadgets Market Value (US$ Mn) Forecast, By Gadget Type, 2016-2032

Table 30: Latin America Gaming Gadgets Market Volume ('000 Units) Forecast, By Gadget Type, 2016-2032

Table 31: Latin America Gaming Gadgets Market Value (US$ Mn) Forecast, By Product Type, 2016-2032

Table 32: Latin America Gaming Gadgets Market Volume ('000 Units) Forecast, By Product Type, 2016-2032

Table 33: Latin America Gaming Gadgets Market Value (US$ Mn) Forecast, By Age Group, 2016-2032

Table 34: Latin America Gaming Gadgets Market Volume ('000 Units) Forecast, By Age Group, 2016-2032

Table 35: Latin America Gaming Gadgets Market Value (US$ Mn) Forecast, By End Use, 2016-2032

Table 36: Latin America Gaming Gadgets Market Volume ('000 Units) Forecast, By End Use, 2016-2032

Table 37: Latin America Gaming Gadgets Market Value (US$ Mn) Forecast, By End User, 2016-2032

Table 38: Latin America Gaming Gadgets Market Volume ('000 Units) Forecast, By End User, 2016-2032

Table 39: Latin America Gaming Gadgets Market Value (US$ Mn) Forecast, By Sales Channel, 2016-2032

Table 40: Latin America Gaming Gadgets Market Volume ('000 Units) Forecast, By Sales Channel, 2016-2032

Table 41: Latin America Gaming Gadgets Market Value (US$ Mn) Forecast, By Country, 2016-2032

Table 42: Latin America Gaming Gadgets Market Volume ('000 Units) Forecast, By Country, 2016-2032

Table 43: Europe Gaming Gadgets Market Value (US$ Mn) Forecast, By Gadget Type, 2016-2032

Table 44: Europe Gaming Gadgets Market Volume ('000 Units) Forecast, By Gadget Type, 2016-2032

Table 45: Europe Gaming Gadgets Market Value (US$ Mn) Forecast, By Product Type, 2016-2032

Table 46: Europe Gaming Gadgets Market Volume ('000 Units) Forecast, By Product Type, 2016-2032

Table 47: Europe Gaming Gadgets Market Value (US$ Mn) Forecast, By Age Group, 2016-2032

Table 48: Europe Gaming Gadgets Market Volume ('000 Units) Forecast, By Age Group, 2016-2032

Table 49: Europe Gaming Gadgets Market Value (US$ Mn) Forecast, By End Use, 2016-2032

Table 50: Europe Gaming Gadgets Market Volume ('000 Units) Forecast, By End Use, 2016-2032

Table 51: Europe Gaming Gadgets Market Value (US$ Mn) Forecast, By End User, 2016-2032

Table 52: Europe Gaming Gadgets Market Volume ('000 Units) Forecast, By End User, 2016-2032

Table 53: Europe Gaming Gadgets Market Value (US$ Mn) Forecast, By Sales Channel, 2016-2032

Table 54: Europe Gaming Gadgets Market Volume ('000 Units) Forecast, By Sales Channel, 2016-2032

Table 55: Europe Gaming Gadgets Market Value (US$ Mn) Forecast, By Country, 2016-2032

Table 56: Europe Gaming Gadgets Market Volume ('000 Units) Forecast, By Country, 2016-2032

Table 57: South Asia Gaming Gadgets Market Value (US$ Mn) Forecast, By Gadget Type, 2016-2032

Table 58: South Asia Gaming Gadgets Market Volume ('000 Units) Forecast, By Gadget Type, 2016-2032

Table 59: South Asia Gaming Gadgets Market Value (US$ Mn) Forecast, By Product Type, 2016-2032

Table 60: South Asia Gaming Gadgets Market Volume ('000 Units) Forecast, By Product Type, 2016-2032

Table 61: South Asia Gaming Gadgets Market Value (US$ Mn) Forecast, By Age Group, 2016-2032

Table 62: South Asia Gaming Gadgets Market Volume ('000 Units) Forecast, By Age Group, 2016-2032

Table 63: South Asia Gaming Gadgets Market Value (US$ Mn) Forecast, By End Use, 2016-2032

Table 64: South Asia Gaming Gadgets Market Volume ('000 Units) Forecast, By End Use, 2016-2032

Table 65: South Asia Gaming Gadgets Market Value (US$ Mn) Forecast, By End User, 2016-2032

Table 66: South Asia Gaming Gadgets Market Volume ('000 Units) Forecast, By End User, 2016-2032

Table 67: South Asia Gaming Gadgets Market Value (US$ Mn) Forecast, By Sales Channel, 2016-2032

Table 68: South Asia Gaming Gadgets Market Volume ('000 Units) Forecast, By Sales Channel, 2016-2032

Table 69: South Asia Gaming Gadgets Market Value (US$ Mn) Forecast, By Country, 2016-2032

Table 70: South Asia Gaming Gadgets Market Volume ('000 Units) Forecast, By Country, 2016-2032

Table 71: East Asia Gaming Gadgets Market Value (US$ Mn) Forecast, By Gadget Type, 2016-2032

Table 72: East Asia Gaming Gadgets Market Volume ('000 Units) Forecast, By Gadget Type, 2016-2032

Table 73: East Asia Gaming Gadgets Market Value (US$ Mn) Forecast, By Product Type, 2016-2032

Table 74: East Asia Gaming Gadgets Market Volume ('000 Units) Forecast, By Product Type, 2016-2032

Table 75: East Asia Gaming Gadgets Market Value (US$ Mn) Forecast, By Age Group, 2016-2032

Table 76: East Asia Gaming Gadgets Market Volume ('000 Units) Forecast, By Age Group, 2016-2032

Table 77: East Asia Gaming Gadgets Market Value (US$ Mn) Forecast, By End Use, 2016-2032

Table 78: East Asia Gaming Gadgets Market Volume ('000 Units) Forecast, By End Use, 2016-2032

Table 79: East Asia Gaming Gadgets Market Value (US$ Mn) Forecast, By End User, 2016-2032

Table 80: East Asia Gaming Gadgets Market Volume ('000 Units) Forecast, By End User, 2016-2032

Table 81: East Asia Gaming Gadgets Market Value (US$ Mn) Forecast, By Sales Channel, 2016-2032

Table 82: East Asia Gaming Gadgets Market Volume ('000 Units) Forecast, By Sales Channel, 2016-2032

Table 83: East Asia Gaming Gadgets Market Value (US$ Mn) Forecast, By Country, 2016-2032

Table 84: East Asia Gaming Gadgets Market Volume ('000 Units) Forecast, By Country, 2016-2032

Table 85: Oceania Gaming Gadgets Market Value (US$ Mn) Forecast, By Gadget Type, 2016-2032

Table 86: Oceania Gaming Gadgets Market Volume ('000 Units) Forecast, By Gadget Type, 2016-2032

Table 87: Oceania Gaming Gadgets Market Value (US$ Mn) Forecast, By Product Type, 2016-2032

Table 88: Oceania Gaming Gadgets Market Volume ('000 Units) Forecast, By Product Type, 2016-2032

Table 89: Oceania Gaming Gadgets Market Value (US$ Mn) Forecast, By Age Group, 2016-2032

Table 90: Oceania Gaming Gadgets Market Volume ('000 Units) Forecast, By Age Group, 2016-2032

Table 91: Oceania Gaming Gadgets Market Value (US$ Mn) Forecast, By End Use, 2016-2032

Table 92: Oceania Gaming Gadgets Market Volume ('000 Units) Forecast, By End Use, 2016-2032

Table 93: Oceania Gaming Gadgets Market Value (US$ Mn) Forecast, By End User, 2016-2032

Table 94: Oceania Gaming Gadgets Market Volume ('000 Units) Forecast, By End User, 2016-2032

Table 95: Oceania Gaming Gadgets Market Value (US$ Mn) Forecast, By Sales Channel, 2016-2032

Table 96: Oceania Gaming Gadgets Market Volume ('000 Units) Forecast, By Sales Channel, 2016-2032

Table 97: Oceania Gaming Gadgets Market Value (US$ Mn) Forecast, By Country, 2016-2032

Table 98: Oceania Gaming Gadgets Market Volume ('000 Units) Forecast, By Country, 2016-2032

Table 99: Middle East and Africa Gaming Gadgets Market Value (US$ Mn) Forecast, By Gadget Type, 2016-2032

Table 100: Middle East and Africa Gaming Gadgets Market Volume ('000 Units) Forecast, By Gadget Type, 2016-2032

Table 101: Middle East and Africa Gaming Gadgets Market Value (US$ Mn) Forecast, By Product Type, 2016-2032

Table 102: Middle East and Africa Gaming Gadgets Market Volume ('000 Units) Forecast, By Product Type, 2016-2032

Table 103: Middle East and Africa Gaming Gadgets Market Value (US$ Mn) Forecast, By Age Group, 2016-2032

Table 104: Middle East and Africa Gaming Gadgets Market Volume ('000 Units) Forecast, By Age Group, 2016-2032

Table 105: Middle East and Africa Gaming Gadgets Market Value (US$ Mn) Forecast, By End Use, 2016-2032

Table 106: Middle East and Africa Gaming Gadgets Market Volume ('000 Units) Forecast, By End Use, 2016-2032

Table 107: Middle East and Africa Gaming Gadgets Market Value (US$ Mn) Forecast, By End User, 2016-2032

Table 108: Middle East and Africa Gaming Gadgets Market Volume ('000 Units) Forecast, By End User, 2016-2032

Table 109: Middle East and Africa Gaming Gadgets Market Value (US$ Mn) Forecast, By Sales Channel, 2016-2032

Table 110: Middle East and Africa Gaming Gadgets Market Volume ('000 Units) Forecast, By Sales Channel, 2016-2032

Table 111: Middle East and Africa Gaming Gadgets Market Value (US$ Mn) Forecast, By Country, 2016-2032

Table 112: Middle East and Africa Gaming Gadgets Market Volume ('000 Units) Forecast, By Country, 2016-2032

Table 113: Middle East and Africa Mobile Refrigerator Market Value (US$ Mn) Forecast, By Technology Type, 2016-2032

Table 114: Middle East and Africa Mobile Refrigerator Market Volume ('000 Units) Forecast, By Technology Type, 2016-2032

Table 115: Middle East and Africa Mobile Refrigerator Market Value (US$ Mn) Forecast, By Product Type, 2016-2032

Table 116: Middle East and Africa Mobile Refrigerator Market Volume ('000 Units) Forecast, By Product Type, 2016-2032

Table 117: Middle East and Africa Mobile Refrigerator Market Value (US$ Mn) Forecast, By Application, 2016-2032

Table 118: Middle East and Africa Mobile Refrigerator Market Volume ('000 Units) Forecast, By Application, 2016-2032

Table 119: Middle East and Africa Mobile Refrigerator Market Value (US$ Mn) Forecast, By Build Type, 2016-2032

Table 120: Middle East and Africa Mobile Refrigerator Market Volume ('000 Units) Forecast, By Build Type, 2016-2032

Table 121: Middle East and Africa Mobile Refrigerator Market Value (US$ Mn) Forecast, By Capacity, 2016-2032

Table 122: Middle East and Africa Mobile Refrigerator Market Volume ('000 Units) Forecast, By Capacity, 2016-2032

Table 123: Middle East and Africa Mobile Refrigerator Market Value (US$ Mn) Forecast, By Price Range, 2016-2032

Table 124: Middle East and Africa Mobile Refrigerator Market Volume ('000 Units) Forecast, By Price Range, 2016-2032

Table 125: Middle East and Africa Mobile Refrigerator Market Value (US$ Mn) Forecast, By Sales Channel, 2016-2032

Table 126: Middle East and Africa Mobile Refrigerator Market Volume ('000 Units) Forecast, By Sales Channel, 2016-2032

Table 127: Middle East and Africa Mobile Refrigerator Market Value (US$ Mn) Forecast, By Country, 2016-2032

Table 128: Middle East and Africa Mobile Refrigerator Market Volume ('000 Units) Forecast, By Country, 2016-2032
Sneha Verghese
Sneha Verghese

Principal Consultant

Talk to Analyst

Find your sweet spots for generating winning opportunities in this market.

List of Charts

Figure 1: Global Gaming Gadgets Market Value (US$ Mn) and Volume ('000 Units) Analysis, 2016-2020

Figure 2: Global Gaming Gadgets Market Value (US$ Mn) and Volume ('000 Units) Forecast, 2022-2032

Figure 3: Global Gaming Gadgets Market Analysis, 2016-2020

Figure 4: Global Gaming Gadgets Market Forecast, 2022-2032

Figure 5: Global Gaming Gadgets Market Absolute $ Opportunity Value (US$ Mn), 2022-2032

Figure 6: Global Gaming Gadgets Market Value (US$ Mn) Analysis, By Gadget Type, 2016-2032

Figure 7: Global Gaming Gadgets Market Volume ('000 Units) Analysis, By Gadget Type, 2016-2032

Figure 8: Global Gaming Gadgets Market Share and BPS Analysis, By Gadget Type, 2022 & 2032

Figure 9: Global Gaming Gadgets Market Y-o-Y Growth (%) Projections, By Gadget Type, 2022-2032

Figure 10: Global Gaming Gadgets Market Attractiveness, By Gadget Type, 2016-2032

Figure 11: Global Gaming Gadgets Market Value (US$ Mn) Analysis, By Product Type, 2016-2032

Figure 12: Global Gaming Gadgets Market Volume ('000 Units) Analysis, By Product Type, 2016-2032

Figure 13: Global Gaming Gadgets Market Share and BPS Analysis, By Product Type, 2022 & 2032

Figure 14: Global Gaming Gadgets Market Y-o-Y Growth (%) Projections, By Product Type, 2022-2032

Figure 15: Global Gaming Gadgets Market Attractiveness, By Product Type, 2016-2032

Figure 16: Global Gaming Gadgets Market Value (US$ Mn) Analysis, By Age Group, 2016-2032

Figure 17: Global Gaming Gadgets Market Volume ('000 Units) Analysis, By Age Group, 2016-2032

Figure 18: Global Gaming Gadgets Market Share and BPS Analysis, By Age Group, 2022 & 2032

Figure 19: Global Gaming Gadgets Market Y-o-Y Growth (%) Projections, By Age Group, 2022-2032

Figure 20: Global Gaming Gadgets Market Attractiveness, By Age Group, 2016-2032

Figure 21: Global Gaming Gadgets Market Value (US$ Mn) Analysis, By End Use, 2016-2032

Figure 22: Global Gaming Gadgets Market Volume ('000 Units) Analysis, By End Use, 2016-2032

Figure 23: Global Gaming Gadgets Market Share and BPS Analysis, By End Use, 2022 & 2032

Figure 24: Global Gaming Gadgets Market Y-o-Y Growth (%) Projections, By End Use, 2022-2032

Figure 25: Global Gaming Gadgets Market Attractiveness, By End Use, 2016-2032

Figure 26: Global Gaming Gadgets Market Value (US$ Mn) Analysis, By End Use, 2016-2032

Figure 27: Global Gaming Gadgets Market Volume ('000 Units) Analysis, By End Use, 2016-2032

Figure 28: Global Gaming Gadgets Market Share and BPS Analysis, By End Use, 2022 & 2032

Figure 29: Global Gaming Gadgets Market Y-o-Y Growth (%) Projections, By End Use, 2022-2032

Figure 30: Global Gaming Gadgets Market Attractiveness, By End Use, 2016-2032

Figure 31: Global Gaming Gadgets Market Value (US$ Mn) Analysis, By Sales Channel, 2016-2032

Figure 32: Global Gaming Gadgets Market Volume ('000 Units) Analysis, By Sales Channel, 2016-2032

Figure 33: Global Gaming Gadgets Market Share and BPS Analysis, By Sales Channel, 2022 & 2032

Figure 34: Global Gaming Gadgets Market Y-o-Y Growth (%) Projections, By Sales Channel, 2022-2032

Figure 35: Global Gaming Gadgets Market Attractiveness, By Sales Channel, 2016-2032

Figure 36: Global Gaming Gadgets Market Value (US$ Mn) Analysis, By Region, 2016-2032

Figure 37: Global Gaming Gadgets Market Volume ('000 Units) Analysis, By Region, 2016-2032

Figure 38: Global Gaming Gadgets Market Share and BPS Analysis, By Region, 2022 & 2032

Figure 39: Global Gaming Gadgets Market Y-o-Y Growth (%) Projections, By Region, 2022-2032

Figure 40: Global Gaming Gadgets Market Attractiveness, By Region, 2016-2032

Figure 41: North America Gaming Gadgets Market Value (US$ Mn) Analysis, By Gadget Type, 2016-2032

Figure 42: North America Gaming Gadgets Market Volume ('000 Units) Analysis, By Gadget Type, 2016-2032

Figure 43: North America Gaming Gadgets Market Share and BPS Analysis, By Gadget Type, 2022 & 2032

Figure 44: North America Gaming Gadgets Market Y-o-Y Growth (%) Projections, By Gadget Type, 2022-2032

Figure 45: North America Gaming Gadgets Market Attractiveness, By Gadget Type, 2016-2032

Figure 46: North America Gaming Gadgets Market Value (US$ Mn) Analysis, By Product Type, 2016-2032

Figure 47: North America Gaming Gadgets Market Volume ('000 Units) Analysis, By Product Type, 2016-2032

Figure 48: North America Gaming Gadgets Market Share and BPS Analysis, By Product Type, 2022 & 2032

Figure 49: North America Gaming Gadgets Market Y-o-Y Growth (%) Projections, By Product Type, 2022-2032

Figure 50: North America Gaming Gadgets Market Attractiveness, By Product Type, 2016-2032

Figure 51: North America Gaming Gadgets Market Value (US$ Mn) Analysis, By Age Group, 2016-2032

Figure 52: North America Gaming Gadgets Market Volume ('000 Units) Analysis, By Age Group, 2016-2032

Figure 53: North America Gaming Gadgets Market Share and BPS Analysis, By Age Group, 2022 & 2032

Figure 54: North America Gaming Gadgets Market Y-o-Y Growth (%) Projections, By Age Group, 2022-2032

Figure 55: North America Gaming Gadgets Market Attractiveness, By Age Group, 2016-2032

Figure 56: North America Gaming Gadgets Market Value (US$ Mn) Analysis, By End Use, 2016-2032

Figure 57: North America Gaming Gadgets Market Volume ('000 Units) Analysis, By End Use, 2016-2032

Figure 58: North America Gaming Gadgets Market Share and BPS Analysis, By End Use, 2022 & 2032

Figure 59: North America Gaming Gadgets Market Y-o-Y Growth (%) Projections, By End Use, 2022-2032

Figure 60: North America Gaming Gadgets Market Attractiveness, By End Use, 2016-2032

Figure 61: North America Gaming Gadgets Market Value (US$ Mn) Analysis, By End Use, 2016-2032

Figure 62: North America Gaming Gadgets Market Volume ('000 Units) Analysis, By End Use, 2016-2032

Figure 63: North America Gaming Gadgets Market Share and BPS Analysis, By End Use, 2022 & 2032

Figure 64: North America Gaming Gadgets Market Y-o-Y Growth (%) Projections, By End Use, 2022-2032

Figure 65: North America Gaming Gadgets Market Attractiveness, By End Use, 2016-2032

Figure 66: North America Gaming Gadgets Market Value (US$ Mn) Analysis, By Sales Channel, 2016-2032

Figure 67: North America Gaming Gadgets Market Volume ('000 Units) Analysis, By Sales Channel, 2016-2032

Figure 68: North America Gaming Gadgets Market Share and BPS Analysis, By Sales Channel, 2022 & 2032

Figure 69: North America Gaming Gadgets Market Y-o-Y Growth (%) Projections, By Sales Channel, 2022-2032

Figure 70: North America Gaming Gadgets Market Attractiveness, By Sales Channel, 2016-2032

Figure 71: North America Gaming Gadgets Market Value (US$ Mn) Analysis, By Country, 2016-2032

Figure 72: North America Gaming Gadgets Market Volume ('000 Units) Analysis, By Country, 2016-2032

Figure 73: North America Gaming Gadgets Market Share and BPS Analysis, By Country, 2022 & 2032

Figure 74: North America Gaming Gadgets Market Y-o-Y Growth (%) Projections, By Country, 2022-2032

Figure 75: North America Gaming Gadgets Market Attractiveness, By Country, 2016-2032

Figure 76: Latin America Gaming Gadgets Market Value (US$ Mn) Analysis, By Gadget Type, 2016-2032

Figure 77: Latin America Gaming Gadgets Market Volume ('000 Units) Analysis, By Gadget Type, 2016-2032

Figure 78: Latin America Gaming Gadgets Market Share and BPS Analysis, By Gadget Type, 2022 & 2032

Figure 79: Latin America Gaming Gadgets Market Y-o-Y Growth (%) Projections, By Gadget Type, 2022-2032

Figure 80: Latin America Gaming Gadgets Market Attractiveness, By Gadget Type, 2016-2032

Figure 81: Latin America Gaming Gadgets Market Value (US$ Mn) Analysis, By Product Type, 2016-2032

Figure 82: Latin America Gaming Gadgets Market Volume ('000 Units) Analysis, By Product Type, 2016-2032

Figure 83: Latin America Gaming Gadgets Market Share and BPS Analysis, By Product Type, 2022 & 2032

Figure 84: Latin America Gaming Gadgets Market Y-o-Y Growth (%) Projections, By Product Type, 2022-2032

Figure 85: Latin America Gaming Gadgets Market Attractiveness, By Product Type, 2016-2032

Figure 86: Latin America Gaming Gadgets Market Value (US$ Mn) Analysis, By Age Group, 2016-2032

Figure 87: Latin America Gaming Gadgets Market Volume ('000 Units) Analysis, By Age Group, 2016-2032

Figure 88: Latin America Gaming Gadgets Market Share and BPS Analysis, By Age Group, 2022 & 2032

Figure 89: Latin America Gaming Gadgets Market Y-o-Y Growth (%) Projections, By Age Group, 2022-2032

Figure 90: Latin America Gaming Gadgets Market Attractiveness, By Age Group, 2016-2032

Figure 91: Latin America Gaming Gadgets Market Value (US$ Mn) Analysis, By End Use, 2016-2032

Figure 92: Latin America Gaming Gadgets Market Volume ('000 Units) Analysis, By End Use, 2016-2032

Figure 93: Latin America Gaming Gadgets Market Share and BPS Analysis, By End Use, 2022 & 2032

Figure 94: Latin America Gaming Gadgets Market Y-o-Y Growth (%) Projections, By End Use, 2022-2032

Figure 95: Latin America Gaming Gadgets Market Attractiveness, By End Use, 2016-2032

Figure 96: Latin America Gaming Gadgets Market Value (US$ Mn) Analysis, By End Use, 2016-2032

Figure 97: Latin America Gaming Gadgets Market Volume ('000 Units) Analysis, By End Use, 2016-2032

Figure 98: Latin America Gaming Gadgets Market Share and BPS Analysis, By End Use, 2022 & 2032

Figure 99: Latin America Gaming Gadgets Market Y-o-Y Growth (%) Projections, By End Use, 2022-2032

Figure 100: Latin America Gaming Gadgets Market Attractiveness, By End Use, 2016-2032

Figure 101: Latin America Gaming Gadgets Market Value (US$ Mn) Analysis, By Sales Channel, 2016-2032

Figure 102: Latin America Gaming Gadgets Market Volume ('000 Units) Analysis, By Sales Channel, 2016-2032

Figure 103: Latin America Gaming Gadgets Market Share and BPS Analysis, By Sales Channel, 2022 & 2032

Figure 104: Latin America Gaming Gadgets Market Y-o-Y Growth (%) Projections, By Sales Channel, 2022-2032

Figure 105: Latin America Gaming Gadgets Market Attractiveness, By Sales Channel, 2016-2032

Figure 106: Latin America Gaming Gadgets Market Value (US$ Mn) Analysis, By Country, 2016-2032

Figure 107: Latin America Gaming Gadgets Market Volume ('000 Units) Analysis, By Country, 2016-2032

Figure 108: Latin America Gaming Gadgets Market Share and BPS Analysis, By Country, 2022 & 2032

Figure 109: Latin America Gaming Gadgets Market Y-o-Y Growth (%) Projections, By Country, 2022-2032

Figure 110: Latin America Gaming Gadgets Market Attractiveness, By Country, 2016-2032

Figure 111: Europe Gaming Gadgets Market Value (US$ Mn) Analysis, By Gadget Type, 2016-2032

Figure 112: Europe Gaming Gadgets Market Volume ('000 Units) Analysis, By Gadget Type, 2016-2032

Figure 113: Europe Gaming Gadgets Market Share and BPS Analysis, By Gadget Type, 2022 & 2032

Figure 114: Europe Gaming Gadgets Market Y-o-Y Growth (%) Projections, By Gadget Type, 2022-2032

Figure 115: Europe Gaming Gadgets Market Attractiveness, By Gadget Type, 2016-2032

Figure 116: Europe Gaming Gadgets Market Value (US$ Mn) Analysis, By Product Type, 2016-2032

Figure 117: Europe Gaming Gadgets Market Volume ('000 Units) Analysis, By Product Type, 2016-2032

Figure 118: Europe Gaming Gadgets Market Share and BPS Analysis, By Product Type, 2022 & 2032

Figure 119: Europe Gaming Gadgets Market Y-o-Y Growth (%) Projections, By Product Type, 2022-2032

Figure 120: Europe Gaming Gadgets Market Attractiveness, By Product Type, 2016-2032

Figure 121: Europe Gaming Gadgets Market Value (US$ Mn) Analysis, By Age Group, 2016-2032

Figure 122: Europe Gaming Gadgets Market Volume ('000 Units) Analysis, By Age Group, 2016-2032

Figure 123: Europe Gaming Gadgets Market Share and BPS Analysis, By Age Group, 2022 & 2032

Figure 124: Europe Gaming Gadgets Market Y-o-Y Growth (%) Projections, By Age Group, 2022-2032

Figure 125: Europe Gaming Gadgets Market Attractiveness, By Age Group, 2016-2032

Figure 126: Europe Gaming Gadgets Market Value (US$ Mn) Analysis, By End Use, 2016-2032

Figure 127: Europe Gaming Gadgets Market Volume ('000 Units) Analysis, By End Use, 2016-2032

Figure 128: Europe Gaming Gadgets Market Share and BPS Analysis, By End Use, 2022 & 2032

Figure 129: Europe Gaming Gadgets Market Y-o-Y Growth (%) Projections, By End Use, 2022-2032

Figure 130: Europe Gaming Gadgets Market Attractiveness, By End Use, 2016-2032

Figure 131: Europe Gaming Gadgets Market Value (US$ Mn) Analysis, By End Use, 2016-2032

Figure 132: Europe Gaming Gadgets Market Volume ('000 Units) Analysis, By End Use, 2016-2032

Figure 133: Europe Gaming Gadgets Market Share and BPS Analysis, By End Use, 2022 & 2032

Figure 134: Europe Gaming Gadgets Market Y-o-Y Growth (%) Projections, By End Use, 2022-2032

Figure 135: Europe Gaming Gadgets Market Attractiveness, By End Use, 2016-2032

Figure 136: Europe Gaming Gadgets Market Value (US$ Mn) Analysis, By Sales Channel, 2016-2032

Figure 137: Europe Gaming Gadgets Market Volume ('000 Units) Analysis, By Sales Channel, 2016-2032

Figure 138: Europe Gaming Gadgets Market Share and BPS Analysis, By Sales Channel, 2022 & 2032

Figure 139: Europe Gaming Gadgets Market Y-o-Y Growth (%) Projections, By Sales Channel, 2022-2032

Figure 140: Europe Gaming Gadgets Market Attractiveness, By Sales Channel, 2016-2032

Figure 141: Europe Gaming Gadgets Market Value (US$ Mn) Analysis, By Country, 2016-2032

Figure 142: Europe Gaming Gadgets Market Volume ('000 Units) Analysis, By Country, 2016-2032

Figure 143: Europe Gaming Gadgets Market Share and BPS Analysis, By Country, 2022 & 2032

Figure 144: Europe Gaming Gadgets Market Y-o-Y Growth (%) Projections, By Country, 2022-2032

Figure 145: Europe Gaming Gadgets Market Attractiveness, By Country, 2016-2032

Figure 146: South Asia Gaming Gadgets Market Value (US$ Mn) Analysis, By Gadget Type, 2016-2032

Figure 147: South Asia Gaming Gadgets Market Volume ('000 Units) Analysis, By Gadget Type, 2016-2032

Figure 148: South Asia Gaming Gadgets Market Share and BPS Analysis, By Gadget Type, 2022 & 2032

Figure 149: South Asia Gaming Gadgets Market Y-o-Y Growth (%) Projections, By Gadget Type, 2022-2032

Figure 150: South Asia Gaming Gadgets Market Attractiveness, By Gadget Type, 2016-2032

Figure 151: South Asia Gaming Gadgets Market Value (US$ Mn) Analysis, By Product Type, 2016-2032

Figure 152: South Asia Gaming Gadgets Market Volume ('000 Units) Analysis, By Product Type, 2016-2032

Figure 153: South Asia Gaming Gadgets Market Share and BPS Analysis, By Product Type, 2022 & 2032

Figure 154: South Asia Gaming Gadgets Market Y-o-Y Growth (%) Projections, By Product Type, 2022-2032

Figure 155: South Asia Gaming Gadgets Market Attractiveness, By Product Type, 2016-2032

Figure 156: South Asia Gaming Gadgets Market Value (US$ Mn) Analysis, By Age Group, 2016-2032

Figure 157: South Asia Gaming Gadgets Market Volume ('000 Units) Analysis, By Age Group, 2016-2032

Figure 158: South Asia Gaming Gadgets Market Share and BPS Analysis, By Age Group, 2022 & 2032

Figure 159: South Asia Gaming Gadgets Market Y-o-Y Growth (%) Projections, By Age Group, 2022-2032

Figure 160: South Asia Gaming Gadgets Market Attractiveness, By Age Group, 2016-2032

Figure 161: South Asia Gaming Gadgets Market Value (US$ Mn) Analysis, By End Use, 2016-2032

Figure 162: South Asia Gaming Gadgets Market Volume ('000 Units) Analysis, By End Use, 2016-2032

Figure 163: South Asia Gaming Gadgets Market Share and BPS Analysis, By End Use, 2022 & 2032

Figure 164: South Asia Gaming Gadgets Market Y-o-Y Growth (%) Projections, By End Use, 2022-2032

Figure 165: South Asia Gaming Gadgets Market Attractiveness, By End Use, 2016-2032

Figure 166: South Asia Gaming Gadgets Market Value (US$ Mn) Analysis, By End Use, 2016-2032

Figure 167: South Asia Gaming Gadgets Market Volume ('000 Units) Analysis, By End Use, 2016-2032

Figure 168: South Asia Gaming Gadgets Market Share and BPS Analysis, By End Use, 2022 & 2032

Figure 169: South Asia Gaming Gadgets Market Y-o-Y Growth (%) Projections, By End Use, 2022-2032

Figure 170: South Asia Gaming Gadgets Market Attractiveness, By End Use, 2016-2032

Figure 171: South Asia Gaming Gadgets Market Value (US$ Mn) Analysis, By Sales Channel, 2016-2032

Figure 172: South Asia Gaming Gadgets Market Volume ('000 Units) Analysis, By Sales Channel, 2016-2032

Figure 173: South Asia Gaming Gadgets Market Share and BPS Analysis, By Sales Channel, 2022 & 2032

Figure 174: South Asia Gaming Gadgets Market Y-o-Y Growth (%) Projections, By Sales Channel, 2022-2032

Figure 175: South Asia Gaming Gadgets Market Attractiveness, By Sales Channel, 2016-2032

Figure 176: South Asia Gaming Gadgets Market Value (US$ Mn) Analysis, By Country, 2016-2032

Figure 177: South Asia Gaming Gadgets Market Volume ('000 Units) Analysis, By Country, 2016-2032

Figure 178: South Asia Gaming Gadgets Market Share and BPS Analysis, By Country, 2022 & 2032

Figure 179: South Asia Gaming Gadgets Market Y-o-Y Growth (%) Projections, By Country, 2022-2032

Figure 180: South Asia Gaming Gadgets Market Attractiveness, By Country, 2016-2032

Figure 181: East Asia Gaming Gadgets Market Value (US$ Mn) Analysis, By Gadget Type, 2016-2032

Figure 182: East Asia Gaming Gadgets Market Volume ('000 Units) Analysis, By Gadget Type, 2016-2032

Figure 183: East Asia Gaming Gadgets Market Share and BPS Analysis, By Gadget Type, 2022 & 2032

Figure 184: East Asia Gaming Gadgets Market Y-o-Y Growth (%) Projections, By Gadget Type, 2022-2032

Figure 185: East Asia Gaming Gadgets Market Attractiveness, By Gadget Type, 2016-2032

Figure 186: East Asia Gaming Gadgets Market Value (US$ Mn) Analysis, By Product Type, 2016-2032

Figure 187: East Asia Gaming Gadgets Market Volume ('000 Units) Analysis, By Product Type, 2016-2032

Figure 188: East Asia Gaming Gadgets Market Share and BPS Analysis, By Product Type, 2022 & 2032

Figure 189: East Asia Gaming Gadgets Market Y-o-Y Growth (%) Projections, By Product Type, 2022-2032

Figure 190: East Asia Gaming Gadgets Market Attractiveness, By Product Type, 2016-2032

Figure 191: East Asia Gaming Gadgets Market Value (US$ Mn) Analysis, By Age Group, 2016-2032

Figure 192: East Asia Gaming Gadgets Market Volume ('000 Units) Analysis, By Age Group, 2016-2032

Figure 193: East Asia Gaming Gadgets Market Share and BPS Analysis, By Age Group, 2022 & 2032

Figure 194: East Asia Gaming Gadgets Market Y-o-Y Growth (%) Projections, By Age Group, 2022-2032

Figure 195: East Asia Gaming Gadgets Market Attractiveness, By Age Group, 2016-2032

Figure 196: East Asia Gaming Gadgets Market Value (US$ Mn) Analysis, By End Use, 2016-2032

Figure 197: East Asia Gaming Gadgets Market Volume ('000 Units) Analysis, By End Use, 2016-2032

Figure 198: East Asia Gaming Gadgets Market Share and BPS Analysis, By End Use, 2022 & 2032

Figure 199: East Asia Gaming Gadgets Market Y-o-Y Growth (%) Projections, By End Use, 2022-2032

Figure 200: East Asia Gaming Gadgets Market Attractiveness, By End Use, 2016-2032

Figure 201: East Asia Gaming Gadgets Market Value (US$ Mn) Analysis, By End Use, 2016-2032

Figure 202: East Asia Gaming Gadgets Market Volume ('000 Units) Analysis, By End Use, 2016-2032

Figure 203: East Asia Gaming Gadgets Market Share and BPS Analysis, By End Use, 2022 & 2032

Figure 204: East Asia Gaming Gadgets Market Y-o-Y Growth (%) Projections, By End Use, 2022-2032

Figure 205: East Asia Gaming Gadgets Market Attractiveness, By End Use, 2016-2032

Figure 206: East Asia Gaming Gadgets Market Value (US$ Mn) Analysis, By Sales Channel, 2016-2032

Figure 207: East Asia Gaming Gadgets Market Volume ('000 Units) Analysis, By Sales Channel, 2016-2032

Figure 208: East Asia Gaming Gadgets Market Share and BPS Analysis, By Sales Channel, 2022 & 2032

Figure 209: East Asia Gaming Gadgets Market Y-o-Y Growth (%) Projections, By Sales Channel, 2022-2032

Figure 210: East Asia Gaming Gadgets Market Attractiveness, By Sales Channel, 2016-2032

Figure 211: East Asia Gaming Gadgets Market Value (US$ Mn) Analysis, By Country, 2016-2032

Figure 212: East Asia Gaming Gadgets Market Volume ('000 Units) Analysis, By Country, 2016-2032

Figure 213: East Asia Gaming Gadgets Market Share and BPS Analysis, By Country, 2022 & 2032

Figure 214: East Asia Gaming Gadgets Market Y-o-Y Growth (%) Projections, By Country, 2022-2032

Figure 215: East Asia Gaming Gadgets Market Attractiveness, By Country, 2016-2032

Figure 216: Oceania Gaming Gadgets Market Value (US$ Mn) Analysis, By Gadget Type, 2016-2032

Figure 217: Oceania Gaming Gadgets Market Volume ('000 Units) Analysis, By Gadget Type, 2016-2032

Figure 218: Oceania Gaming Gadgets Market Share and BPS Analysis, By Gadget Type, 2022 & 2032

Figure 219: Oceania Gaming Gadgets Market Y-o-Y Growth (%) Projections, By Gadget Type, 2022-2032

Figure 220: Oceania Gaming Gadgets Market Attractiveness, By Gadget Type, 2016-2032

Figure 221: Oceania Gaming Gadgets Market Value (US$ Mn) Analysis, By Product Type, 2016-2032

Figure 222: Oceania Gaming Gadgets Market Volume ('000 Units) Analysis, By Product Type, 2016-2032

Figure 223: Oceania Gaming Gadgets Market Share and BPS Analysis, By Product Type, 2022 & 2032

Figure 224: Oceania Gaming Gadgets Market Y-o-Y Growth (%) Projections, By Product Type, 2022-2032

Figure 225: Oceania Gaming Gadgets Market Attractiveness, By Product Type, 2016-2032

Figure 226: Oceania Gaming Gadgets Market Value (US$ Mn) Analysis, By Age Group, 2016-2032

Figure 227: Oceania Gaming Gadgets Market Volume ('000 Units) Analysis, By Age Group, 2016-2032

Figure 228: Oceania Gaming Gadgets Market Share and BPS Analysis, By Age Group, 2022 & 2032

Figure 229: Oceania Gaming Gadgets Market Y-o-Y Growth (%) Projections, By Age Group, 2022-2032

Figure 230: Oceania Gaming Gadgets Market Attractiveness, By Age Group, 2016-2032

Figure 231: Oceania Gaming Gadgets Market Value (US$ Mn) Analysis, By End Use, 2016-2032

Figure 232: Oceania Gaming Gadgets Market Volume ('000 Units) Analysis, By End Use, 2016-2032

Figure 233: Oceania Gaming Gadgets Market Share and BPS Analysis, By End Use, 2022 & 2032

Figure 234: Oceania Gaming Gadgets Market Y-o-Y Growth (%) Projections, By End Use, 2022-2032

Figure 235: Oceania Gaming Gadgets Market Attractiveness, By End Use, 2016-2032

Figure 236: Oceania Gaming Gadgets Market Value (US$ Mn) Analysis, By End Use, 2016-2032

Figure 237: Oceania Gaming Gadgets Market Volume ('000 Units) Analysis, By End Use, 2016-2032

Figure 238: Oceania Gaming Gadgets Market Share and BPS Analysis, By End Use, 2022 & 2032

Figure 239: Oceania Gaming Gadgets Market Y-o-Y Growth (%) Projections, By End Use, 2022-2032

Figure 240: Oceania Gaming Gadgets Market Attractiveness, By End Use, 2016-2032

Figure 241: Oceania Gaming Gadgets Market Value (US$ Mn) Analysis, By Sales Channel, 2016-2032

Figure 242: Oceania Gaming Gadgets Market Volume ('000 Units) Analysis, By Sales Channel, 2016-2032

Figure 243: Oceania Gaming Gadgets Market Share and BPS Analysis, By Sales Channel, 2022 & 2032

Figure 244: Oceania Gaming Gadgets Market Y-o-Y Growth (%) Projections, By Sales Channel, 2022-2032

Figure 245: Oceania Gaming Gadgets Market Attractiveness, By Sales Channel, 2016-2032

Figure 246: Oceania Gaming Gadgets Market Value (US$ Mn) Analysis, By Country, 2016-2032

Figure 247: Oceania Gaming Gadgets Market Volume ('000 Units) Analysis, By Country, 2016-2032

Figure 248: Oceania Gaming Gadgets Market Share and BPS Analysis, By Country, 2022 & 2032

Figure 249: Oceania Gaming Gadgets Market Y-o-Y Growth (%) Projections, By Country, 2022-2032

Figure 250: Oceania Gaming Gadgets Market Attractiveness, By Country, 2016-2032

Figure 251: Middle East and Africa Gaming Gadgets Market Value (US$ Mn) Analysis, By Gadget Type, 2016-2032

Figure 252: Middle East and Africa Gaming Gadgets Market Volume ('000 Units) Analysis, By Gadget Type, 2016-2032

Figure 253: Middle East and Africa Gaming Gadgets Market Share and BPS Analysis, By Gadget Type, 2022 & 2032

Figure 254: Middle East and Africa Gaming Gadgets Market Y-o-Y Growth (%) Projections, By Gadget Type, 2022-2032

Figure 255: Middle East and Africa Gaming Gadgets Market Attractiveness, By Gadget Type, 2016-2032

Figure 256: Middle East and Africa Gaming Gadgets Market Value (US$ Mn) Analysis, By Product Type, 2016-2032

Figure 257: Middle East and Africa Gaming Gadgets Market Volume ('000 Units) Analysis, By Product Type, 2016-2032

Figure 258: Middle East and Africa Gaming Gadgets Market Share and BPS Analysis, By Product Type, 2022 & 2032

Figure 259: Middle East and Africa Gaming Gadgets Market Y-o-Y Growth (%) Projections, By Product Type, 2022-2032

Figure 260: Middle East and Africa Gaming Gadgets Market Attractiveness, By Product Type, 2016-2032

Figure 261: Middle East and Africa Gaming Gadgets Market Value (US$ Mn) Analysis, By Age Group, 2016-2032

Figure 262: Middle East and Africa Gaming Gadgets Market Volume ('000 Units) Analysis, By Age Group, 2016-2032

Figure 263: Middle East and Africa Gaming Gadgets Market Share and BPS Analysis, By Age Group, 2022 & 2032

Figure 264: Middle East and Africa Gaming Gadgets Market Y-o-Y Growth (%) Projections, By Age Group, 2022-2032

Figure 265: Middle East and Africa Gaming Gadgets Market Attractiveness, By Age Group, 2016-2032

Figure 266: Middle East and Africa Gaming Gadgets Market Value (US$ Mn) Analysis, By End Use, 2016-2032

Figure 267: Middle East and Africa Gaming Gadgets Market Volume ('000 Units) Analysis, By End Use, 2016-2032

Figure 268: Middle East and Africa Gaming Gadgets Market Share and BPS Analysis, By End Use, 2022 & 2032

Figure 269: Middle East and Africa Gaming Gadgets Market Y-o-Y Growth (%) Projections, By End Use, 2022-2032

Figure 270: Middle East and Africa Gaming Gadgets Market Attractiveness, By End Use, 2016-2032

Figure 271: Middle East and Africa Gaming Gadgets Market Value (US$ Mn) Analysis, By End Use, 2016-2032

Figure 272: Middle East and Africa Gaming Gadgets Market Volume ('000 Units) Analysis, By End Use, 2016-2032

Figure 273: Middle East and Africa Gaming Gadgets Market Share and BPS Analysis, By End Use, 2022 & 2032

Figure 274: Middle East and Africa Gaming Gadgets Market Y-o-Y Growth (%) Projections, By End Use, 2022-2032

Figure 275: Middle East and Africa Gaming Gadgets Market Attractiveness, By End Use, 2016-2032

Figure 276: Middle East and Africa Gaming Gadgets Market Value (US$ Mn) Analysis, By Sales Channel, 2016-2032

Figure 277: Middle East and Africa Gaming Gadgets Market Volume ('000 Units) Analysis, By Sales Channel, 2016-2032

Figure 278: Middle East and Africa Gaming Gadgets Market Share and BPS Analysis, By Sales Channel, 2022 & 2032

Figure 279: Middle East and Africa Gaming Gadgets Market Y-o-Y Growth (%) Projections, By Sales Channel, 2022-2032

Figure 280: Middle East and Africa Gaming Gadgets Market Attractiveness, By Sales Channel, 2016-2032

Figure 281: Middle East and Africa Gaming Gadgets Market Value (US$ Mn) Analysis, By Country, 2016-2032

Figure 282: Middle East and Africa Gaming Gadgets Market Volume ('000 Units) Analysis, By Country, 2016-2032

Figure 283: Middle East and Africa Gaming Gadgets Market Share and BPS Analysis, By Country, 2022 & 2032

Figure 284: Middle East and Africa Gaming Gadgets Market Y-o-Y Growth (%) Projections, By Country, 2022-2032

Figure 285: Middle East and Africa Gaming Gadgets Market Attractiveness, By Country, 2016-2032

Recommendations

Consumer Product

Gaming Laptop Market

Published : October 2023

Technology

Gaming Hardware Market

Published : August 2023

Technology

Gaming Monitors Market

Published : March 2023

Technology

Wearable Gaming Technology Market

Published : July 2022

Explore Consumer Product Insights

View Reports