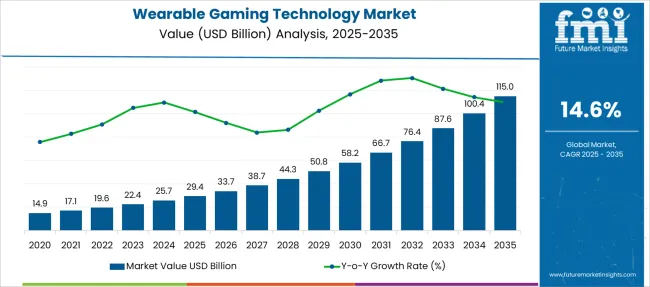
[342 Pages Report] The global wearable gaming technology market holds a share of USD 19,560 million in 2022 and is likely to surpass USD 76,421 million by 2032. The market is advancing at a CAGR of 14.6% during the forecast period.
The gaming industry is one of the fastest evolving sectors across the globe. The development in the industry has remained at par with current technology trends. Wearable gaming technology is also one of the key innovations in the gaming industry that has significantly pushed the market growth to new levels.
Report Attribute | Details |
---|---|
Wearable Gaming Technology Market Value (2022) | USD 19,560 million |
Wearable Gaming Technology Market Anticipated Forecast Value (2032) | USD 76,421 million |
Wearable Gaming Technology Market Projected Growth Rate (2022 to 2032) | 14.6% |
The technology provides consumers with an ultimate gaming experience by allowing them to intensively engage in digital games. The fully immersive experience created through virtual and augmented reality is the key factor enabling wearable gaming technology market growth.
The gaming industry is one of the most visible evidence that technology is developing at a rapid pace. Due to technological advancements in gaming, the industry has shifted from hand-held gaming devices to mobile devices. Gaming consoles are still progressing, and each new development of consoles welcomes a more advanced period of technology and capabilities.
Wearable gaming technology has made games more convenient without being too persistent. Most gamers are interested in technological advancements. In this context, they form a more than interesting target group for the wearable gaming technology market, which is expanding and has large potential.
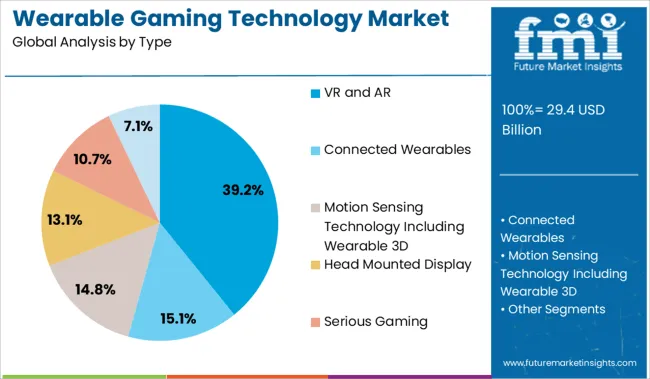
Wearable gaming technology allows players to immerse themselves in their favourite games and allows them to stand up and walk around on the game’s map. In conjunction with virtual reality and augmented reality, wearable gaming technology creates an immersive experience similar to Halo decks.
Global wearable gaming technology has significant potential. Technology advancements and innovation in wearable gaming devices drive the wearable gaming technology market. The rising popularity of series games and virtual reality-based games is fuelling the growth of the wearable gaming technology market.
Additionally, the rise in internet penetration allows gaming companies to deploy their gaming software in the cloud, enabling users with gaming accessories to access their games from anywhere.
Enterprises of large size and start-ups are investing in the wearable gaming technology market, which is helping the market to grow exponentially. Using wearable gaming technology allows gamers to enjoy virtual worlds while moving their bodies in the real world, increasing their physical activity. As digitalization continues to grow, virtual reality has gained momentum in the gaming industry to allow developers and manufacturers to maximize profits and significantly improve customer experiences.
Many large-scale game development companies are leveraging virtual reality to enhance user experiences and drive business value. Rising demand for online video gaming is expected to drive the growth of the wearable gaming technology market.
Piracy is one of the challenges faced by the global wearable gaming technology market. Moreover, the cost associated with the development of gaming wearable devices and software is also high. This makes them available only to a small segment of customers and is thus expected to hamper global wearable gaming technology market growth to some extent during the forecast period.
The high growth potential of the wearable gaming technology market is expected to immerge as virtual reality games can be played on different computing devices including specialized game consoles, standalone systems, advanced laptops and PCs. This is further opening up opportunities for market players to develop more advanced VR headsets to provide gamers with a more immersive experience.
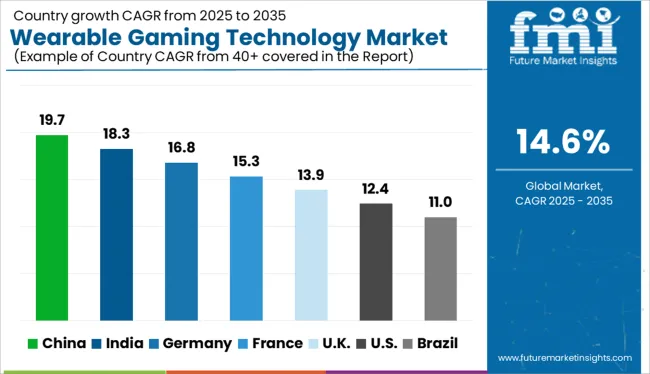
Geographically, the global market for wearable gaming technology is classified into regions namely, North America, Latin America, Western Europe, Eastern Europe, Asia-Pacific, Japan, Middle East and Africa.
The North American region is predicted to hold the largest market for wearable gaming technology. Due to the increasing adoption of advanced wearable gaming accessories, the growing demand for head-mounted displays, cloud computing, gesture tracking devices, and the robust presence of VR-based start-ups, North America is expected to generate the largest revenue share over the forecast period.
North America is estimated to hold a significant share of 30.5% of the wearable gaming technology market witnessing the highest growth. It is expected to take a greater share in the forecast period due to the rising focus on developing haptic-enabled wearables.
Furthermore, growth in the number of gaming hubs and increasing investment to develop advanced wearable gaming accessories are expected to drive the revenue of the North American wearable gaming technology market.
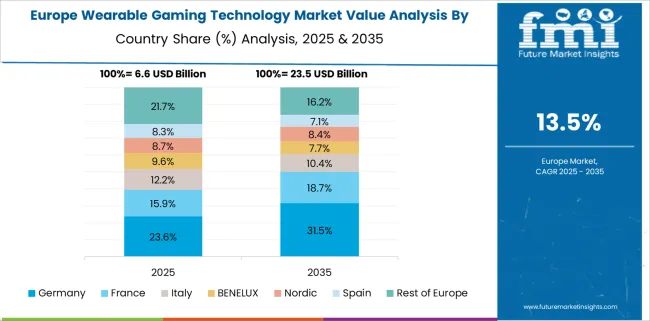
The Europe wearable gaming technology market has a global market share accounting for 21.6%. The region is expected to increase its share during the forecast period as they are fast in the adoption of technology.
A recent boom in the gaming industry has created value-grabbing opportunities for stakeholders in Europe's wearable gaming technology market. Augmented reality (AR) headsets and heart rate monitors are enabling manufacturers to unlock new revenue streams in the gaming industry.
The Asia Pacific region offers lucrative opportunities for key players in the wearable gaming technology market as the region is expected to register the highest growth in terms of revenue during the forecast period.
The rising popularity of casual and hyper-casual games, increasing internet penetration and the increase in the number of smartphone users will be boosting the demand for wearable gaming technology.
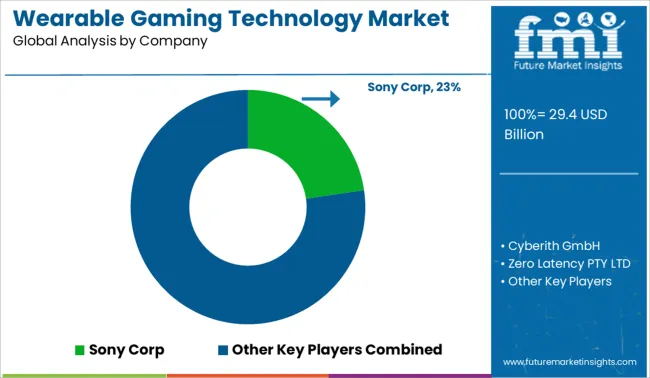
The wearable gaming technology market is very vast and competitive. In terms of share, a few of the key players dominate the market and will continue to dominate for the next decade.
Major companies profiled in the wearable gaming technology market include ICAROS GmbH, Cyberith GmbH, Zero Latency PTY LTD, Avegant Corp, HTC Corporation, Microsoft Corporation, ASUSTeK Computer Inc., Sony Corp, Razer Inc., and Teslasuit.
Report Attribute | Details |
---|---|
Growth Rate | CAGR of 14.6% from 2022 to 2032 |
Base Year for Estimation | 2022 |
Historical Data | 2016 to 2021 |
Forecast Period | 2022 to 2032 |
Quantitative Units | Revenue in USD Million and CAGR from 2022 to 2032 |
Report Coverage | Revenue Forecast, Volume Forecast, Company Ranking, Competitive Landscape, Growth Factors, Trends and Pricing Analysis |
Segments Covered | Device Type, Distribution, Age Group & Region - Forecast till 2032 |
Countries Covered | North America; Europe; APEJ; The Latin America; MEA |
Key Companies Profiled | ICAROS GmbH; Cyberith GmbH; Zero Latency PTY LTD; Avegant Corp; HTC Corporation; Microsoft Corporation; ASUSTeK Computer Inc.; Sony Corp; Razer Inc.; Teslasuit; Others |
Customization | Available Upon Request |
Table 1: Global Wearable Gaming Technology Market Value (US$ Mn) Forecast by Region, 2017-2032
Table 2: Global Wearable Gaming Technology Market Volume (Units) Forecast by Region, 2017-2032
Table 3: Global Wearable Gaming Technology Market Value (US$ Mn) Forecast by Devices, 2017-2032
Table 4: Global Wearable Gaming Technology Market Volume (Units) Forecast by Devices, 2017-2032
Table 5: Global Wearable Gaming Technology Market Value (US$ Mn) Forecast by Distribution Channel, 2017-2032
Table 6: Global Wearable Gaming Technology Market Volume (Units) Forecast by Distribution Channel, 2017-2032
Table 7: Global Wearable Gaming Technology Market Value (US$ Mn) Forecast by Age Group, 2017-2032
Table 8: Global Wearable Gaming Technology Market Volume (Units) Forecast by Age Group, 2017-2032
Table 9: North America Wearable Gaming Technology Market Value (US$ Mn) Forecast by Country, 2017-2032
Table 10: North America Wearable Gaming Technology Market Volume (Units) Forecast by Country, 2017-2032
Table 11: North America Wearable Gaming Technology Market Value (US$ Mn) Forecast by Devices, 2017-2032
Table 12: North America Wearable Gaming Technology Market Volume (Units) Forecast by Devices, 2017-2032
Table 13: North America Wearable Gaming Technology Market Value (US$ Mn) Forecast by Distribution Channel, 2017-2032
Table 14: North America Wearable Gaming Technology Market Volume (Units) Forecast by Distribution Channel, 2017-2032
Table 15: North America Wearable Gaming Technology Market Value (US$ Mn) Forecast by Age Group, 2017-2032
Table 16: North America Wearable Gaming Technology Market Volume (Units) Forecast by Age Group, 2017-2032
Table 17: Latin America Wearable Gaming Technology Market Value (US$ Mn) Forecast by Country, 2017-2032
Table 18: Latin America Wearable Gaming Technology Market Volume (Units) Forecast by Country, 2017-2032
Table 19: Latin America Wearable Gaming Technology Market Value (US$ Mn) Forecast by Devices, 2017-2032
Table 20: Latin America Wearable Gaming Technology Market Volume (Units) Forecast by Devices, 2017-2032
Table 21: Latin America Wearable Gaming Technology Market Value (US$ Mn) Forecast by Distribution Channel, 2017-2032
Table 22: Latin America Wearable Gaming Technology Market Volume (Units) Forecast by Distribution Channel, 2017-2032
Table 23: Latin America Wearable Gaming Technology Market Value (US$ Mn) Forecast by Age Group, 2017-2032
Table 24: Latin America Wearable Gaming Technology Market Volume (Units) Forecast by Age Group, 2017-2032
Table 25: Europe Wearable Gaming Technology Market Value (US$ Mn) Forecast by Country, 2017-2032
Table 26: Europe Wearable Gaming Technology Market Volume (Units) Forecast by Country, 2017-2032
Table 27: Europe Wearable Gaming Technology Market Value (US$ Mn) Forecast by Devices, 2017-2032
Table 28: Europe Wearable Gaming Technology Market Volume (Units) Forecast by Devices, 2017-2032
Table 29: Europe Wearable Gaming Technology Market Value (US$ Mn) Forecast by Distribution Channel, 2017-2032
Table 30: Europe Wearable Gaming Technology Market Volume (Units) Forecast by Distribution Channel, 2017-2032
Table 31: Europe Wearable Gaming Technology Market Value (US$ Mn) Forecast by Age Group, 2017-2032
Table 32: Europe Wearable Gaming Technology Market Volume (Units) Forecast by Age Group, 2017-2032
Table 33: Asia Pacific Wearable Gaming Technology Market Value (US$ Mn) Forecast by Country, 2017-2032
Table 34: Asia Pacific Wearable Gaming Technology Market Volume (Units) Forecast by Country, 2017-2032
Table 35: Asia Pacific Wearable Gaming Technology Market Value (US$ Mn) Forecast by Devices, 2017-2032
Table 36: Asia Pacific Wearable Gaming Technology Market Volume (Units) Forecast by Devices, 2017-2032
Table 37: Asia Pacific Wearable Gaming Technology Market Value (US$ Mn) Forecast by Distribution Channel, 2017-2032
Table 38: Asia Pacific Wearable Gaming Technology Market Volume (Units) Forecast by Distribution Channel, 2017-2032
Table 39: Asia Pacific Wearable Gaming Technology Market Value (US$ Mn) Forecast by Age Group, 2017-2032
Table 40: Asia Pacific Wearable Gaming Technology Market Volume (Units) Forecast by Age Group, 2017-2032
Table 41: MEA Wearable Gaming Technology Market Value (US$ Mn) Forecast by Country, 2017-2032
Table 42: MEA Wearable Gaming Technology Market Volume (Units) Forecast by Country, 2017-2032
Table 43: MEA Wearable Gaming Technology Market Value (US$ Mn) Forecast by Devices, 2017-2032
Table 44: MEA Wearable Gaming Technology Market Volume (Units) Forecast by Devices, 2017-2032
Table 45: MEA Wearable Gaming Technology Market Value (US$ Mn) Forecast by Distribution Channel, 2017-2032
Table 46: MEA Wearable Gaming Technology Market Volume (Units) Forecast by Distribution Channel, 2017-2032
Table 47: MEA Wearable Gaming Technology Market Value (US$ Mn) Forecast by Age Group, 2017-2032
Table 48: MEA Wearable Gaming Technology Market Volume (Units) Forecast by Age Group, 2017-2032
Figure 1: Global Wearable Gaming Technology Market Value (US$ Mn) by Devices, 2022-2032
Figure 2: Global Wearable Gaming Technology Market Value (US$ Mn) by Distribution Channel, 2022-2032
Figure 3: Global Wearable Gaming Technology Market Value (US$ Mn) by Age Group, 2022-2032
Figure 4: Global Wearable Gaming Technology Market Value (US$ Mn) by Region, 2022-2032
Figure 5: Global Wearable Gaming Technology Market Value (US$ Mn) Analysis by Region, 2017-2032
Figure 6: Global Wearable Gaming Technology Market Volume (Units) Analysis by Region, 2017-2032
Figure 7: Global Wearable Gaming Technology Market Value Share (%) and BPS Analysis by Region, 2022-2032
Figure 8: Global Wearable Gaming Technology Market Y-o-Y Growth (%) Projections by Region, 2022-2032
Figure 9: Global Wearable Gaming Technology Market Value (US$ Mn) Analysis by Devices, 2017-2032
Figure 10: Global Wearable Gaming Technology Market Volume (Units) Analysis by Devices, 2017-2032
Figure 11: Global Wearable Gaming Technology Market Value Share (%) and BPS Analysis by Devices, 2022-2032
Figure 12: Global Wearable Gaming Technology Market Y-o-Y Growth (%) Projections by Devices, 2022-2032
Figure 13: Global Wearable Gaming Technology Market Value (US$ Mn) Analysis by Distribution Channel, 2017-2032
Figure 14: Global Wearable Gaming Technology Market Volume (Units) Analysis by Distribution Channel, 2017-2032
Figure 15: Global Wearable Gaming Technology Market Value Share (%) and BPS Analysis by Distribution Channel, 2022-2032
Figure 16: Global Wearable Gaming Technology Market Y-o-Y Growth (%) Projections by Distribution Channel, 2022-2032
Figure 17: Global Wearable Gaming Technology Market Value (US$ Mn) Analysis by Age Group, 2017-2032
Figure 18: Global Wearable Gaming Technology Market Volume (Units) Analysis by Age Group, 2017-2032
Figure 19: Global Wearable Gaming Technology Market Value Share (%) and BPS Analysis by Age Group, 2022-2032
Figure 20: Global Wearable Gaming Technology Market Y-o-Y Growth (%) Projections by Age Group, 2022-2032
Figure 21: Global Wearable Gaming Technology Market Attractiveness by Devices, 2022-2032
Figure 22: Global Wearable Gaming Technology Market Attractiveness by Distribution Channel, 2022-2032
Figure 23: Global Wearable Gaming Technology Market Attractiveness by Age Group, 2022-2032
Figure 24: Global Wearable Gaming Technology Market Attractiveness by Region, 2022-2032
Figure 25: North America Wearable Gaming Technology Market Value (US$ Mn) by Devices, 2022-2032
Figure 26: North America Wearable Gaming Technology Market Value (US$ Mn) by Distribution Channel, 2022-2032
Figure 27: North America Wearable Gaming Technology Market Value (US$ Mn) by Age Group, 2022-2032
Figure 28: North America Wearable Gaming Technology Market Value (US$ Mn) by Country, 2022-2032
Figure 29: North America Wearable Gaming Technology Market Value (US$ Mn) Analysis by Country, 2017-2032
Figure 30: North America Wearable Gaming Technology Market Volume (Units) Analysis by Country, 2017-2032
Figure 31: North America Wearable Gaming Technology Market Value Share (%) and BPS Analysis by Country, 2022-2032
Figure 32: North America Wearable Gaming Technology Market Y-o-Y Growth (%) Projections by Country, 2022-2032
Figure 33: North America Wearable Gaming Technology Market Value (US$ Mn) Analysis by Devices, 2017-2032
Figure 34: North America Wearable Gaming Technology Market Volume (Units) Analysis by Devices, 2017-2032
Figure 35: North America Wearable Gaming Technology Market Value Share (%) and BPS Analysis by Devices, 2022-2032
Figure 36: North America Wearable Gaming Technology Market Y-o-Y Growth (%) Projections by Devices, 2022-2032
Figure 37: North America Wearable Gaming Technology Market Value (US$ Mn) Analysis by Distribution Channel, 2017-2032
Figure 38: North America Wearable Gaming Technology Market Volume (Units) Analysis by Distribution Channel, 2017-2032
Figure 39: North America Wearable Gaming Technology Market Value Share (%) and BPS Analysis by Distribution Channel, 2022-2032
Figure 40: North America Wearable Gaming Technology Market Y-o-Y Growth (%) Projections by Distribution Channel, 2022-2032
Figure 41: North America Wearable Gaming Technology Market Value (US$ Mn) Analysis by Age Group, 2017-2032
Figure 42: North America Wearable Gaming Technology Market Volume (Units) Analysis by Age Group, 2017-2032
Figure 43: North America Wearable Gaming Technology Market Value Share (%) and BPS Analysis by Age Group, 2022-2032
Figure 44: North America Wearable Gaming Technology Market Y-o-Y Growth (%) Projections by Age Group, 2022-2032
Figure 45: North America Wearable Gaming Technology Market Attractiveness by Devices, 2022-2032
Figure 46: North America Wearable Gaming Technology Market Attractiveness by Distribution Channel, 2022-2032
Figure 47: North America Wearable Gaming Technology Market Attractiveness by Age Group, 2022-2032
Figure 48: North America Wearable Gaming Technology Market Attractiveness by Country, 2022-2032
Figure 49: Latin America Wearable Gaming Technology Market Value (US$ Mn) by Devices, 2022-2032
Figure 50: Latin America Wearable Gaming Technology Market Value (US$ Mn) by Distribution Channel, 2022-2032
Figure 51: Latin America Wearable Gaming Technology Market Value (US$ Mn) by Age Group, 2022-2032
Figure 52: Latin America Wearable Gaming Technology Market Value (US$ Mn) by Country, 2022-2032
Figure 53: Latin America Wearable Gaming Technology Market Value (US$ Mn) Analysis by Country, 2017-2032
Figure 54: Latin America Wearable Gaming Technology Market Volume (Units) Analysis by Country, 2017-2032
Figure 55: Latin America Wearable Gaming Technology Market Value Share (%) and BPS Analysis by Country, 2022-2032
Figure 56: Latin America Wearable Gaming Technology Market Y-o-Y Growth (%) Projections by Country, 2022-2032
Figure 57: Latin America Wearable Gaming Technology Market Value (US$ Mn) Analysis by Devices, 2017-2032
Figure 58: Latin America Wearable Gaming Technology Market Volume (Units) Analysis by Devices, 2017-2032
Figure 59: Latin America Wearable Gaming Technology Market Value Share (%) and BPS Analysis by Devices, 2022-2032
Figure 60: Latin America Wearable Gaming Technology Market Y-o-Y Growth (%) Projections by Devices, 2022-2032
Figure 61: Latin America Wearable Gaming Technology Market Value (US$ Mn) Analysis by Distribution Channel, 2017-2032
Figure 62: Latin America Wearable Gaming Technology Market Volume (Units) Analysis by Distribution Channel, 2017-2032
Figure 63: Latin America Wearable Gaming Technology Market Value Share (%) and BPS Analysis by Distribution Channel, 2022-2032
Figure 64: Latin America Wearable Gaming Technology Market Y-o-Y Growth (%) Projections by Distribution Channel, 2022-2032
Figure 65: Latin America Wearable Gaming Technology Market Value (US$ Mn) Analysis by Age Group, 2017-2032
Figure 66: Latin America Wearable Gaming Technology Market Volume (Units) Analysis by Age Group, 2017-2032
Figure 67: Latin America Wearable Gaming Technology Market Value Share (%) and BPS Analysis by Age Group, 2022-2032
Figure 68: Latin America Wearable Gaming Technology Market Y-o-Y Growth (%) Projections by Age Group, 2022-2032
Figure 69: Latin America Wearable Gaming Technology Market Attractiveness by Devices, 2022-2032
Figure 70: Latin America Wearable Gaming Technology Market Attractiveness by Distribution Channel, 2022-2032
Figure 71: Latin America Wearable Gaming Technology Market Attractiveness by Age Group, 2022-2032
Figure 72: Latin America Wearable Gaming Technology Market Attractiveness by Country, 2022-2032
Figure 73: Europe Wearable Gaming Technology Market Value (US$ Mn) by Devices, 2022-2032
Figure 74: Europe Wearable Gaming Technology Market Value (US$ Mn) by Distribution Channel, 2022-2032
Figure 75: Europe Wearable Gaming Technology Market Value (US$ Mn) by Age Group, 2022-2032
Figure 76: Europe Wearable Gaming Technology Market Value (US$ Mn) by Country, 2022-2032
Figure 77: Europe Wearable Gaming Technology Market Value (US$ Mn) Analysis by Country, 2017-2032
Figure 78: Europe Wearable Gaming Technology Market Volume (Units) Analysis by Country, 2017-2032
Figure 79: Europe Wearable Gaming Technology Market Value Share (%) and BPS Analysis by Country, 2022-2032
Figure 80: Europe Wearable Gaming Technology Market Y-o-Y Growth (%) Projections by Country, 2022-2032
Figure 81: Europe Wearable Gaming Technology Market Value (US$ Mn) Analysis by Devices, 2017-2032
Figure 82: Europe Wearable Gaming Technology Market Volume (Units) Analysis by Devices, 2017-2032
Figure 83: Europe Wearable Gaming Technology Market Value Share (%) and BPS Analysis by Devices, 2022-2032
Figure 84: Europe Wearable Gaming Technology Market Y-o-Y Growth (%) Projections by Devices, 2022-2032
Figure 85: Europe Wearable Gaming Technology Market Value (US$ Mn) Analysis by Distribution Channel, 2017-2032
Figure 86: Europe Wearable Gaming Technology Market Volume (Units) Analysis by Distribution Channel, 2017-2032
Figure 87: Europe Wearable Gaming Technology Market Value Share (%) and BPS Analysis by Distribution Channel, 2022-2032
Figure 88: Europe Wearable Gaming Technology Market Y-o-Y Growth (%) Projections by Distribution Channel, 2022-2032
Figure 89: Europe Wearable Gaming Technology Market Value (US$ Mn) Analysis by Age Group, 2017-2032
Figure 90: Europe Wearable Gaming Technology Market Volume (Units) Analysis by Age Group, 2017-2032
Figure 91: Europe Wearable Gaming Technology Market Value Share (%) and BPS Analysis by Age Group, 2022-2032
Figure 92: Europe Wearable Gaming Technology Market Y-o-Y Growth (%) Projections by Age Group, 2022-2032
Figure 93: Europe Wearable Gaming Technology Market Attractiveness by Devices, 2022-2032
Figure 94: Europe Wearable Gaming Technology Market Attractiveness by Distribution Channel, 2022-2032
Figure 95: Europe Wearable Gaming Technology Market Attractiveness by Age Group, 2022-2032
Figure 96: Europe Wearable Gaming Technology Market Attractiveness by Country, 2022-2032
Figure 97: Asia Pacific Wearable Gaming Technology Market Value (US$ Mn) by Devices, 2022-2032
Figure 98: Asia Pacific Wearable Gaming Technology Market Value (US$ Mn) by Distribution Channel, 2022-2032
Figure 99: Asia Pacific Wearable Gaming Technology Market Value (US$ Mn) by Age Group, 2022-2032
Figure 100: Asia Pacific Wearable Gaming Technology Market Value (US$ Mn) by Country, 2022-2032
Figure 101: Asia Pacific Wearable Gaming Technology Market Value (US$ Mn) Analysis by Country, 2017-2032
Figure 102: Asia Pacific Wearable Gaming Technology Market Volume (Units) Analysis by Country, 2017-2032
Figure 103: Asia Pacific Wearable Gaming Technology Market Value Share (%) and BPS Analysis by Country, 2022-2032
Figure 104: Asia Pacific Wearable Gaming Technology Market Y-o-Y Growth (%) Projections by Country, 2022-2032
Figure 105: Asia Pacific Wearable Gaming Technology Market Value (US$ Mn) Analysis by Devices, 2017-2032
Figure 106: Asia Pacific Wearable Gaming Technology Market Volume (Units) Analysis by Devices, 2017-2032
Figure 107: Asia Pacific Wearable Gaming Technology Market Value Share (%) and BPS Analysis by Devices, 2022-2032
Figure 108: Asia Pacific Wearable Gaming Technology Market Y-o-Y Growth (%) Projections by Devices, 2022-2032
Figure 109: Asia Pacific Wearable Gaming Technology Market Value (US$ Mn) Analysis by Distribution Channel, 2017-2032
Figure 110: Asia Pacific Wearable Gaming Technology Market Volume (Units) Analysis by Distribution Channel, 2017-2032
Figure 111: Asia Pacific Wearable Gaming Technology Market Value Share (%) and BPS Analysis by Distribution Channel, 2022-2032
Figure 112: Asia Pacific Wearable Gaming Technology Market Y-o-Y Growth (%) Projections by Distribution Channel, 2022-2032
Figure 113: Asia Pacific Wearable Gaming Technology Market Value (US$ Mn) Analysis by Age Group, 2017-2032
Figure 114: Asia Pacific Wearable Gaming Technology Market Volume (Units) Analysis by Age Group, 2017-2032
Figure 115: Asia Pacific Wearable Gaming Technology Market Value Share (%) and BPS Analysis by Age Group, 2022-2032
Figure 116: Asia Pacific Wearable Gaming Technology Market Y-o-Y Growth (%) Projections by Age Group, 2022-2032
Figure 117: Asia Pacific Wearable Gaming Technology Market Attractiveness by Devices, 2022-2032
Figure 118: Asia Pacific Wearable Gaming Technology Market Attractiveness by Distribution Channel, 2022-2032
Figure 119: Asia Pacific Wearable Gaming Technology Market Attractiveness by Age Group, 2022-2032
Figure 120: Asia Pacific Wearable Gaming Technology Market Attractiveness by Country, 2022-2032
Figure 121: MEA Wearable Gaming Technology Market Value (US$ Mn) by Devices, 2022-2032
Figure 122: MEA Wearable Gaming Technology Market Value (US$ Mn) by Distribution Channel, 2022-2032
Figure 123: MEA Wearable Gaming Technology Market Value (US$ Mn) by Age Group, 2022-2032
Figure 124: MEA Wearable Gaming Technology Market Value (US$ Mn) by Country, 2022-2032
Figure 125: MEA Wearable Gaming Technology Market Value (US$ Mn) Analysis by Country, 2017-2032
Figure 126: MEA Wearable Gaming Technology Market Volume (Units) Analysis by Country, 2017-2032
Figure 127: MEA Wearable Gaming Technology Market Value Share (%) and BPS Analysis by Country, 2022-2032
Figure 128: MEA Wearable Gaming Technology Market Y-o-Y Growth (%) Projections by Country, 2022-2032
Figure 129: MEA Wearable Gaming Technology Market Value (US$ Mn) Analysis by Devices, 2017-2032
Figure 130: MEA Wearable Gaming Technology Market Volume (Units) Analysis by Devices, 2017-2032
Figure 131: MEA Wearable Gaming Technology Market Value Share (%) and BPS Analysis by Devices, 2022-2032
Figure 132: MEA Wearable Gaming Technology Market Y-o-Y Growth (%) Projections by Devices, 2022-2032
Figure 133: MEA Wearable Gaming Technology Market Value (US$ Mn) Analysis by Distribution Channel, 2017-2032
Figure 134: MEA Wearable Gaming Technology Market Volume (Units) Analysis by Distribution Channel, 2017-2032
Figure 135: MEA Wearable Gaming Technology Market Value Share (%) and BPS Analysis by Distribution Channel, 2022-2032
Figure 136: MEA Wearable Gaming Technology Market Y-o-Y Growth (%) Projections by Distribution Channel, 2022-2032
Figure 137: MEA Wearable Gaming Technology Market Value (US$ Mn) Analysis by Age Group, 2017-2032
Figure 138: MEA Wearable Gaming Technology Market Volume (Units) Analysis by Age Group, 2017-2032
Figure 139: MEA Wearable Gaming Technology Market Value Share (%) and BPS Analysis by Age Group, 2022-2032
Figure 140: MEA Wearable Gaming Technology Market Y-o-Y Growth (%) Projections by Age Group, 2022-2032
Figure 141: MEA Wearable Gaming Technology Market Attractiveness by Devices, 2022-2032
Figure 142: MEA Wearable Gaming Technology Market Attractiveness by Distribution Channel, 2022-2032
Figure 143: MEA Wearable Gaming Technology Market Attractiveness by Age Group, 2022-2032
Figure 144: MEA Wearable Gaming Technology Market Attractiveness by Country, 2022-2032
The growth potential of the wearable gaming technology market can value at USD 76,421 Million by 2032.
The wearable gaming technology market is expected to grow at a CAGR of 14.6% from 2022 to 2032.
The market size of the global wearable gaming technology market is projected to grow by USD 19,560 million in 2022.
North America is expected to hold the highest share in the global wearable gaming technology market.
Explore Similar Insights
Thank you!
You will receive an email from our Business Development Manager. Please be sure to check your SPAM/JUNK folder too.