Wearable Beauty Market Analysis and Forecast for 2025–2035

The wearable beauty market is expected to record a valuation of USD 2,785.4 million in 2025 and USD 9,745.2 million in 2035, with an increase of USD 5,334.5 million, which equals a growth of 211% over the decade. The overall expansion represents a CAGR of 13.3% and more than a 3X increase in market size.
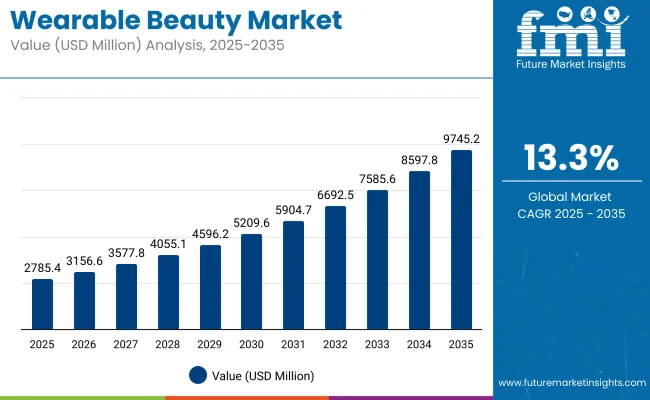
Quick Stats for Wearable Beauty Market

  • Wearable Beauty Market Value (2025): USD 2,785.4 million
  • Wearable Beauty Market Forecast Value (2035): USD 9,745.2 million
  • Wearable Beauty Market Forecast CAGR: 13.3%
  • Leading Segment in Wearable Beauty Market in 2025: LED Light Therapy Masks (28.5%)
  • Key Growth Regions in the Wearable Beauty Market: North America, Asia-Pacific, Europe
  • Top Key Players in the Wearable Beauty Market: L’Oréal Group, MTG Co., Ltd. (ReFa brand), Foreo, CurrentBody, Shiseido Company, Limited, Amorepacific Corporation, Procter & Gamble (Olay, Neutrogena), Beurer GmbH, Unilever, and Lancer Skincare.

Wearable Beauty Market

Wearable Beauty Market Key Takeaways

Metric Value
Market Estimated Value in (2025E) USD 2,785.4 million
Forecast Value in (2035F) USD 9,745.2 million
Forecast CAGR (2025 to 2035) 13.3%

During the first five-year period from 2025 to 2030, the market increases from USD 2,785.4 million to approximately USD 5,209.6 million, adding USD 1,834.5 million, which accounts for 34.4% of the total decade growth. This phase records steady adoption of LED masks, micro current devices, and hydration sensors, driven by the demand for personalized skincare, anti-aging benefits, and at-home dermatological-grade experiences. LED light therapy masks dominate this period, capturing over 38% share in the USA, with strong traction in China and Europe.

The second half from 2030 to 2035 contributes a larger share of USD 3,500 million, equal to 65.6% of total growth, as the market jumps from USD 5,209.6 million to USD 9,745.3million. This acceleration is powered by mass deployment of AI-integrated skin analysis, cloud-synced hydration tracking, and app-based light therapy regimens.

Light-based technologies (Red, Blue, NIR LEDs) secure over 52.7% share in China, while global consumers increasingly shift toward full-face, multi-modal devices offering both diagnostics and treatment. Emerging premium players and cloud-linked subscription services begin to boost the recurring value of software-backed platforms, gradually increasing the software and smart connectivity share in total revenue contribution.

From 2020 to 2024, the wearable beauty market grew from USD 1,430 million to USD 2,140 million, driven by hardware-centric adoption of LED masks, microcurrent devices, and sonic cleansers. During this period, the competitive landscape was dominated by beauty device manufacturers, who controlled nearly 85% of total revenue, with leaders such as L’Oréal Group, MTG Co., Ltd. (ReFa), and Foreo focusing on premium facial technology for anti-aging and skin rejuvenation.

Competitive differentiation relied on device quality, skincare efficacy, and consumer design, while software and companion apps were typically bundled as secondary features rather than core revenue drivers. Subscription-based skincare services and analytics platforms had minimal traction, contributing less than 8% of the total market value.

Demand for wearable beauty devices is forecast to reach USD 2,785.4 million in 2025, and the revenue mix will begin shifting as software and services expand to over 18% share. Traditional hardware leaders face rising competition from digital-first entrants offering AI-powered skin diagnostics, app-linked hydration sensors, and cloud-synced treatment routines.

Established manufacturers are pivoting toward hybrid models that integrate real-time feedback, remote dermatologist connectivity, and usage analytics to maintain brand relevance. New entrants specializing in connected skincare ecosystems, AR-based mirror interfaces, and subscription-based beauty routines are capturing share, particularly among Gen Z and tech-native consumers. The competitive edge is moving away from standalone device innovation toward ecosystem integration, data intelligence, and recurring engagement models.

Why the Wearable Beauty Market is growing?

The wearable beauty market is being propelled by the medicalization of beauty and the increasing consumer preference for quantifiable skincare outcomes. Unlike traditional cosmetic products that rely on subjective perception, wearable beauty devices enable objective tracking of skin parameters such as hydration, elasticity, melanin levels, and temperature. This shift is resonating particularly in regions where dermatological literacy is increasing, and consumers are becoming more aligned with clinical-grade, measurable beauty standards.

Wearable beauty technology is also filling the gap between cosmetic dermatology and daily self-care by providing users with professional-grade insights without the need for clinic visits. This fusion of dermatology and beauty is being actively monetized by brands developing diagnostic-led beauty ecosystems with longitudinal skin tracking, making these devices part of preventive skincare strategies rather than just aesthetic enhancement.

In parallel, the growth of closed-loop ecosystems across the beauty tech landscape is reshaping consumer engagement. Several beauty-tech brands are building proprietary ecosystems where the wearable device is just one component of a broader diagnostic and product delivery platform. These systems are designed to lock in users by combining personalized diagnostics, digital coaching, device usage analytics, and subscription-based cosmetic refills based on real-time feedback.

As a result, brands are increasingly focusing on customer lifetime value and ecosystem stickiness rather than one-time device sales. This evolution is reinforcing recurring revenue models and increasing investor interest, which in turn is fueling R&D budgets and rapid innovation. In this context, market expansion is being driven not just by product innovation, but by the strategic redesign of how skincare is delivered, measured, and monetized.

Segmental Analysis

The Wearable Beauty Market is segmented by product type, sensor & technology, Application, end user, and distribution channel. Product types include LED light therapy masks, microcurrent facial devices, sonic cleansing devices & massagers, and hair growth helmets or bands (laser or LED-based), each addressing distinct skincare and haircare needs through home-use, non-invasive innovations.

Sensor and technology segmentation encompasses hydration sensors and skin moisture trackers, UV sensors, and light-based technologies such as red, blue, and near-infrared (NIR) LEDs, which enable real-time diagnostics and adaptive skincare responses. Applications span anti-aging and wrinkle reduction, skin tightening and firming, and acne treatment through blue light or pH-based technologies, supporting a broad demographic from teens to aging populations.

End users are classified into general consumers, professional users such as dermatologists and spa practitioners, and pharmacy or drug store buyers, reflecting a mix of personal care, clinical integration, and OTC accessibility. Distribution channels include both e-commerce platforms and offline retail stores, with online channels offering convenience and algorithmic personalization, while physical outlets provide credibility, experiential trials, and impulse engagement through pharmacies, clinics, and specialty beauty stores.

Regionally, North America and East Asia are dominant markets driven by early tech adoption and skincare-conscious populations, while Europe follows closely with growing demand across premium beauty segments. Meanwhile, South Asia & Pacific and parts of Latin America are emerging as high-potential regions due to increased access to affordable devices and mobile-based beauty solutions.
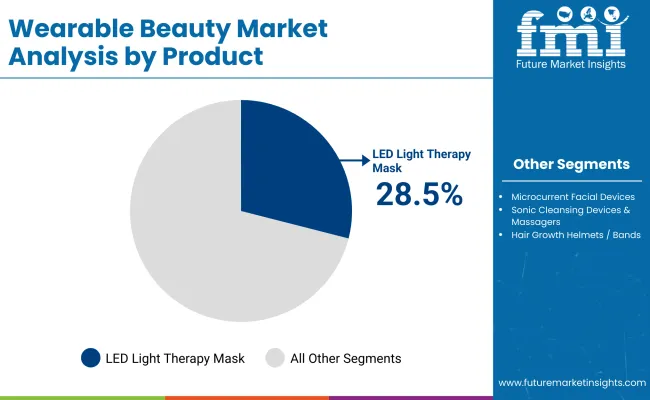
Insights into the Product Type Segment with LED Light Therapy MasksLeading in Market Share

Wearable Beauty Market By Product

By Product Type Value Share% 2025
LED Light Therapy Masks 28.5%
Others 71.5%

In the wearable beauty market, LED light therapy masks are estimated to command the highest product type share at 28.5% in 2025. This strong uptake is being driven by the growing acceptance of multi-spectrum light technologies in at-home skincare, particularly among consumers targeting visible skin rejuvenation and inflammation reduction.

The segment has gained prominence due to its perceived alignment with clinical dermatology protocols and its non-invasive nature. Compared to sonic cleansing devices or microcurrent facial tools, LED masks are being increasingly perceived as offering more holistic anti-aging benefits through red, blue, and near-infrared wavelengths that penetrate varying skin depths.

The convenience of hands-free application and the ability to incorporate treatment into daily routines has positioned these devices as a preferred choice, especially among time-constrained urban users. Moreover, the integration of features such as smart timers, app connectivity, and dermatologist-approved wavelength settings has enhanced product credibility, prompting wider uptake through both direct-to-consumer platforms and premium beauty retail channels.

While the “Others” category remains fragmented across diverse formats like microcurrent facial devices and hair regrowth bands, the market’s preference is increasingly being concentrated toward LED masks due to their perceived multi-functional efficacy and lower need for user technique proficiency.
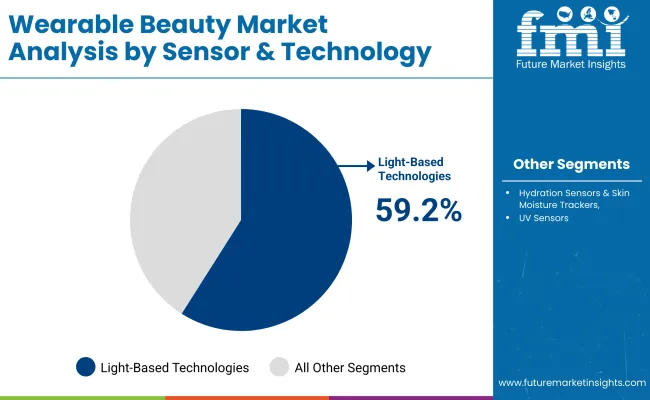
Insights into the Sensor & Technology Segment with Light-Based Technologies (Red, Blue, NIR LEDs) Dominating the Demand

Wearable Beauty Market By Sensor

By Sensor & Technology Value Share% 2025
Light-Based Technologies (Red, Blue, NIR LEDs) 59.2%
Others 40.8%

Light-based technologies, including red, blue, and near-infrared (NIR) LEDs, are projected to account for a dominant 59.2% share of the global wearable beauty market by sensor and technology in 2025. The popularity of these solutions is being reinforced by their ability to target multiple skin concerns simultaneouslysuch as acne, fine lines, inflammation, and dullnesswithout requiring invasive treatment or consumables.

These devices are increasingly seen as an accessible extension of in-office dermatology protocols, with many brands offering tailored wavelengths for specific issues. Their growing application in both facial and scalp devices further enhances their functional appeal across gender and age demographics.

The consumer preference for sensor-driven yet non-mechanical solutions is also contributing to the rise of light-based technologies. Compared to vibration-based or thermal sensors, LED-based modules offer a longer product lifecycle and deliver visible results with minimal physical interaction, which aligns with hygiene-conscious and touch-free skincare trends.

Additionally, improved energy efficiency, lower heat output, and programmable settings make these technologies well-suited for wearable formats. The “Others” segment, while sizable at 40.8%, includes electrostimulation, biosensors, and micro-needling integrations that often require more specialized usage or post-care protocols, limiting their adoption in mainstream personal care routines.

Insights into the Application Segment with Focus on Anti-Aging and Wrinkle Reduction

By Application Value Share% 2025
Anti-Aging and Wrinkle Reduction 37.3%
Others 62.7%

Anti-aging and wrinkle reduction applications are anticipated to capture 37.3% of the wearable beauty devices market in 2025, marking them as the most commercially significant application segment. This prominence reflects strong consumer demand for visible, non-invasive rejuvenation solutions as part of preventive and corrective skincare routines.

The integration of LED, EMS (electrical muscle stimulation), and microcurrent technologies in wearables has allowed for enhanced collagen stimulation and improved skin elasticity, making these devices highly desirable across both younger and aging consumer bases seeking to delay or reverse age-related changes.

Despite the wide array of multifunctional beauty devices in the market, anti-aging features continue to be prioritized during product development, marketing, and consumer decision-making. The remaining 62.7% share is distributed among acne treatment, pigmentation correction, hydration, skin tightening, and other emerging applications. However, many of these functionalities are often bundled into devices primarily marketed for anti-aging.

What are the Drivers, Restraints, and Key Trends of the Wearable Beauty Market?

Integration with Dermatologist-Approved Diagnostic Ecosystems

Dermatology-grade validation has increasingly influenced the credibility of wearable beauty devices since 2023. Companies are now collaborating with clinical dermatology labs and certified skin clinics to offer users professional-grade diagnostics through mobile apps paired with smart sensors. These integrations are boosting consumer trust in the effectiveness of wearable skincare devices, especially those that use microcurrent, red-light therapy, and hydration-level detection.

Many brands have been observed offering tele-dermatology consultations synced with their beauty wearables, enabling customers to receive AI-supported regimens tailored to real-time skin diagnostics. This clinical alignment is reducing skepticism around high-tech beauty gadgets and has opened pathways for inclusion in dermatology treatment plans. The market's credibility boost through medical integration is thus serving as a significant growth lever, particularly among middle-aged consumers and those with chronic skin conditions like rosacea or hyperpigmentation.

Growing Affinity for Data-Centric Skin Health Optimization

Between 2023 and 2025, consumers have increasingly treated skin health as a data-driven pursuit rather than a cosmetic goal. Smart sensors embedded in wearable devices now provide granular feedback on factors like moisture retention, skin temperature, UV exposure, and pH balance. This biofeedback loop is particularly valued by consumers who are tech-savvy and motivated to track their progress with quantified insights.

The surge in beauty-focused apps that gamify skincare habits or generate daily skin health scores based on wearable inputs has turned skincare into an interactive, personalized journey. Rather than depending solely on product marketing, consumers are making decisions based on real-time results from their own skin data. This behavioral shift is influencing both demand and engagement, as consumers are now investing in wearables that offer longitudinal insights into how lifestyle, environment, and products are affecting their skin condition.

Limited Battery Life and Usability Constraints in Daily Routines

One of the critical hurdles for mass adoption of wearable beauty tech has been usability friction, particularly stemming from power limitations and wearability discomfort. Devices such as LED therapy masks, ultrasonic toning wearables, or hydration patches often require multiple charging sessions per week, which can disrupt daily skincare routines. In urban regions where consumers already juggle multiple smart devices, the friction caused by needing to charge another accessory has been resulting in declining usage post initial excitement.

Additionally, for certain product categories like microcurrent facial tools or jawline-enhancing wearables, long wear durations or restrictive designs reduce comfort, especially for multitasking users. Between 2023 and 2025, consumer reviews and product return data reflect dissatisfaction with devices that require extensive setup, cannot withstand water exposure, or do not seamlessly integrate into morning and evening routines. This challenge continues to impact product stickiness and long-term retention.

Hybridization of Beauty Wearables with Wellness and Mental Health Functions

A notable trend between 2023 and 2025 has been the convergence of beauty wearables with wellness and emotional health monitoring. Devices traditionally focused on skin appearance are now being hybridized to track stress levels via galvanic skin response, temperature fluctuations, and cortisol-detection patches. Wearable beauty masks, for instance, have started incorporating blue-light therapy and aromatherapy modules aimed at both cosmetic results and stress reduction.

This hybrid positioning appeals strongly to millennial and Gen Z demographics seeking holistic well-being alongside aesthetic enhancement. The intersection of beauty and mindfulness has been prominently marketed in Asia-Pacific and Western Europe, where consumer inclination toward de-stressing rituals overlaps with beauty regimens. Wearables that offer guided meditation while running LED treatments or facial toning routines have especially gained traction. The emotional wellness angle is thus emerging as a dual-purpose differentiator in a market that previously focused solely on physical appearance.
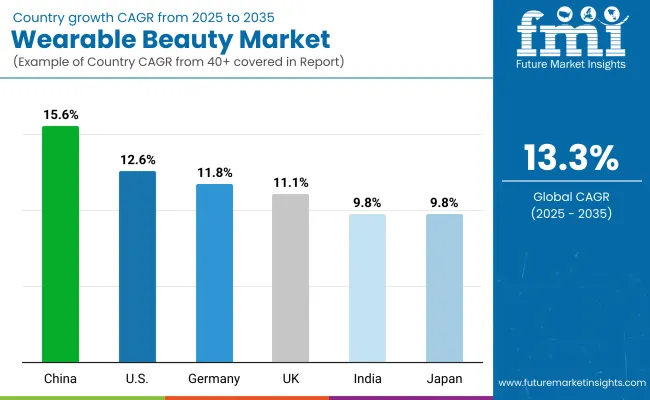
Analysis of Wearable Beauty Market By Key Countries

Wearable Beauty Market By Country

Countries CAGR (2025 to 2035)
China 15.6%
USA 12.6%
India 9.8%
UK 11.1%
Germany 11.8%
Japan 9.8%

China is expected to record the fastest growth in the wearable beauty devices market with a CAGR of 15.6% from 2025 to 2035, driven by strong tech-beauty convergence, rising consumer affluence, and early adoption of at-home skincare innovations. The USA follows with a CAGR of 12.6%, supported by high spending on premium beauty tech, increased DTC access, and personalization demands. India’s projected CAGR of 9.8% reflects rising urban middle-class consumption, influencer-driven demand, and product affordability improvements.

In Europe, the UK (11.1%) and Germany (11.8%) are witnessing growth fueled by aging demographics and consumer interest in non-invasive anti-aging solutions. Japan, with a slower yet stable CAGR of 9.8%, continues to support innovation, although its mature market presents growth limitations. Asia-Pacific markets, especially China and India, are being increasingly prioritized for strategic expansion and early product launches.

Sales Outlook for Wearable Beauty in the United States

Year USA Wearable Beauty Market (USD Million)
2025 787.96
2026 875.66
2027 973.12
2028 1081.42
2029 1201.79
2030 1335.54
2031 1484.19
2032 1649.38
2033 1832.96
2034 2036.97
2035 2263.68

The USA wearable beauty market is projected to grow steadily from USD 787.96 million in 2025 to USD 2,263.68 million by 2035, expanding at a CAGR of approximately 10.9%. Growth accelerates notably after 2028, as consumer appetite for AI-enabled skincare tools, personalized regimens, and device-app integration intensifies. The market nearly triples over the decade, underscoring a strong consumer shift toward tech-powered beauty solutions.

The growth of the USA wearable beauty market is being strongly driven by the rising consumer preference for personalized, tech-integrated skincare solutions that offer measurable results at home. Between 2025 and 2035, demand is being propelled by AI-powered skin analysis, real-time hydration and UV sensors, and the integration of wearables with mobile apps for tracking and customizing beauty routines.

Consumers are increasingly seeking data-driven, preventative skincare that aligns with wellness goals, prompting both startups and established beauty-tech companies to launch innovative, multifunctional devices. This convergence of beauty and health tech is reshaping product expectations and driving sustained adoption.

Growth and Expansion Outlook for Wearable Beauty Market in the United Kingdom

The wearable beauty market in the United Kingdom is projected to grow at a CAGR of 11.1% from 2025 to 2035. Growth is being supported by rising demand for tech-driven skincare tools, particularly those offering personalization and app connectivity. Consumers are shifting toward minimalist and wellness-integrated beauty routines, boosting interest in LED therapy and microcurrent devices.

Local expansion is being reinforced through strong retail and e-commerce partnerships.The competitive landscape is being shaped by the entry of wellness-centric brands that bridge cosmetic benefits with mental relaxation, signaling an evolution in beauty tech consumption preferences.

  • Consumer preference for clean, minimalist beauty routines is boosting demand for targeted smart tools.
  • App-based solutions and personalization features are gaining traction in high-income urban households.
  • UK brands are emphasizing wellness-beauty hybrids, such as LED masks with mindfulness modes.

Growth and Expansion Outlook for Wearable Beauty Market in India

India is witnessing rapid growth in the Wearable Beauty Market, which is forecast to expand at a CAGR of 9.8% through 2035. Growing interest in tech-enabled skincare solutions among Gen Z and millennial consumers has created momentum for mass-market and mid-range wearable beauty devices. A sharp rise in direct-to-consumer sales, especially through influencer-driven platforms and mobile-first e-commerce, has further broadened access. Startups are launching affordable smart masks and LED-based wearables targeting hydration, acne, and anti-aging concerns.

Meanwhile, dermatology clinics and beauty salons are beginning to incorporate diagnostic sensors for personalized skin profiling. In parallel, device manufacturers are forming local partnerships to tailor offerings to Indian skin types and conditions, further boosting regional relevance.

  • Wearable beauty devices are seeing wider uptake in tier-2 and tier-3 cities via mobile-first e-commerce.
  • Startups are introducing affordable multifunctional devices tailored for Indian skin profiles.
  • Dermatology clinics and salons are piloting diagnostic sensors for customized treatments.

Sales Outlook for Wearable Beauty in China

China is witnessing strong momentum in the Wearable Beauty Market, which is forecast to grow at a CAGR of 15.6% through 2035, the fastest among major economies. The rapid digitalization of personal care routines, combined with rising disposable income and tech adoption among young urban consumers, has positioned China as a core growth engine for smart skincare tools.

Domestic brands are aggressively scaling up production of AI-integrated facial devices, skin hydration trackers, and smart massagers targeting home-use beauty regimens. Integration of these devices into TCM-inspired (Traditional Chinese Medicine) wellness offerings is gaining traction, enhancing both cultural relevance and appeal. Retailers are bundling beauty tech with skincare subscriptions via popular social commerce platforms like Douyin and Xiaohongshu, driving repeat sales and market stickiness.

  • China’s urban youth are driving up demand for AI-powered skin analysis and beauty tools.
  • TCM-inspired wearable beauty integrations are enhancing product appeal and adoption.
  • Social commerce is fueling recurring purchases through influencer-driven device bundling.

In-depth Analysis of Wearable Beauty in Germany

Countries 2025 Share (%)
USA 31.2%
China 31.2%
Japan 12.4%
Germany 10.1%
UK 9.3%
India 6.1%
Countries 2035 Share (%)
USA 28.1%
China 25.1%
Japan 9.7%
Germany 8.5%
UK 8.0%
India 9.3%

Germany’s share in the global Wearable Beauty Market is projected to decline from 10.1% in 2025 to 8.5% by 2035, reflecting a relative slowdown compared to emerging markets. Despite this share dip, Germany continues to remain a mature and innovation-driven hub for beauty technology, supported by its strong dermatological research base and consumer focus on high-quality, skin-safe devices.

Demand is primarily concentrated in premium segments such as smart anti-aging tools, UV exposure monitors, and clinically validated skin analyzers. However, high device costs and slower adoption rates among older demographics are limiting volume expansion. While wellness-conscious consumers are actively experimenting with connected beauty wearables, the market is being cautiously reshaped through gradual integration with certified dermatological regimens and regulated retail channels.

  • Market share is expected to decline due to faster growth in emerging economies.
  • Innovation remains centered around skin-safe, anti-aging, and UV-tracking wearables.
  • Slower mass adoption is observed among older consumers and price-sensitive groups.

Growth Outlook for Wearable Beauty Market in China

China By Sensor & Technology Value Share% 2025
Light-Based Technologies (Red, Blue, NIR LEDs) 52.7%
Others 47.3%

The Wearable Beauty Market in China is projected to hold a 28.1% global share by 2035, up from 31.2% in 2025. Light-based technologies such as red, blue, and near-infrared (NIR) LEDs account for 52.7% of the sensor & technology value share in 2025, signaling their centrality in device functionality. This dominance reflects Chinese consumers’ preference for multifunctional skincare wearables that enable at-home phototherapy, acne treatment, and wrinkle reduction.

Light-emitting sensor modules offer non-invasive, reusable, and cost-efficient options, making them ideal for daily-use beauty routines. Their integration into compact, smartphone-linked devices aligns with rising digital wellness adoption, especially among young urban consumers. Meanwhile, the 47.3% share for other sensor technologies reflects the increasing experimentation with hydration, pH, and motion tracking in niche applications.

China’s R&D ecosystem is fueling local innovations in skin tone calibration and real-time biomarker detection, which are expected to expand the capabilities of light-based modules further. Global brands are also customizing wearable photonics for the Chinese market, focusing on portability, efficacy, and localized skin condition mapping.

  • Light-based technologies dominate with a 52.7% share in 2025
  • Consumer demand focuses on phototherapy, anti-acne, and anti-aging use cases
  • Local R&D is enhancing efficacy through real-time skin biomarker detection

Opportunity Analysis of USA Wearable Beauty Market

USA By Product Type Value Share% 2025
LED Light Therapy Masks 38.2%
Others 61.8%

The Wearable Beauty Market in the USA is projected to be valued at USD 789.9 million in 2025, with LED light therapy masks accounting for 38.2% of the product type value share. This product category dominates due to its proven efficacy in skin rejuvenation, acne treatment, and wrinkle reduction. The prominence of LED masks is supported by increasing consumer trust in light-based therapies endorsed by dermatologists and wellness professionals.

Their hands-free usage and compatibility with home routines make them a preferred solution for aging skin and photo-damage correction, particularly among Gen X and millennial consumers. Customizable intensity settings and targeted wavelength modules enhance the appeal among tech-savvy users demanding personalized skincare.

Meanwhile, the remaining 61.8% share is occupied by diverse formats such as microcurrent facial wearables, hydration sensors, and thermal massagers. However, none of these currently rival LED masks in perceived clinical efficacy or consumer brand recall. The USA market is also benefiting from strategic collaborations between beauty brands and tech firms to develop AI-integrated LED platforms.
  • USA market forecasted at USD 789.9 million in 2025
  • LED light therapy masks lead with 38.2% value share
  • Adoption driven by home-based skin rejuvenation and AI-linked personalization

Competitive Landscape of Wearable Beauty Market

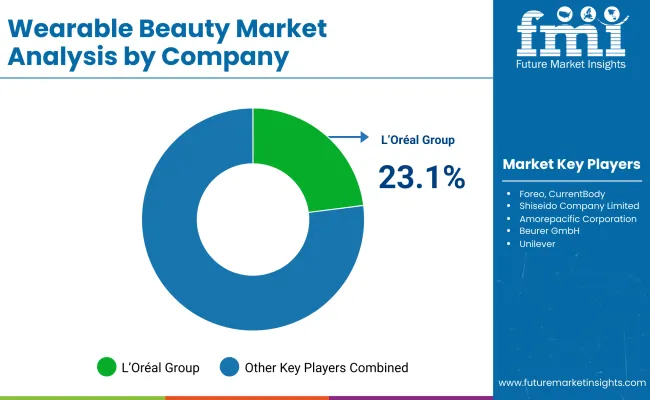
Wearable Beauty Market By Company

The competitive landscape of the global Wearable Beauty Market in 2025 is significantly concentrated, with L’Oréal Group projected to command a dominant 23.1% share of total value. This leadership position has been secured through early investments in skin sensor-based wearables, strong patent ownership, and consistent consumer engagement through dermatological research-backed product development.

L’Oréal’s strategic collaborations with biotech and digital wellness platforms have further cemented its first-mover advantage, allowing integration of personalized skin diagnostics into consumer beauty routines. The company’s focus on developing scalable, data-enabled skincare tools has ensured rapid global acceptance.

Despite this dominance, the remaining 76.9% of the market is occupied by a fragmented set of companies including device manufacturers, skincare brands venturing into tech, and wellness-focused startups. These players are experimenting with hydration monitors, LED-based masks, and microcurrent tools, aiming to carve out niches by targeting specific consumer groups such as men’s grooming or aging care. However, their scalability and clinical validation remain limiting factors when compared to L’Oréal’s dermatological credentials and global retail footprint.

Key Developments in Wearable Beauty Market

  • In 2024, L’Oréal expanded its wearable tech portfolio with the global launch of a next-generation AI-enabled skin sensor, capable of detecting hydration, pH levels, and UV exposure in real-time. The device, integrated with a companion mobile app, uses machine learning algorithms to offer dynamic skincare routines and product recommendations based on user lifestyle and environmental conditions. This marked a pivotal shift from standalone beauty gadgets to adaptive, data-driven platforms in skincare personalization.
  • In early 2025, Procter & Gamble (P&G) acquired a Switzerland-based skincare wearables startup specializing in blue-light therapy patches and biosensor integration. This acquisition was aimed at strengthening P&G’s foothold in therapeutic beauty wearables, particularly in acne management and anti-aging. The move aligned with P&G’s broader strategy to integrate IoT-enabled skincare into its consumer portfolio, targeting tech-savvy younger demographics and the premium wellness segment.

Scope of the Report

Item Value
Quantitative Units USD 2,785.4 Million
Product Type LED Light Therapy Masks, Microcurrent Facial Devices, Sonic Cleansing Devices & Massagers, Hair Growth Helmets / Bands (Laser or LED-Based)
Sensor & Technology Hydration Sensors & Skin Moisture Trackers, UV Sensors, Light-Based Technologies (Red, Blue, NIR LEDs)
Application Anti-Aging and Wrinkle Reduction, Skin Tightening and Firming, Acne Treatment (Blue Light or pH-related)
End User General Consumers, Professional Use (Dermatology & Spas), Pharmacy/Drug Stores
Distribution Channel E-commerce, Offline
Regions Covered North America, Europe, Asia-Pacific, Latin America, Middle East & Africa
Country Covered United States, Canada, Germany, France, United Kingdom, China, Japan, India, South Africa
Key Companies Profiled L’Oréal Group, MTG Co., Ltd. (ReFa brand), Foreo, CurrentBody, Shiseido Company, Limited, Amorepacific Corporation, Procter & Gamble (Olay, Neutrogena), Beurer GmbH, Unilever, Lancer Skincare
Additional Attributes Dollar sales by product type and application, adoption trends in at-home skin health monitoring and personalized beauty care, rising demand for sensor-integrated wearable devices, category-specific growth in skincare, anti-aging, and wellness segments, revenue segmentation for hardware, software, and app-based services, integration with AI-driven diagnostics, IoT, and real-time analytics, regional trends shaped by consumer tech adoption and wellness digitization, and innovations in biosensors, nanomaterials, and wireless skin-interfacing technologies.

Key Segments

By Product Type:

  • LED Light Therapy Masks
  • Microcurrent Facial Devices
  • Sonic Cleansing Devices & Massagers
  • Hair Growth Helmets / Bands (Laser or LED-Based)

By Sensor & Technology:

  • Hydration Sensors & Skin Moisture Trackers
  • UV Sensors
  • Light-Based Technologies (Red, Blue, NIR LEDs)

By Application:

  • Anti-Aging and Wrinkle Reduction
  • Skin Tightening and Firming
  • Acne Treatment (Blue Light or pH-related)

By End User:

  • Women (All Age Groups)
  • Professional Use (Dermatology & Spas)

By Distribution Channel:

  • Online DTC + E-commerce
  • Beauty Retail Chains (Sephora, Ulta)

By Region:

  • North America
  • Latin America
  • Europe
  • East Asia
  • South Asia & Pacific
  • Middle East and Africa

Table of Content

  1. Executive Summary
    • Global Market Outlook
    • Demand-side Trends
    • Supply-side Trends
    • Technology Roadmap Analysis
    • Analysis and Recommendations
  2. Market Overview
    • Market Coverage / Taxonomy
    • Market Definition / Scope / Limitations
  3. Market Background
    • Market Dynamics
      • Drivers
      • Restraints
      • Opportunity
      • Trends
    • Scenario Forecast
      • Demand in Optimistic Scenario
      • Demand in Likely Scenario
      • Demand in Conservative Scenario
    • Opportunity Map Analysis
    • Product Life Cycle Analysis
    • Supply Chain Analysis
      • Supply Side Participants and their Roles
        • Producers
        • Mid-Level Participants (Traders/ Agents/ Brokers)
        • Wholesalers and Distributors
      • Value Added and Value Created at Node in the Supply Chain
      • List of Raw Material Suppliers
      • List of Existing and Potential Buyer’s
    • Investment Feasibility Matrix
    • Value Chain Analysis
      • Profit Margin Analysis
      • Wholesalers and Distributors
      • Retailers
    • PESTLE and Porter’s Analysis
    • Regulatory Landscape
      • By Key Regions
      • By Key Countries
    • Regional Parent Market Outlook
    • Production and Consumption Statistics
    • Import and Export Statistics
  4. Global Market Analysis 2020 to 2024 and Forecast, 2025 to 2035
    • Historical Market Size Value (USD Million) & Volume (Units) Analysis, 2020 to 2024
    • Current and Future Market Size Value (USD Million) & Volume (Units) Projections, 2025 to 2035
      • Y-o-Y Growth Trend Analysis
      • Absolute $ Opportunity Analysis
  5. Global Market Analysis 2020 to 2024 and Forecast 2025 to 2035, By Product Type
    • Introduction / Key Findings
    • Historical Market Size Value (USD Million) & Volume (Units) Analysis By Product Type, 2020 to 2024
    • Current and Future Market Size Value (USD Million) & Volume (Units) Analysis and Forecast By Product Type, 2025 to 2035
      • LED Light Therapy Masks
      • Microcurrent Facial Devices
      • Sonic Cleansing Devices & Massagers
      • Hair Growth Helmets / Bands (Laser or LED-Based)
    • Y-o-Y Growth Trend Analysis By Product Type, 2020 to 2024
    • Absolute $ Opportunity Analysis By Product Type, 2025 to 2035
  6. Global Market Analysis 2020 to 2024 and Forecast 2025 to 2035, By Sensor & Technology
    • Introduction / Key Findings
    • Historical Market Size Value (USD Million) & Volume (Units) Analysis By Sensor & Technology, 2020 to 2024
    • Current and Future Market Size Value (USD Million) & Volume (Units) Analysis and Forecast By Sensor & Technology, 2025 to 2035
      • Hydration Sensors & Skin Moisture Trackers
      • UV Sensors
      • Light-Based Technologies (Red, Blue, NIR LEDs)
    • Y-o-Y Growth Trend Analysis By Sensor & Technology, 2020 to 2024
    • Absolute $ Opportunity Analysis By Sensor & Technology, 2025 to 2035
  7. Global Market Analysis 2020 to 2024 and Forecast 2025 to 2035, By Application
    • Introduction / Key Findings
    • Historical Market Size Value (USD Million) & Volume (Units) Analysis By Application, 2020 to 2024
    • Current and Future Market Size Value (USD Million) & Volume (Units) Analysis and Forecast By Application, 2025 to 2035
      • Anti-Aging and Wrinkle Reduction
      • Skin Tightening and Firming
      • Acne Treatment (Blue Light or pH-related)
    • Y-o-Y Growth Trend Analysis By Application, 2020 to 2024
    • Absolute $ Opportunity Analysis By Application, 2025 to 2035
  8. Global Market Analysis 2020 to 2024 and Forecast 2025 to 2035, By End User
    • Introduction / Key Findings
    • Historical Market Size Value (USD Million) & Volume (Units) Analysis By End User, 2020 to 2024
    • Current and Future Market Size Value (USD Million) & Volume (Units) Analysis and Forecast By End User, 2025 to 2035
      • Women (All Age Groups)
      • Professional Use (Dermatology & Spas)
    • Y-o-Y Growth Trend Analysis By End User, 2020 to 2024
    • Absolute $ Opportunity Analysis By End User, 2025 to 2035
  9. Global Market Analysis 2020 to 2024 and Forecast 2025 to 2035, By Distribution Channel
    • Introduction / Key Findings
    • Historical Market Size Value (USD Million) & Volume (Units) Analysis By Distribution Channel, 2020 to 2024
    • Current and Future Market Size Value (USD Million) & Volume (Units) Analysis and Forecast By Distribution Channel, 2025 to 2035
      • Online DTC + E-commerce
      • Beauty Retail Chains (Sephora, Ulta)
    • Y-o-Y Growth Trend Analysis By Distribution Channel, 2020 to 2024
    • Absolute $ Opportunity Analysis By Distribution Channel, 2025 to 2035
  10. Global Market Analysis 2020 to 2024 and Forecast 2025 to 2035, By Region
    • Introduction
    • Historical Market Size Value (USD Million) & Volume (Units) Analysis By Region, 2020 to 2024
    • Current Market Size Value (USD Million) & Volume (Units) Analysis and Forecast By Region, 2025 to 2035
      • North America
      • Latin America
      • Europe
      • East Asia
      • South Asia & Pacific
      • Middle East and Africa
    • Market Attractiveness Analysis By Region
  11. North America Market Analysis 2020 to 2024 and Forecast 2025 to 2035, By Country
    • Historical Market Size Value (USD Million) & Volume (Units) Trend Analysis By Market Taxonomy, 2020 to 2024
    • Market Size Value (USD Million) & Volume (Units) Forecast By Market Taxonomy, 2025 to 2035
      • By Country
        • USA
        • Canada
      • By Product Type
      • By Sensor & Technology
      • By Application
      • By End User
      • By Distribution Channel
    • Market Attractiveness Analysis
      • By Country
      • By Product Type
      • By Sensor & Technology
      • By Application
      • By End User
      • By Distribution Channel
    • Key Takeaways
  12. Latin America Market Analysis 2020 to 2024 and Forecast 2025 to 2035, By Country
    • Historical Market Size Value (USD Million) & Volume (Units) Trend Analysis By Market Taxonomy, 2020 to 2024
    • Market Size Value (USD Million) & Volume (Units) Forecast By Market Taxonomy, 2025 to 2035
      • By Country
        • Brazil
        • Mexico
        • Colombia
        • Rest of Latin America
      • By Product Type
      • By Sensor & Technology
      • By Application
      • By End User
      • By Distribution Channel
    • Market Attractiveness Analysis
      • By Country
      • By Product Type
      • By Sensor & Technology
      • By Application
      • By End User
      • By Distribution Channel
    • Key Takeaways
  13. Europe Market Analysis 2020 to 2024 and Forecast 2025 to 2035, By Country
    • Historical Market Size Value (USD Million) & Volume (Units) Trend Analysis By Market Taxonomy, 2020 to 2024
    • Market Size Value (USD Million) & Volume (Units) Forecast By Market Taxonomy, 2025 to 2035
      • By Country
        • Germany
        • UK
        • France
        • Italy
        • Spain
        • Belgium
        • Netherlands
        • Nordic
        • Switzerland
        • Russia
        • Poland
        • Rest of Europe
      • By Product Type
      • By Sensor & Technology
      • By Application
      • By End User
      • By Distribution Channel
    • Market Attractiveness Analysis
      • By Country
      • By Product Type
      • By Sensor & Technology
      • By Application
      • By End User
      • By Distribution Channel
    • Key Takeaways
  14. East Asia Market Analysis 2020 to 2024 and Forecast 2025 to 2035, By Country
    • Historical Market Size Value (USD Million) & Volume (Units) Trend Analysis By Market Taxonomy, 2020 to 2024
    • Market Size Value (USD Million) & Volume (Units) Forecast By Market Taxonomy, 2025 to 2035
      • By Country
        • China
        • Japan
        • South Korea
      • By Product Type
      • By Sensor & Technology
      • By Application
      • By End User
      • By Distribution Channel
    • Market Attractiveness Analysis
      • By Country
      • By Product Type
      • By Sensor & Technology
      • By Application
      • By End User
      • By Distribution Channel
    • Key Takeaways
  15. South Asia & Pacific Market Analysis 2020 to 2024 and Forecast 2025 to 2035, By Country
    • Historical Market Size Value (USD Million) & Volume (Units) Trend Analysis By Market Taxonomy, 2020 to 2024
    • Market Size Value (USD Million) & Volume (Units) Forecast By Market Taxonomy, 2025 to 2035
      • By Country
        • India
        • Thailand
        • Malaysia
        • Indonesia
        • Singapore
        • Vietnam
        • Australia
        • New Zealand
        • Rest of South Asia
      • By Product Type
      • By Sensor & Technology
      • By Application
      • By End User
      • By Distribution Channel
    • Market Attractiveness Analysis
      • By Country
      • By Product Type
      • By Sensor & Technology
      • By Application
      • By End User
      • By Distribution Channel
    • Key Takeaways
  16. Middle East and Africa Market Analysis 2020 to 2024 and Forecast 2025 to 2035, By Country
    • Historical Market Size Value (USD Million) & Volume (Units) Trend Analysis By Market Taxonomy, 2020 to 2024
    • Market Size Value (USD Million) & Volume (Units) Forecast By Market Taxonomy, 2025 to 2035
      • By Country
        • Turkey
        • UAE
        • Saudi Arabia
        • Israel
        • Other GCC Countries
        • North Africa
        • South Africa
      • By Product Type
      • By Sensor & Technology
      • By Application
      • By End User
      • By Distribution Channel
    • Market Attractiveness Analysis
      • By Country
      • By Product Type
      • By Sensor & Technology
      • By Application
      • By End User
      • By Distribution Channel
    • Key Takeaways
  17. Key Countries Market Analysis
    • USA
      • Pricing Analysis
      • Market Share Analysis, 2024
        • By Product Type
        • By Sensor & Technology
        • By Application
        • By End User
        • By Distribution Channel
    • Canada
      • Pricing Analysis
      • Market Share Analysis, 2024
        • By Product Type
        • By Sensor & Technology
        • By Application
        • By End User
        • By Distribution Channel
    • Brazil
      • Pricing Analysis
      • Market Share Analysis, 2024
        • By Product Type
        • By Sensor & Technology
        • By Application
        • By End User
        • By Distribution Channel
    • Mexico
      • Pricing Analysis
      • Market Share Analysis, 2024
        • By Product Type
        • By Sensor & Technology
        • By Application
        • By End User
        • By Distribution Channel
    • Colombia
      • Pricing Analysis
      • Market Share Analysis, 2024
        • By Product Type
        • By Sensor & Technology
        • By Application
        • By End User
        • By Distribution Channel
    • Germany
      • Pricing Analysis
      • Market Share Analysis, 2024
        • By Product Type
        • By Sensor & Technology
        • By Application
        • By End User
        • By Distribution Channel
    • UK
      • Pricing Analysis
      • Market Share Analysis, 2024
        • By Product Type
        • By Sensor & Technology
        • By Application
        • By End User
        • By Distribution Channel
    • France
      • Pricing Analysis
      • Market Share Analysis, 2024
        • By Product Type
        • By Sensor & Technology
        • By Application
        • By End User
        • By Distribution Channel
    • Italy
      • Pricing Analysis
      • Market Share Analysis, 2024
        • By Product Type
        • By Sensor & Technology
        • By Application
        • By End User
        • By Distribution Channel
    • Spain
      • Pricing Analysis
      • Market Share Analysis, 2024
        • By Product Type
        • By Sensor & Technology
        • By Application
        • By End User
        • By Distribution Channel
    • Belgium
      • Pricing Analysis
      • Market Share Analysis, 2024
        • By Product Type
        • By Sensor & Technology
        • By Application
        • By End User
        • By Distribution Channel
    • Netherlands
      • Pricing Analysis
      • Market Share Analysis, 2024
        • By Product Type
        • By Sensor & Technology
        • By Application
        • By End User
        • By Distribution Channel
    • Nordic
      • Pricing Analysis
      • Market Share Analysis, 2024
        • By Product Type
        • By Sensor & Technology
        • By Application
        • By End User
        • By Distribution Channel
    • Switzerland
      • Pricing Analysis
      • Market Share Analysis, 2024
        • By Product Type
        • By Sensor & Technology
        • By Application
        • By End User
        • By Distribution Channel
    • Russia
      • Pricing Analysis
      • Market Share Analysis, 2024
        • By Product Type
        • By Sensor & Technology
        • By Application
        • By End User
        • By Distribution Channel
    • Poland
      • Pricing Analysis
      • Market Share Analysis, 2024
        • By Product Type
        • By Sensor & Technology
        • By Application
        • By End User
        • By Distribution Channel
    • China
      • Pricing Analysis
      • Market Share Analysis, 2024
        • By Product Type
        • By Sensor & Technology
        • By Application
        • By End User
        • By Distribution Channel
    • Japan
      • Pricing Analysis
      • Market Share Analysis, 2024
        • By Product Type
        • By Sensor & Technology
        • By Application
        • By End User
        • By Distribution Channel
    • South Korea
      • Pricing Analysis
      • Market Share Analysis, 2024
        • By Product Type
        • By Sensor & Technology
        • By Application
        • By End User
        • By Distribution Channel
    • India
      • Pricing Analysis
      • Market Share Analysis, 2024
        • By Product Type
        • By Sensor & Technology
        • By Application
        • By End User
        • By Distribution Channel
    • Thailand
      • Pricing Analysis
      • Market Share Analysis, 2024
        • By Product Type
        • By Sensor & Technology
        • By Application
        • By End User
        • By Distribution Channel
    • Indonesia
      • Pricing Analysis
      • Market Share Analysis, 2024
        • By Product Type
        • By Sensor & Technology
        • By Application
        • By End User
        • By Distribution Channel
    • Australia
      • Pricing Analysis
      • Market Share Analysis, 2024
        • By Product Type
        • By Sensor & Technology
        • By Application
        • By End User
        • By Distribution Channel
    • New Zealand
      • Pricing Analysis
      • Market Share Analysis, 2024
        • By Product Type
        • By Sensor & Technology
        • By Application
        • By End User
        • By Distribution Channel
    • Turkey
      • Pricing Analysis
      • Market Share Analysis, 2024
        • By Product Type
        • By Sensor & Technology
        • By Application
        • By End User
        • By Distribution Channel
    • UAE
      • Pricing Analysis
      • Market Share Analysis, 2024
        • By Product Type
        • By Sensor & Technology
        • By Application
        • By End User
        • By Distribution Channel
    • Saudi Arabia
      • Pricing Analysis
      • Market Share Analysis, 2024
        • By Product Type
        • By Sensor & Technology
        • By Application
        • By End User
        • By Distribution Channel
    • Israel
      • Pricing Analysis
      • Market Share Analysis, 2024
        • By Product Type
        • By Sensor & Technology
        • By Application
        • By End User
        • By Distribution Channel
    • North Africa
      • Pricing Analysis
      • Market Share Analysis, 2024
        • By Product Type
        • By Sensor & Technology
        • By Application
        • By End User
        • By Distribution Channel
    • South Africa
      • Pricing Analysis
      • Market Share Analysis, 2024
        • By Product Type
        • By Sensor & Technology
        • By Application
        • By End User
        • By Distribution Channel
  18. Market Structure Analysis
    • Competition Dashboard
    • Competition Benchmarking
    • Market Share Analysis of Top Players
      • By Regional
      • By Product Type
      • By Sensor & Technology
      • By Application
      • By End User
      • By Distribution Channel
  19. Competition Analysis
    • Competition Deep Dive
      • L’Oréal Group
        • Overview
        • Product Portfolio
        • Profitability by Market Segments (Product/Age /Sales Channel/Region)
        • Sales Footprint
        • Strategy Overview
          • Marketing Strategy
          • Product Strategy
          • Channel Strategy
      • MTG Co., Ltd. (ReFa brand)
        • Overview
        • Product Portfolio
        • Profitability by Market Segments (Product/Age /Sales Channel/Region)
        • Sales Footprint
        • Strategy Overview
          • Marketing Strategy
          • Product Strategy
          • Channel Strategy
      • Foreo
        • Overview
        • Product Portfolio
        • Profitability by Market Segments (Product/Age /Sales Channel/Region)
        • Sales Footprint
        • Strategy Overview
          • Marketing Strategy
          • Product Strategy
          • Channel Strategy
      • CurrentBody
        • Overview
        • Product Portfolio
        • Profitability by Market Segments (Product/Age /Sales Channel/Region)
        • Sales Footprint
        • Strategy Overview
          • Marketing Strategy
          • Product Strategy
          • Channel Strategy
      • Shiseido Company, Limited
        • Overview
        • Product Portfolio
        • Profitability by Market Segments (Product/Age /Sales Channel/Region)
        • Sales Footprint
        • Strategy Overview
          • Marketing Strategy
          • Product Strategy
          • Channel Strategy
      • Amorepacific Corporation
        • Overview
        • Product Portfolio
        • Profitability by Market Segments (Product/Age /Sales Channel/Region)
        • Sales Footprint
        • Strategy Overview
          • Marketing Strategy
          • Product Strategy
          • Channel Strategy
      • Procter & Gamble (Olay, Neutrogena)
        • Overview
        • Product Portfolio
        • Profitability by Market Segments (Product/Age /Sales Channel/Region)
        • Sales Footprint
        • Strategy Overview
          • Marketing Strategy
          • Product Strategy
          • Channel Strategy
      • Beurer GmbH
        • Overview
        • Product Portfolio
        • Profitability by Market Segments (Product/Age /Sales Channel/Region)
        • Sales Footprint
        • Strategy Overview
          • Marketing Strategy
          • Product Strategy
          • Channel Strategy
      • Unilever
        • Overview
        • Product Portfolio
        • Profitability by Market Segments (Product/Age /Sales Channel/Region)
        • Sales Footprint
        • Strategy Overview
          • Marketing Strategy
          • Product Strategy
          • Channel Strategy
      • Lancer Skincare
        • Overview
        • Product Portfolio
        • Profitability by Market Segments (Product/Age /Sales Channel/Region)
        • Sales Footprint
        • Strategy Overview
          • Marketing Strategy
          • Product Strategy
          • Channel Strategy
      • Others
        • Overview
        • Product Portfolio
        • Profitability by Market Segments (Product/Age /Sales Channel/Region)
        • Sales Footprint
        • Strategy Overview
          • Marketing Strategy
          • Product Strategy
          • Channel Strategy
  20. Assumptions & Acronyms Used
  21. Research Methodology

List of Tables

  • Table 1: Global Market Value (USD Million) Forecast by Region, 2020-2035
  • Table 2: Global Market Volume (Units) Forecast by Region, 2020-2035
  • Table 3: Global Market Value (USD Million) Forecast by Product Type, 2020-2035
  • Table 4: Global Market Volume (Units) Forecast by Product Type, 2020-2035
  • Table 5: Global Market Value (USD Million) Forecast by Sensor & Technology, 2020-2035
  • Table 6: Global Market Volume (Units) Forecast by Sensor & Technology, 2020-2035
  • Table 7: Global Market Value (USD Million) Forecast by Application, 2020-2035
  • Table 8: Global Market Volume (Units) Forecast by Application, 2020-2035
  • Table 9: Global Market Value (USD Million) Forecast by End User, 2020-2035
  • Table 10: Global Market Volume (Units) Forecast by End User, 2020-2035
  • Table 11: Global Market Value (USD Million) Forecast by Distribution Channel, 2020-2035
  • Table 12: Global Market Volume (Units) Forecast by Distribution Channel, 2020-2035
  • Table 13: North America Market Value (USD Million) Forecast by Country, 2020-2035
  • Table 14: North America Market Volume (Units) Forecast by Country, 2020-2035
  • Table 15: North America Market Value (USD Million) Forecast by Product Type, 2020-2035
  • Table 16: North America Market Volume (Units) Forecast by Product Type, 2020-2035
  • Table 17: North America Market Value (USD Million) Forecast by Sensor & Technology, 2020-2035
  • Table 18: North America Market Volume (Units) Forecast by Sensor & Technology, 2020-2035
  • Table 19: North America Market Value (USD Million) Forecast by Application, 2020-2035
  • Table 20: North America Market Volume (Units) Forecast by Application, 2020-2035
  • Table 21: North America Market Value (USD Million) Forecast by End User, 2020-2035
  • Table 22: North America Market Volume (Units) Forecast by End User, 2020-2035
  • Table 23: North America Market Value (USD Million) Forecast by Distribution Channel, 2020-2035
  • Table 24: North America Market Volume (Units) Forecast by Distribution Channel, 2020-2035
  • Table 25: Latin America Market Value (USD Million) Forecast by Country, 2020-2035
  • Table 26: Latin America Market Volume (Units) Forecast by Country, 2020-2035
  • Table 27: Latin America Market Value (USD Million) Forecast by Product Type, 2020-2035
  • Table 28: Latin America Market Volume (Units) Forecast by Product Type, 2020-2035
  • Table 29: Latin America Market Value (USD Million) Forecast by Sensor & Technology, 2020-2035
  • Table 30: Latin America Market Volume (Units) Forecast by Sensor & Technology, 2020-2035
  • Table 31: Latin America Market Value (USD Million) Forecast by Application, 2020-2035
  • Table 32: Latin America Market Volume (Units) Forecast by Application, 2020-2035
  • Table 33: Latin America Market Value (USD Million) Forecast by End User, 2020-2035
  • Table 34: Latin America Market Volume (Units) Forecast by End User, 2020-2035
  • Table 35: Latin America Market Value (USD Million) Forecast by Distribution Channel, 2020-2035
  • Table 36: Latin America Market Volume (Units) Forecast by Distribution Channel, 2020-2035
  • Table 37: Europe Market Value (USD Million) Forecast by Country, 2020-2035
  • Table 38: Europe Market Volume (Units) Forecast by Country, 2020-2035
  • Table 39: Europe Market Value (USD Million) Forecast by Product Type, 2020-2035
  • Table 40: Europe Market Volume (Units) Forecast by Product Type, 2020-2035
  • Table 41: Europe Market Value (USD Million) Forecast by Sensor & Technology, 2020-2035
  • Table 42: Europe Market Volume (Units) Forecast by Sensor & Technology, 2020-2035
  • Table 43: Europe Market Value (USD Million) Forecast by Application, 2020-2035
  • Table 44: Europe Market Volume (Units) Forecast by Application, 2020-2035
  • Table 45: Europe Market Value (USD Million) Forecast by End User, 2020-2035
  • Table 46: Europe Market Volume (Units) Forecast by End User, 2020-2035
  • Table 47: Europe Market Value (USD Million) Forecast by Distribution Channel, 2020-2035
  • Table 48: Europe Market Volume (Units) Forecast by Distribution Channel, 2020-2035
  • Table 49: East Asia Market Value (USD Million) Forecast by Country, 2020-2035
  • Table 50: East Asia Market Volume (Units) Forecast by Country, 2020-2035
  • Table 51: East Asia Market Value (USD Million) Forecast by Product Type, 2020-2035
  • Table 52: East Asia Market Volume (Units) Forecast by Product Type, 2020-2035
  • Table 53: East Asia Market Value (USD Million) Forecast by Sensor & Technology, 2020-2035
  • Table 54: East Asia Market Volume (Units) Forecast by Sensor & Technology, 2020-2035
  • Table 55: East Asia Market Value (USD Million) Forecast by Application, 2020-2035
  • Table 56: East Asia Market Volume (Units) Forecast by Application, 2020-2035
  • Table 57: East Asia Market Value (USD Million) Forecast by End User, 2020-2035
  • Table 58: East Asia Market Volume (Units) Forecast by End User, 2020-2035
  • Table 59: East Asia Market Value (USD Million) Forecast by Distribution Channel, 2020-2035
  • Table 60: East Asia Market Volume (Units) Forecast by Distribution Channel, 2020-2035
  • Table 61: South Asia & Pacific Market Value (USD Million) Forecast by Country, 2020-2035
  • Table 62: South Asia & Pacific Market Volume (Units) Forecast by Country, 2020-2035
  • Table 63: South Asia & Pacific Market Value (USD Million) Forecast by Product Type, 2020-2035
  • Table 64: South Asia & Pacific Market Volume (Units) Forecast by Product Type, 2020-2035
  • Table 65: South Asia & Pacific Market Value (USD Million) Forecast by Sensor & Technology, 2020-2035
  • Table 66: South Asia & Pacific Market Volume (Units) Forecast by Sensor & Technology, 2020-2035
  • Table 67: South Asia & Pacific Market Value (USD Million) Forecast by Application, 2020-2035
  • Table 68: South Asia & Pacific Market Volume (Units) Forecast by Application, 2020-2035
  • Table 69: South Asia & Pacific Market Value (USD Million) Forecast by End User, 2020-2035
  • Table 70: South Asia & Pacific Market Volume (Units) Forecast by End User, 2020-2035
  • Table 71: South Asia & Pacific Market Value (USD Million) Forecast by Distribution Channel, 2020-2035
  • Table 72: South Asia & Pacific Market Volume (Units) Forecast by Distribution Channel, 2020-2035
  • Table 73: Middle East and Africa Market Value (USD Million) Forecast by Country, 2020-2035
  • Table 74: Middle East and Africa Market Volume (Units) Forecast by Country, 2020-2035
  • Table 75: Middle East and Africa Market Value (USD Million) Forecast by Product Type, 2020-2035
  • Table 76: Middle East and Africa Market Volume (Units) Forecast by Product Type, 2020-2035
  • Table 77: Middle East and Africa Market Value (USD Million) Forecast by Sensor & Technology, 2020-2035
  • Table 78: Middle East and Africa Market Volume (Units) Forecast by Sensor & Technology, 2020-2035
  • Table 79: Middle East and Africa Market Value (USD Million) Forecast by Application, 2020-2035
  • Table 80: Middle East and Africa Market Volume (Units) Forecast by Application, 2020-2035
  • Table 81: Middle East and Africa Market Value (USD Million) Forecast by End User, 2020-2035
  • Table 82: Middle East and Africa Market Volume (Units) Forecast by End User, 2020-2035
  • Table 83: Middle East and Africa Market Value (USD Million) Forecast by Distribution Channel, 2020-2035
  • Table 84: Middle East and Africa Market Volume (Units) Forecast by Distribution Channel, 2020-2035

List of Figures

  • Figure 1: Global Market Value (USD Million) by Product Type, 2025-2035
  • Figure 2: Global Market Value (USD Million) by Sensor & Technology, 2025-2035
  • Figure 3: Global Market Value (USD Million) by Application, 2025-2035
  • Figure 4: Global Market Value (USD Million) by End User, 2025-2035
  • Figure 5: Global Market Value (USD Million) by Distribution Channel, 2025-2035
  • Figure 6: Global Market Value (USD Million) by Region, 2025-2035
  • Figure 7: Global Market Value (USD Million) Analysis by Region, 2020-2035
  • Figure 8: Global Market Volume (Units) Analysis by Region, 2020-2035
  • Figure 9: Global Market Value Share (%) and BPS Analysis by Region, 2025-2035
  • Figure 10: Global Market Y-o-Y Growth (%) Projections by Region, 2025-2035
  • Figure 11: Global Market Value (USD Million) Analysis by Product Type, 2020-2035
  • Figure 12: Global Market Volume (Units) Analysis by Product Type, 2020-2035
  • Figure 13: Global Market Value Share (%) and BPS Analysis by Product Type, 2025-2035
  • Figure 14: Global Market Y-o-Y Growth (%) Projections by Product Type, 2025-2035
  • Figure 15: Global Market Value (USD Million) Analysis by Sensor & Technology, 2020-2035
  • Figure 16: Global Market Volume (Units) Analysis by Sensor & Technology, 2020-2035
  • Figure 17: Global Market Value Share (%) and BPS Analysis by Sensor & Technology, 2025-2035
  • Figure 18: Global Market Y-o-Y Growth (%) Projections by Sensor & Technology, 2025-2035
  • Figure 19: Global Market Value (USD Million) Analysis by Application, 2020-2035
  • Figure 20: Global Market Volume (Units) Analysis by Application, 2020-2035
  • Figure 21: Global Market Value Share (%) and BPS Analysis by Application, 2025-2035
  • Figure 22: Global Market Y-o-Y Growth (%) Projections by Application, 2025-2035
  • Figure 23: Global Market Value (USD Million) Analysis by End User, 2020-2035
  • Figure 24: Global Market Volume (Units) Analysis by End User, 2020-2035
  • Figure 25: Global Market Value Share (%) and BPS Analysis by End User, 2025-2035
  • Figure 26: Global Market Y-o-Y Growth (%) Projections by End User, 2025-2035
  • Figure 27: Global Market Value (USD Million) Analysis by Distribution Channel, 2020-2035
  • Figure 28: Global Market Volume (Units) Analysis by Distribution Channel, 2020-2035
  • Figure 29: Global Market Value Share (%) and BPS Analysis by Distribution Channel, 2025-2035
  • Figure 30: Global Market Y-o-Y Growth (%) Projections by Distribution Channel, 2025-2035
  • Figure 31: Global Market Attractiveness by Product Type, 2025-2035
  • Figure 32: Global Market Attractiveness by Sensor & Technology, 2025-2035
  • Figure 33: Global Market Attractiveness by Application, 2025-2035
  • Figure 34: Global Market Attractiveness by End User, 2025-2035
  • Figure 35: Global Market Attractiveness by Distribution Channel, 2025-2035
  • Figure 36: Global Market Attractiveness by Region, 2025-2035
  • Figure 37: North America Market Value (USD Million) by Product Type, 2025-2035
  • Figure 38: North America Market Value (USD Million) by Sensor & Technology, 2025-2035
  • Figure 39: North America Market Value (USD Million) by Application, 2025-2035
  • Figure 40: North America Market Value (USD Million) by End User, 2025-2035
  • Figure 41: North America Market Value (USD Million) by Distribution Channel, 2025-2035
  • Figure 42: North America Market Value (USD Million) by Country, 2025-2035
  • Figure 43: North America Market Value (USD Million) Analysis by Country, 2020-2035
  • Figure 44: North America Market Volume (Units) Analysis by Country, 2020-2035
  • Figure 45: North America Market Value Share (%) and BPS Analysis by Country, 2025-2035
  • Figure 46: North America Market Y-o-Y Growth (%) Projections by Country, 2025-2035
  • Figure 47: North America Market Value (USD Million) Analysis by Product Type, 2020-2035
  • Figure 48: North America Market Volume (Units) Analysis by Product Type, 2020-2035
  • Figure 49: North America Market Value Share (%) and BPS Analysis by Product Type, 2025-2035
  • Figure 50: North America Market Y-o-Y Growth (%) Projections by Product Type, 2025-2035
  • Figure 51: North America Market Value (USD Million) Analysis by Sensor & Technology, 2020-2035
  • Figure 52: North America Market Volume (Units) Analysis by Sensor & Technology, 2020-2035
  • Figure 53: North America Market Value Share (%) and BPS Analysis by Sensor & Technology, 2025-2035
  • Figure 54: North America Market Y-o-Y Growth (%) Projections by Sensor & Technology, 2025-2035
  • Figure 55: North America Market Value (USD Million) Analysis by Application, 2020-2035
  • Figure 56: North America Market Volume (Units) Analysis by Application, 2020-2035
  • Figure 57: North America Market Value Share (%) and BPS Analysis by Application, 2025-2035
  • Figure 58: North America Market Y-o-Y Growth (%) Projections by Application, 2025-2035
  • Figure 59: North America Market Value (USD Million) Analysis by End User, 2020-2035
  • Figure 60: North America Market Volume (Units) Analysis by End User, 2020-2035
  • Figure 61: North America Market Value Share (%) and BPS Analysis by End User, 2025-2035
  • Figure 62: North America Market Y-o-Y Growth (%) Projections by End User, 2025-2035
  • Figure 63: North America Market Value (USD Million) Analysis by Distribution Channel, 2020-2035
  • Figure 64: North America Market Volume (Units) Analysis by Distribution Channel, 2020-2035
  • Figure 65: North America Market Value Share (%) and BPS Analysis by Distribution Channel, 2025-2035
  • Figure 66: North America Market Y-o-Y Growth (%) Projections by Distribution Channel, 2025-2035
  • Figure 67: North America Market Attractiveness by Product Type, 2025-2035
  • Figure 68: North America Market Attractiveness by Sensor & Technology, 2025-2035
  • Figure 69: North America Market Attractiveness by Application, 2025-2035
  • Figure 70: North America Market Attractiveness by End User, 2025-2035
  • Figure 71: North America Market Attractiveness by Distribution Channel, 2025-2035
  • Figure 72: North America Market Attractiveness by Country, 2025-2035
  • Figure 73: Latin America Market Value (USD Million) by Product Type, 2025-2035
  • Figure 74: Latin America Market Value (USD Million) by Sensor & Technology, 2025-2035
  • Figure 75: Latin America Market Value (USD Million) by Application, 2025-2035
  • Figure 76: Latin America Market Value (USD Million) by End User, 2025-2035
  • Figure 77: Latin America Market Value (USD Million) by Distribution Channel, 2025-2035
  • Figure 78: Latin America Market Value (USD Million) by Country, 2025-2035
  • Figure 79: Latin America Market Value (USD Million) Analysis by Country, 2020-2035
  • Figure 80: Latin America Market Volume (Units) Analysis by Country, 2020-2035
  • Figure 81: Latin America Market Value Share (%) and BPS Analysis by Country, 2025-2035
  • Figure 82: Latin America Market Y-o-Y Growth (%) Projections by Country, 2025-2035
  • Figure 83: Latin America Market Value (USD Million) Analysis by Product Type, 2020-2035
  • Figure 84: Latin America Market Volume (Units) Analysis by Product Type, 2020-2035
  • Figure 85: Latin America Market Value Share (%) and BPS Analysis by Product Type, 2025-2035
  • Figure 86: Latin America Market Y-o-Y Growth (%) Projections by Product Type, 2025-2035
  • Figure 87: Latin America Market Value (USD Million) Analysis by Sensor & Technology, 2020-2035
  • Figure 88: Latin America Market Volume (Units) Analysis by Sensor & Technology, 2020-2035
  • Figure 89: Latin America Market Value Share (%) and BPS Analysis by Sensor & Technology, 2025-2035
  • Figure 90: Latin America Market Y-o-Y Growth (%) Projections by Sensor & Technology, 2025-2035
  • Figure 91: Latin America Market Value (USD Million) Analysis by Application, 2020-2035
  • Figure 92: Latin America Market Volume (Units) Analysis by Application, 2020-2035
  • Figure 93: Latin America Market Value Share (%) and BPS Analysis by Application, 2025-2035
  • Figure 94: Latin America Market Y-o-Y Growth (%) Projections by Application, 2025-2035
  • Figure 95: Latin America Market Value (USD Million) Analysis by End User, 2020-2035
  • Figure 96: Latin America Market Volume (Units) Analysis by End User, 2020-2035
  • Figure 97: Latin America Market Value Share (%) and BPS Analysis by End User, 2025-2035
  • Figure 98: Latin America Market Y-o-Y Growth (%) Projections by End User, 2025-2035
  • Figure 99: Latin America Market Value (USD Million) Analysis by Distribution Channel, 2020-2035
  • Figure 100: Latin America Market Volume (Units) Analysis by Distribution Channel, 2020-2035
  • Figure 101: Latin America Market Value Share (%) and BPS Analysis by Distribution Channel, 2025-2035
  • Figure 102: Latin America Market Y-o-Y Growth (%) Projections by Distribution Channel, 2025-2035
  • Figure 103: Latin America Market Attractiveness by Product Type, 2025-2035
  • Figure 104: Latin America Market Attractiveness by Sensor & Technology, 2025-2035
  • Figure 105: Latin America Market Attractiveness by Application, 2025-2035
  • Figure 106: Latin America Market Attractiveness by End User, 2025-2035
  • Figure 107: Latin America Market Attractiveness by Distribution Channel, 2025-2035
  • Figure 108: Latin America Market Attractiveness by Country, 2025-2035
  • Figure 109: Europe Market Value (USD Million) by Product Type, 2025-2035
  • Figure 110: Europe Market Value (USD Million) by Sensor & Technology, 2025-2035
  • Figure 111: Europe Market Value (USD Million) by Application, 2025-2035
  • Figure 112: Europe Market Value (USD Million) by End User, 2025-2035
  • Figure 113: Europe Market Value (USD Million) by Distribution Channel, 2025-2035
  • Figure 114: Europe Market Value (USD Million) by Country, 2025-2035
  • Figure 115: Europe Market Value (USD Million) Analysis by Country, 2020-2035
  • Figure 116: Europe Market Volume (Units) Analysis by Country, 2020-2035
  • Figure 117: Europe Market Value Share (%) and BPS Analysis by Country, 2025-2035
  • Figure 118: Europe Market Y-o-Y Growth (%) Projections by Country, 2025-2035
  • Figure 119: Europe Market Value (USD Million) Analysis by Product Type, 2020-2035
  • Figure 120: Europe Market Volume (Units) Analysis by Product Type, 2020-2035
  • Figure 121: Europe Market Value Share (%) and BPS Analysis by Product Type, 2025-2035
  • Figure 122: Europe Market Y-o-Y Growth (%) Projections by Product Type, 2025-2035
  • Figure 123: Europe Market Value (USD Million) Analysis by Sensor & Technology, 2020-2035
  • Figure 124: Europe Market Volume (Units) Analysis by Sensor & Technology, 2020-2035
  • Figure 125: Europe Market Value Share (%) and BPS Analysis by Sensor & Technology, 2025-2035
  • Figure 126: Europe Market Y-o-Y Growth (%) Projections by Sensor & Technology, 2025-2035
  • Figure 127: Europe Market Value (USD Million) Analysis by Application, 2020-2035
  • Figure 128: Europe Market Volume (Units) Analysis by Application, 2020-2035
  • Figure 129: Europe Market Value Share (%) and BPS Analysis by Application, 2025-2035
  • Figure 130: Europe Market Y-o-Y Growth (%) Projections by Application, 2025-2035
  • Figure 131: Europe Market Value (USD Million) Analysis by End User, 2020-2035
  • Figure 132: Europe Market Volume (Units) Analysis by End User, 2020-2035
  • Figure 133: Europe Market Value Share (%) and BPS Analysis by End User, 2025-2035
  • Figure 134: Europe Market Y-o-Y Growth (%) Projections by End User, 2025-2035
  • Figure 135: Europe Market Value (USD Million) Analysis by Distribution Channel, 2020-2035
  • Figure 136: Europe Market Volume (Units) Analysis by Distribution Channel, 2020-2035
  • Figure 137: Europe Market Value Share (%) and BPS Analysis by Distribution Channel, 2025-2035
  • Figure 138: Europe Market Y-o-Y Growth (%) Projections by Distribution Channel, 2025-2035
  • Figure 139: Europe Market Attractiveness by Product Type, 2025-2035
  • Figure 140: Europe Market Attractiveness by Sensor & Technology, 2025-2035
  • Figure 141: Europe Market Attractiveness by Application, 2025-2035
  • Figure 142: Europe Market Attractiveness by End User, 2025-2035
  • Figure 143: Europe Market Attractiveness by Distribution Channel, 2025-2035
  • Figure 144: Europe Market Attractiveness by Country, 2025-2035
  • Figure 145: East Asia Market Value (USD Million) by Product Type, 2025-2035
  • Figure 146: East Asia Market Value (USD Million) by Sensor & Technology, 2025-2035
  • Figure 147: East Asia Market Value (USD Million) by Application, 2025-2035
  • Figure 148: East Asia Market Value (USD Million) by End User, 2025-2035
  • Figure 149: East Asia Market Value (USD Million) by Distribution Channel, 2025-2035
  • Figure 150: East Asia Market Value (USD Million) by Country, 2025-2035
  • Figure 151: East Asia Market Value (USD Million) Analysis by Country, 2020-2035
  • Figure 152: East Asia Market Volume (Units) Analysis by Country, 2020-2035
  • Figure 153: East Asia Market Value Share (%) and BPS Analysis by Country, 2025-2035
  • Figure 154: East Asia Market Y-o-Y Growth (%) Projections by Country, 2025-2035
  • Figure 155: East Asia Market Value (USD Million) Analysis by Product Type, 2020-2035
  • Figure 156: East Asia Market Volume (Units) Analysis by Product Type, 2020-2035
  • Figure 157: East Asia Market Value Share (%) and BPS Analysis by Product Type, 2025-2035
  • Figure 158: East Asia Market Y-o-Y Growth (%) Projections by Product Type, 2025-2035
  • Figure 159: East Asia Market Value (USD Million) Analysis by Sensor & Technology, 2020-2035
  • Figure 160: East Asia Market Volume (Units) Analysis by Sensor & Technology, 2020-2035
  • Figure 161: East Asia Market Value Share (%) and BPS Analysis by Sensor & Technology, 2025-2035
  • Figure 162: East Asia Market Y-o-Y Growth (%) Projections by Sensor & Technology, 2025-2035
  • Figure 163: East Asia Market Value (USD Million) Analysis by Application, 2020-2035
  • Figure 164: East Asia Market Volume (Units) Analysis by Application, 2020-2035
  • Figure 165: East Asia Market Value Share (%) and BPS Analysis by Application, 2025-2035
  • Figure 166: East Asia Market Y-o-Y Growth (%) Projections by Application, 2025-2035
  • Figure 167: East Asia Market Value (USD Million) Analysis by End User, 2020-2035
  • Figure 168: East Asia Market Volume (Units) Analysis by End User, 2020-2035
  • Figure 169: East Asia Market Value Share (%) and BPS Analysis by End User, 2025-2035
  • Figure 170: East Asia Market Y-o-Y Growth (%) Projections by End User, 2025-2035
  • Figure 171: East Asia Market Value (USD Million) Analysis by Distribution Channel, 2020-2035
  • Figure 172: East Asia Market Volume (Units) Analysis by Distribution Channel, 2020-2035
  • Figure 173: East Asia Market Value Share (%) and BPS Analysis by Distribution Channel, 2025-2035
  • Figure 174: East Asia Market Y-o-Y Growth (%) Projections by Distribution Channel, 2025-2035
  • Figure 175: East Asia Market Attractiveness by Product Type, 2025-2035
  • Figure 176: East Asia Market Attractiveness by Sensor & Technology, 2025-2035
  • Figure 177: East Asia Market Attractiveness by Application, 2025-2035
  • Figure 178: East Asia Market Attractiveness by End User, 2025-2035
  • Figure 179: East Asia Market Attractiveness by Distribution Channel, 2025-2035
  • Figure 180: East Asia Market Attractiveness by Country, 2025-2035
  • Figure 181: South Asia & Pacific Market Value (USD Million) by Product Type, 2025-2035
  • Figure 182: South Asia & Pacific Market Value (USD Million) by Sensor & Technology, 2025-2035
  • Figure 183: South Asia & Pacific Market Value (USD Million) by Application, 2025-2035
  • Figure 184: South Asia & Pacific Market Value (USD Million) by End User, 2025-2035
  • Figure 185: South Asia & Pacific Market Value (USD Million) by Distribution Channel, 2025-2035
  • Figure 186: South Asia & Pacific Market Value (USD Million) by Country, 2025-2035
  • Figure 187: South Asia & Pacific Market Value (USD Million) Analysis by Country, 2020-2035
  • Figure 188: South Asia & Pacific Market Volume (Units) Analysis by Country, 2020-2035
  • Figure 189: South Asia & Pacific Market Value Share (%) and BPS Analysis by Country, 2025-2035
  • Figure 190: South Asia & Pacific Market Y-o-Y Growth (%) Projections by Country, 2025-2035
  • Figure 191: South Asia & Pacific Market Value (USD Million) Analysis by Product Type, 2020-2035
  • Figure 192: South Asia & Pacific Market Volume (Units) Analysis by Product Type, 2020-2035
  • Figure 193: South Asia & Pacific Market Value Share (%) and BPS Analysis by Product Type, 2025-2035
  • Figure 194: South Asia & Pacific Market Y-o-Y Growth (%) Projections by Product Type, 2025-2035
  • Figure 195: South Asia & Pacific Market Value (USD Million) Analysis by Sensor & Technology, 2020-2035
  • Figure 196: South Asia & Pacific Market Volume (Units) Analysis by Sensor & Technology, 2020-2035
  • Figure 197: South Asia & Pacific Market Value Share (%) and BPS Analysis by Sensor & Technology, 2025-2035
  • Figure 198: South Asia & Pacific Market Y-o-Y Growth (%) Projections by Sensor & Technology, 2025-2035
  • Figure 199: South Asia & Pacific Market Value (USD Million) Analysis by Application, 2020-2035
  • Figure 200: South Asia & Pacific Market Volume (Units) Analysis by Application, 2020-2035
  • Figure 201: South Asia & Pacific Market Value Share (%) and BPS Analysis by Application, 2025-2035
  • Figure 202: South Asia & Pacific Market Y-o-Y Growth (%) Projections by Application, 2025-2035
  • Figure 203: South Asia & Pacific Market Value (USD Million) Analysis by End User, 2020-2035
  • Figure 204: South Asia & Pacific Market Volume (Units) Analysis by End User, 2020-2035
  • Figure 205: South Asia & Pacific Market Value Share (%) and BPS Analysis by End User, 2025-2035
  • Figure 206: South Asia & Pacific Market Y-o-Y Growth (%) Projections by End User, 2025-2035
  • Figure 207: South Asia & Pacific Market Value (USD Million) Analysis by Distribution Channel, 2020-2035
  • Figure 208: South Asia & Pacific Market Volume (Units) Analysis by Distribution Channel, 2020-2035
  • Figure 209: South Asia & Pacific Market Value Share (%) and BPS Analysis by Distribution Channel, 2025-2035
  • Figure 210: South Asia & Pacific Market Y-o-Y Growth (%) Projections by Distribution Channel, 2025-2035
  • Figure 211: South Asia & Pacific Market Attractiveness by Product Type, 2025-2035
  • Figure 212: South Asia & Pacific Market Attractiveness by Sensor & Technology, 2025-2035
  • Figure 213: South Asia & Pacific Market Attractiveness by Application, 2025-2035
  • Figure 214: South Asia & Pacific Market Attractiveness by End User, 2025-2035
  • Figure 215: South Asia & Pacific Market Attractiveness by Distribution Channel, 2025-2035
  • Figure 216: South Asia & Pacific Market Attractiveness by Country, 2025-2035
  • Figure 217: Middle East and Africa Market Value (USD Million) by Product Type, 2025-2035
  • Figure 218: Middle East and Africa Market Value (USD Million) by Sensor & Technology, 2025-2035
  • Figure 219: Middle East and Africa Market Value (USD Million) by Application, 2025-2035
  • Figure 220: Middle East and Africa Market Value (USD Million) by End User, 2025-2035
  • Figure 221: Middle East and Africa Market Value (USD Million) by Distribution Channel, 2025-2035
  • Figure 222: Middle East and Africa Market Value (USD Million) by Country, 2025-2035
  • Figure 223: Middle East and Africa Market Value (USD Million) Analysis by Country, 2020-2035
  • Figure 224: Middle East and Africa Market Volume (Units) Analysis by Country, 2020-2035
  • Figure 225: Middle East and Africa Market Value Share (%) and BPS Analysis by Country, 2025-2035
  • Figure 226: Middle East and Africa Market Y-o-Y Growth (%) Projections by Country, 2025-2035
  • Figure 227: Middle East and Africa Market Value (USD Million) Analysis by Product Type, 2020-2035
  • Figure 228: Middle East and Africa Market Volume (Units) Analysis by Product Type, 2020-2035
  • Figure 229: Middle East and Africa Market Value Share (%) and BPS Analysis by Product Type, 2025-2035
  • Figure 230: Middle East and Africa Market Y-o-Y Growth (%) Projections by Product Type, 2025-2035
  • Figure 231: Middle East and Africa Market Value (USD Million) Analysis by Sensor & Technology, 2020-2035
  • Figure 232: Middle East and Africa Market Volume (Units) Analysis by Sensor & Technology, 2020-2035
  • Figure 233: Middle East and Africa Market Value Share (%) and BPS Analysis by Sensor & Technology, 2025-2035
  • Figure 234: Middle East and Africa Market Y-o-Y Growth (%) Projections by Sensor & Technology, 2025-2035
  • Figure 235: Middle East and Africa Market Value (USD Million) Analysis by Application, 2020-2035
  • Figure 236: Middle East and Africa Market Volume (Units) Analysis by Application, 2020-2035
  • Figure 237: Middle East and Africa Market Value Share (%) and BPS Analysis by Application, 2025-2035
  • Figure 238: Middle East and Africa Market Y-o-Y Growth (%) Projections by Application, 2025-2035
  • Figure 239: Middle East and Africa Market Value (USD Million) Analysis by End User, 2020-2035
  • Figure 240: Middle East and Africa Market Volume (Units) Analysis by End User, 2020-2035
  • Figure 241: Middle East and Africa Market Value Share (%) and BPS Analysis by End User, 2025-2035
  • Figure 242: Middle East and Africa Market Y-o-Y Growth (%) Projections by End User, 2025-2035
  • Figure 243: Middle East and Africa Market Value (USD Million) Analysis by Distribution Channel, 2020-2035
  • Figure 244: Middle East and Africa Market Volume (Units) Analysis by Distribution Channel, 2020-2035
  • Figure 245: Middle East and Africa Market Value Share (%) and BPS Analysis by Distribution Channel, 2025-2035
  • Figure 246: Middle East and Africa Market Y-o-Y Growth (%) Projections by Distribution Channel, 2025-2035
  • Figure 247: Middle East and Africa Market Attractiveness by Product Type, 2025-2035
  • Figure 248: Middle East and Africa Market Attractiveness by Sensor & Technology, 2025-2035
  • Figure 249: Middle East and Africa Market Attractiveness by Application, 2025-2035
  • Figure 250: Middle East and Africa Market Attractiveness by End User, 2025-2035
  • Figure 251: Middle East and Africa Market Attractiveness by Distribution Channel, 2025-2035
  • Figure 252: Middle East and Africa Market Attractiveness by Country, 2025-2035

Frequently Asked Questions

How big is the Wearable Beauty Market in 2025?

The global Wearable Beauty Market is estimated to be valued at USD 2,785.4 million in 2025.

What will be the size of Wearable Beauty Market in 2035?

The market size for the Wearable Beauty Market is projected to reach USD 9,745.2 million by 2035.

How much will be the Wearable Beauty Market growth between 2025 and 2035?

The Wearable Beauty Market is expected to grow at a CAGR of 13.3% between 2025 and 2035.

What are the key product types in the Wearable Beauty Market?

The key product types in the Wearable Beauty Market are hydration sensors, LED light therapy masks, microcurrent devices, and others.

Which Product Type contributes significant share in the Wearable Beauty Market in 2025?

In terms of product type, LED light therapy masks are expected to command a 28.5% share in the USA Wearable Beauty Market in 2025.

Explore Similar Insights

Future Market Insights

Wearable Beauty Market