Wearable Defibrillator Patch Market Forecast and Outlook 2025 to 2035

The global wearable defibrillator patch market is projected to grow from USD 51.3 million in 2025 to approximately USD 98.1 million by 2035, recording an absolute increase of USD 46.8 million over the forecast period. This translates into a total growth of 91.2%, with the market forecast to expand at a compound annual growth rate (CAGR) of 6.7% between 2025 and 2035.
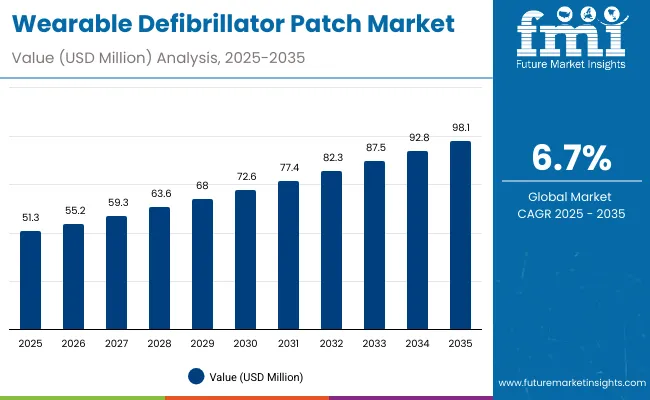
Quick Stats for Wearable Defibrillator Patch Market

  • Wearable Defibrillator Patch Market Value (2025): USD 51.3 million
  • Wearable Defibrillator Patch Market Forecast Value (2035): USD 98.1 million
  • Wearable Defibrillator Patch Market Forecast CAGR: 6.7%
  • Leading Product Technology in Wearable Defibrillator Patch Market: Single-use Electrode Patches (43.2%)
  • Key Growth Regions in Wearable Defibrillator Patch Market: North America, Europe, and Asia Pacific
  • Top Players in Wearable Defibrillator Patch Market: ZOLL Medical, Physio-Control/Stryker, Cardiac Science, Empatica

Wearable Defibrillator Patch Market

Wearable Defibrillator Patch Market Key Takeaways

Metric Value
Estimated Value in (2025E) USD 51.3 million
Forecast Value in (2035F) USD 98.1 million
Forecast CAGR (2025 to 2035) 6.7%

The overall market size is expected to grow by nearly 1.9X during the same period, supported by increasing demand for advanced cardiac monitoring technologies, growing prevalence of cardiovascular diseases, and rising adoption of wearable medical devices across the global healthcare and patient care sectors.

Between 2025 and 2030, the wearable defibrillator patch market is projected to expand from USD 51.3 million to USD 72.6 million, resulting in a value increase of USD 21.3 million, which represents 45.5% of the total forecast growth for the decade. This phase of development will be shaped by increasing cardiovascular disease prevalence, rising demand for remote patient monitoring solutions, and growing utilization in post-cardiac event care applications. Medical device manufacturers and cardiac care specialists are expanding their wearable technology capabilities to address the growing preference for continuous cardiac monitoring features in defibrillator patch systems.

From 2030 to 2035, the market is forecast to grow from USD 72.6 million to USD 98.1 million, adding another USD 25.5 million, which constitutes 54.5% of the overall ten-year expansion. This period is expected to be characterized by the expansion of advanced cardiac monitoring technologies, the integration of AI-powered arrhythmia detection systems for premium wearable defibrillator products, and the development of enhanced connectivity features for specialized applications. The growing emphasis on preventive cardiac care and patient outcome optimization will drive demand for intelligent defibrillator patches with enhanced monitoring capabilities and improved therapeutic effectiveness.

Between 2020 and 2024, the wearable defibrillator patch market experienced steady growth, driven by increasing cardiovascular disease awareness and growing recognition of wearable cardiac monitoring systems' superior patient care capabilities across hospital and home care applications. The market developed as healthcare providers recognized the potential for wearable defibrillator technology to enhance patient outcomes while meeting modern healthcare requirements for continuous monitoring and emergency intervention. Technological advancement in patch design and cardiac detection algorithms began emphasizing the critical importance of maintaining therapeutic readiness while extending patient mobility and improving quality of life effectiveness.

Opportunity Pathways - Wearable Defibrillator Patch Market

The wearable defibrillator patch market represents a rapidly emerging medical technology opportunity at the intersection of cardiac care, wearable devices, and emergency intervention, with the market projected to expand from USD 51.3 million in 2025 to USD 98.1 million by 2035 at a steady 6.7% CAGR-a 1.9X growth driven by accelerating cardiovascular disease prevalence, healthcare provider demand for continuous monitoring solutions, and the integration of advanced cardiac detection technology into portable emergency care devices.

This convergence opportunity leverages the growing need for cardiac protection, the desire for patient mobility during recovery, and advances in wearable medical technology to create products that offer life-saving intervention capabilities in a comfortable, continuously wearable format. Single-use electrode patches lead with 43.2% market share due to their reliability and ease of use, while post-myocardial infarction applications dominate demand as healthcare providers increasingly focus on preventing sudden cardiac death in high-risk patients. Geographic growth is strongest in developed markets where advanced cardiac care infrastructure and healthcare spending support adoption of premium wearable medical devices.

Pathway A - Single-use Electrode Patch Technology Leadership

The dominant product technology offers superior reliability, consistent electrical contact, and simplified patient management essential for life-critical applications. Companies developing advanced single-use electrode systems with enhanced adhesion, improved signal quality, and extended wear duration will capture the leading technology segment. Expected revenue pool: USD 35-45 million.

Pathway B - Post-Myocardial Infarction Care Applications

The largest application segment benefits from growing focus on preventing sudden cardiac death and improving post-cardiac event patient outcomes. Providers developing comprehensive post-MI monitoring solutions with integrated emergency intervention, physician connectivity, and patient education features will dominate this primary market. Opportunity: USD 40-55 million.

Pathway C - Advanced Arrhythmia Detection and AI Integration

Next-generation products require sophisticated cardiac rhythm analysis capable of distinguishing life-threatening arrhythmias from benign irregularities with minimal false positives. Companies investing in advanced AI algorithms, machine learning capabilities, and clinical validation will create competitive differentiation and premium positioning. Revenue uplift: USD 15-25 million.

Pathway D - Enhanced Patient Comfort and Wearability

Modern patients require devices that support normal daily activities while providing continuous protection. Developing products with improved adhesive systems, waterproof designs, and ergonomic form factors addresses growing patient compliance demands while reducing discontinuation rates. Expected upside: USD 10-18 million.

Pathway E - Integrated Healthcare System Connectivity

Advanced products require seamless integration with electronic health records, physician monitoring systems, and emergency response networks. Systems offering comprehensive connectivity options, real-time data transmission, and automated emergency alerts create enhanced value propositions for healthcare providers. USD 12-20 million.

Pathway F - Extended Battery Life and Reliability Features

Patients require confidence in device performance during extended wear periods, especially during sleep and physical activity. Companies developing advanced power management, battery technology, and device reliability features will capture premium positioning opportunities. Pool: USD 8-15 million.

Pathway G - Pediatric and Specialized Patient Applications

Children and patients with unique anatomical or medical requirements represent growing opportunities for specialized device variants. Developing tailored solutions for pediatric care, elderly patients, and specific cardiac conditions expands beyond standard adult applications. Expected revenue: USD 6-12 million.

Pathway H - Home Care and Remote Monitoring Integration

Healthcare cost reduction drives demand for solutions that enable safe patient discharge and home-based recovery monitoring. Companies developing comprehensive home care packages with caregiver training, remote physician oversight, and emergency coordination will capture emerging market opportunities. Pool: USD 8-14 million.

Why is the Wearable Defibrillator Patch Market Growing?

Market expansion is being supported by the increasing global prevalence of cardiovascular diseases and the corresponding shift toward wearable cardiac monitoring technologies that can provide superior patient protection while meeting healthcare requirements for continuous monitoring and emergency intervention capabilities. Modern healthcare providers and cardiac specialists are increasingly focused on incorporating wearable defibrillator patches to enhance patient outcomes while satisfying demands for advanced cardiac care technologies and portable life-saving devices. Wearable defibrillator patches' proven ability to deliver superior patient mobility, continuous protection, and emergency intervention capabilities makes them essential devices for high-risk cardiac patients and post-procedure monitoring applications.

The growing emphasis on preventive cardiac care and patient-centered treatment approaches is driving demand for high-quality wearable defibrillator patch products that can support distinctive patient experiences and comprehensive cardiac protection across post-myocardial infarction, high-risk patient, and transitional care categories. Healthcare provider preference for devices that combine continuous monitoring excellence with emergency intervention capabilities is creating opportunities for innovative wearable implementations in both hospital discharge and long-term care applications. The rising influence of remote patient monitoring and connected healthcare ecosystems is also contributing to increased adoption of premium wearable defibrillator patch products that can provide authentic healthcare integration characteristics.

Segmental Analysis

The market is segmented by product and application. The demand for products is divided into single-use electrode patches, patch defibrillator unit, monitoring software & cloud services, accessories & prep kit, and others. Based on application, the market is categorized into post-myocardial infarction (MI), newly diagnosed cardiomyopathy, ICD explant/bridge to re-implant, and other temporary high-risk patients.
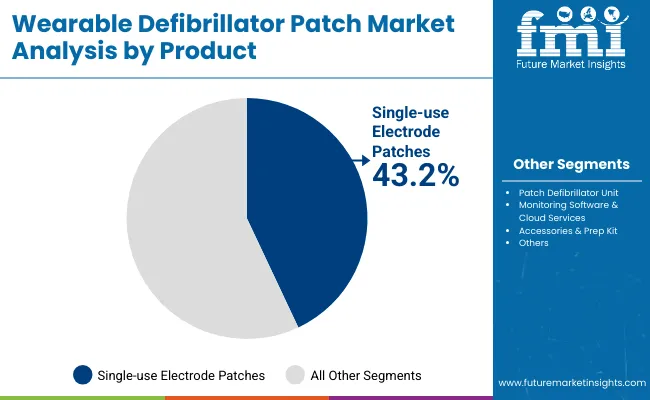
By Product, the Single-use Electrode Patches Segment Accounts for 43.2% Market Share

Wearable Defibrillator Patch Market By Product

The single-use electrode patches segment is projected to account for 43.2% of the wearable defibrillator patch market in 2025, reaffirming its position as the leading product category. Medical device manufacturers and cardiac care providers increasingly utilize single-use electrode patch technology for their superior reliability, consistent electrical contact, and ease of patient management in life-critical wearable defibrillator applications across diverse healthcare settings. Single-use electrode technology's standardized design and proven performance directly address the clinical requirements for consistent cardiac monitoring and reliable emergency intervention in wearable defibrillator operations.

This product segment forms the foundation of modern wearable cardiac protection applications, as it represents the technology with the greatest reliability potential and established compatibility across multiple patient care systems. Manufacturer investments in electrode optimization and adhesive enhancement continue to strengthen adoption among medical device producers. With healthcare providers prioritizing patient safety and device reliability, single-use electrode patch systems align with both clinical effectiveness objectives and patient comfort requirements, making them the central component of comprehensive wearable defibrillator strategies.
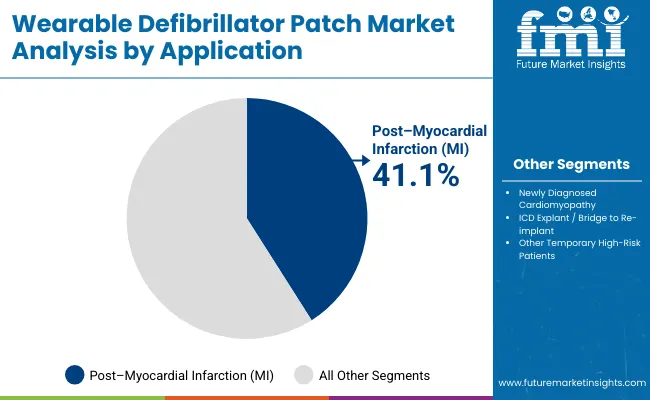
By Application, Post-Myocardial Infarction (MI) Segment Leads Market Demand

Wearable Defibrillator Patch Market By Application

Post-myocardial infarction (MI) applications are projected to represent the largest share of wearable defibrillator patch demand in 2025 at 41.1%, underscoring their critical role as the primary application for cardiac protection devices in post-cardiac event patient care and hospital discharge protocols. Healthcare providers and cardiologists prefer wearable defibrillator systems for their exceptional patient protection capabilities, continuous monitoring features, and ability to maintain therapeutic readiness while supporting patient mobility requirements during post-MI recovery periods. Positioned as essential devices for high-risk cardiac patient management, wearable defibrillator patches offer both life-saving intervention and quality of life enhancement advantages.

The segment is supported by continuous growth in post-cardiac event care protocols and the growing availability of advanced wearable cardiac technologies that enable enhanced patient outcomes and risk reduction at the post-hospital discharge level. Additionally, healthcare systems are investing in preventive cardiac care technologies to support patient safety improvement and healthcare cost optimization. As cardiovascular disease management continues to evolve and providers seek superior patient protection solutions, post-myocardial infarction applications will continue to dominate the application landscape while supporting technology advancement and patient care optimization strategies.

What are the Drivers, Restraints, and Key Trends of the Wearable Defibrillator Patch Market?

The wearable defibrillator patch market is advancing steadily due to increasing cardiovascular disease prevalence and growing demand for continuous cardiac monitoring solutions that emphasize superior patient protection across hospital discharge and high-risk patient management applications. However, the market faces challenges, including high device costs compared to traditional monitoring alternatives, technical complexity in arrhythmia detection algorithms, and competition from implantable cardiac devices. Innovation in battery life extension and patient comfort enhancement continues to influence market development and expansion patterns.

Expansion of Post-Cardiac Event Care Protocols

The growing adoption of wearable defibrillator patches in comprehensive post-myocardial infarction care and transitional cardiac monitoring applications is enabling healthcare providers to develop protocols that provide distinctive patient protection capabilities while commanding premium positioning and enhanced patient outcome characteristics. Advanced care protocols provide superior safety while allowing more sophisticated cardiac risk management across various patient categories and treatment segments. Healthcare systems are increasingly recognizing the competitive advantages of wearable cardiac protection positioning for comprehensive patient care development and cardiac specialty market penetration.

Integration of Advanced Arrhythmia Detection and AI Analytics

Modern wearable defibrillator patch suppliers are incorporating advanced cardiac rhythm analysis algorithms, machine learning systems, and predictive analytics technologies to enhance detection accuracy, improve patient outcomes, and meet healthcare provider demands for intelligent and reliable cardiac monitoring solutions. These programs improve device performance while enabling new applications, including personalized cardiac care and predictive intervention systems. Advanced AI integration also allows suppliers to support premium market positioning and clinical excellence leadership beyond traditional cardiac monitoring products.
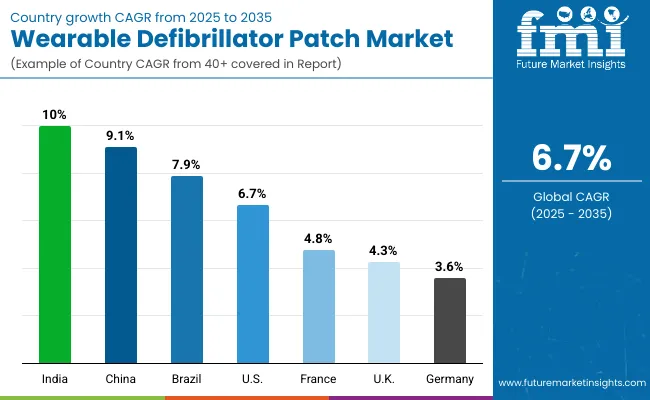
Analysis of the Wearable Defibrillator Patch Market by Key Country

Wearable Defibrillator Patch Market By Country

Country CAGR (2025 to 2035)
India 10.0%
China 9.1%
Brazil 7.9%
USA 6.7%
France 4.8%
UK 4.3%
Germany 3.6%

The wearable defibrillator patch market is experiencing robust growth globally, with India leading at a 10.0% CAGR through 2035, driven by expanding healthcare infrastructure, rising cardiovascular disease awareness, and increasing adoption of advanced cardiac monitoring technologies. China follows at 9.1%, supported by growing healthcare investments, expanding middle-class access to premium medical devices, and rising focus on preventive cardiac care. Brazil shows growth at 7.9%, emphasizing healthcare system modernization and expanding cardiac care capabilities. The USA demonstrates 6.7% growth, prioritizing advanced cardiac care innovation and comprehensive patient monitoring solutions. France records 4.8%, focusing on healthcare technology integration and patient outcome optimization. Europe exhibits 4.3% growth, supported by established cardiac care infrastructure and advanced medical device adoption. The UK demonstrates 4.3% growth, emphasizing clinical excellence and patient safety priorities. Germany shows 3.6% growth, focusing on precision medical technology and high-quality cardiac care solutions.

The report covers an in-depth analysis of 40+ countries; seven top-performing countries are highlighted below.

India Leads Global Market Growth with Healthcare Infrastructure Expansion

Revenue from wearable defibrillator patches in India is projected to exhibit exceptional growth with a CAGR of 10.0% through 2035, driven by expanding healthcare infrastructure and rising awareness of cardiovascular disease prevention across major urban and developing healthcare centers. The country's growing medical device market and increasing adoption of advanced cardiac monitoring technologies are creating substantial demand for wearable defibrillator solutions in both private and public healthcare applications. Major medical device manufacturers and cardiac care companies are establishing comprehensive distribution and clinical support capabilities to serve both domestic healthcare needs and regional export markets.

  • Rising healthcare infrastructure development and expanding cardiovascular disease awareness are driving demand for wearable defibrillator patches across healthcare providers, cardiac specialists, and medical device distributors throughout major Indian healthcare systems.
  • Strong government support for healthcare modernization and medical device accessibility is supporting the rapid adoption of advanced cardiac monitoring solutions among healthcare providers seeking to meet evolving patient care standards and clinical excellence expectations.

China Demonstrates Strong Market Potential with Healthcare Investment Growth

Revenue from wearable defibrillator patches in China is expanding at a CAGR of 9.1%, supported by growing healthcare investments, increasing middle-class access to premium medical technologies, and expanding cardiac care infrastructure with advanced monitoring capabilities. The country's developing healthcare ecosystem and expanding medical device manufacturing sector are driving demand for sophisticated wearable cardiac protection products across both urban healthcare facilities and emerging regional medical centers. International medical device companies and domestic healthcare manufacturers are establishing comprehensive production and clinical support capabilities to address growing market demand for advanced cardiac monitoring solutions.

  • Rising healthcare investment and expanding medical device accessibility are creating opportunities for wearable defibrillator patch adoption across healthcare systems, cardiac care centers, and medical device suppliers in major Chinese healthcare markets.
  • Growing government focus on healthcare quality improvement and medical technology advancement is driving the adoption of premium cardiac monitoring products among healthcare providers seeking to upgrade to advanced patient care technologies and clinical excellence standards.

Brazil Maintains Strong Position with Healthcare System Modernization

Revenue from wearable defibrillator patches in Brazil is projected to grow at a CAGR of 7.9% through 2035, driven by healthcare system modernization initiatives, expanding cardiac care capabilities, and growing focus on preventive medicine requiring advanced patient monitoring solutions. Brazil's developing healthcare infrastructure and increasing emphasis on cardiac disease prevention are creating substantial demand for both standard and premium wearable defibrillator patch varieties. Leading medical device companies and cardiac care specialists are establishing comprehensive clinical strategies to serve both Brazilian markets and growing regional healthcare demand.
  • Rising healthcare modernization and expanding cardiac care focus are driving demand for premium wearable defibrillator patch products across healthcare systems, medical device companies, and cardiac specialty providers seeking superior patient protection capabilities.
  • Strong clinical expertise and healthcare development initiatives are supporting the adoption of advanced cardiac monitoring technologies among healthcare providers prioritizing patient outcome excellence and clinical innovation in cardiovascular care applications.

USA Strengthens Market with Cardiac Care Innovation Leadership

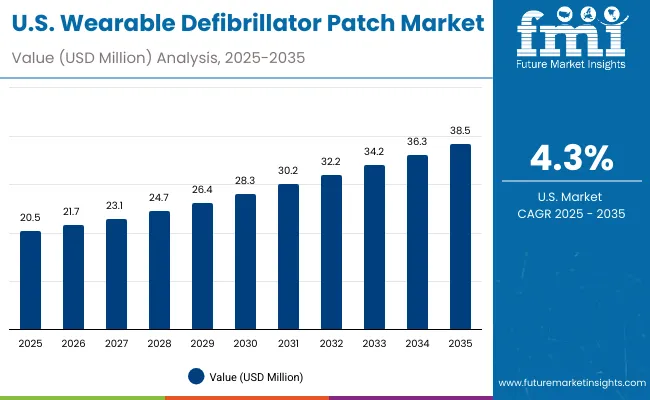
United States Wearable Defibrillator Patch Market

Revenue from wearable defibrillator patches in the United States is projected to grow at a CAGR of 6.7% through 2035, supported by the country's advanced cardiac care sector, innovation leadership capabilities, and established market for premium patient monitoring solutions. American healthcare providers and medical device manufacturers prioritize clinical excellence, patient safety, and technological advancement, making wearable defibrillator patches essential devices for both hospital discharge protocols and long-term cardiac care management. The country's comprehensive healthcare ecosystem and clinical adoption patterns support continued market development.

  • Advanced cardiac care capabilities and innovation leadership are driving demand for specialized wearable defibrillator patch products across medical device manufacturers, healthcare systems, and cardiac specialty providers serving domestic and international markets.
  • Strong focus on patient outcome excellence and clinical advancement is encouraging healthcare providers to adopt premium wearable cardiac monitoring products that support cutting-edge positioning and meet American quality standards for advanced cardiac care applications.

France Demonstrates Stable Growth with Healthcare Technology Integration

Revenue from wearable defibrillator patches in France is projected to grow at a CAGR of 4.8% through 2035, supported by the country's healthcare technology integration initiatives, advanced cardiac care development sector, and established expertise in premium medical device applications. French healthcare providers' focus on clinical excellence, patient outcome optimization, and technological innovation creates steady demand for intelligent cardiac monitoring products. The country's attention to healthcare quality and patient safety drives consistent adoption across both traditional hospital and emerging home care applications.

  • Healthcare technology integration and advanced cardiac care development are driving steady demand for wearable defibrillator patch products across medical device companies, healthcare systems, and cardiac care specialists seeking superior monitoring capabilities and patient outcome enhancement.
  • Strong innovation culture and clinical development focus are supporting the adoption of premium cardiac monitoring solutions among healthcare providers seeking to meet French quality expectations and clinical standards for advanced cardiovascular care.

UK Demonstrates Consistent Growth with Clinical Excellence Priorities

Revenue from wearable defibrillator patches in the United Kingdom is projected to grow at a CAGR of 4.3% through 2035, supported by the country's clinical excellence priorities, advanced healthcare development sector, and established focus on patient safety and cardiac care innovation. British healthcare providers' emphasis on evidence-based medicine, clinical outcomes, and patient-centered care creates steady demand for advanced cardiac monitoring products. The country's attention to healthcare quality and clinical effectiveness drives consistent adoption across both NHS and private healthcare applications.

  • Clinical excellence priorities and advanced healthcare development are driving steady demand for wearable defibrillator patch products across healthcare systems, medical device companies, and cardiac specialty providers seeking superior patient protection capabilities and clinical outcome enhancement.
  • Strong evidence-based medicine culture and clinical development focus are supporting the adoption of validated cardiac monitoring solutions among healthcare providers seeking to meet British clinical standards and patient safety expectations for advanced cardiovascular care.

Germany Maintains Focus on Precision Medical Technology

Revenue from wearable defibrillator patches in Germany is projected to grow at a CAGR of 3.6% through 2035, supported by the country's precision medical technology sector, advanced engineering capabilities, and established reputation for producing superior medical devices while working to enhance cardiac monitoring precision and develop high-quality wearable technologies. Germany's medical device industry continues to benefit from its reputation for engineering excellence while focusing on clinical innovation and manufacturing precision.
  • Precision medical technology capabilities and advanced engineering expertise are driving the development of high-quality wearable defibrillator patch products that command premium prices in international markets while supporting technological advancement and engineering excellence initiatives.
  • Growing focus on medical device innovation and cardiac care precision is supporting the adoption of advanced monitoring and intervention technologies among healthcare providers seeking to ensure clinical quality and maintain German reputation for medical technology excellence in cardiac care applications.

Europe Market Split by Country

Europe Wearable Defibrillator Patch Market

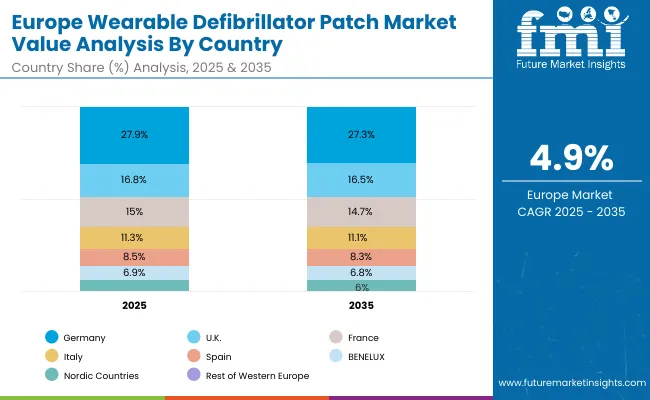
The wearable defibrillator patch market in Europe is projected to grow at a CAGR of 4.9% from 2025 to 2035. Germany is expected to maintain its leadership position with a 27.9% market share in 2025, declining slightly to 27.3% by 2035, supported by its precision medical technology sector, advanced healthcare infrastructure, and clinical capabilities serving regional and international markets.

The United Kingdom follows with a 16.8% share in 2025, projected to reach 16.5% by 2035, driven by priorities in advanced cardiac care, clinical excellence, and evidence-based patient monitoring. France holds a 15.0% share in 2025, expected to maintain 14.7% by 2035, supported by healthcare technology integration and medical device adoption, though facing challenges from competition and regulatory dynamics.

Italy accounts for 11.3% in 2025, projected to ease to 11.1% by 2035, while Spain contributes 8.5% in 2025, declining slightly to 8.3% by 2035. The Nordic Countries represent 6.9% in 2025, shifting marginally to 6.8% in 2035, while BENELUX holds 6.0% by 2035. The Rest of Western Europe region is expected to account for 7.6% in 2025, moderating to 6.0% by 2035, reflecting mixed growth dynamics across smaller and mature markets.

Japan Market Split by Country

The wearable defibrillator patch market in Japan is projected to grow steadily from 2025 to 2035, supported by advanced healthcare infrastructure, a strong cardiac care ecosystem, and adoption of digital monitoring technologies.

Single-use electrode patches are expected to maintain their leadership position with a 44.0% market share in 2025, projected to remain dominant at 43.8% by 2035, reflecting recurring demand in patient management and replacement cycles. Patch defibrillator units follow with 25.0% in 2025, expected to sustain 24.7% by 2035, supported by robust adoption across hospitals and outpatient settings.

Monitoring software & cloud services hold 22.0% in 2025, forecasted to increase marginally to 22.5% by 2035, leveraging Japan’s digital health and AI-enabled monitoring capabilities. Accessories & prep kits account for 9.0% in 2025, expected to moderate slightly to 9.0% by 2035, reflecting stable but limited growth in consumables.

South Korea Market Split by Country

The wearable defibrillator patch market in South Korea is projected to expand through 2035, driven by rapid adoption of telehealth, strong hospital integration, and increasing reliance on home-based cardiac monitoring.

Home care is expected to maintain its leadership with a 40.0% market share in 2025, projected at 40.2% by 2035, supported by consumer-driven healthcare adoption and favorable government policies for remote cardiac management. Hospitals follow closely with 36.0% in 2025, projected to sustain 35.8% by 2035, reflecting South Korea’s strong tertiary care network and technology integration in clinical practice.

Cardiology & electrophysiology clinics account for 24.0% in 2025, expected to remain steady at 24.0% by 2035, supported by specialized expertise and niche demand from referred patients requiring advanced cardiac monitoring.
Competitive Landscape of the Wearable Defibrillator Patch Market

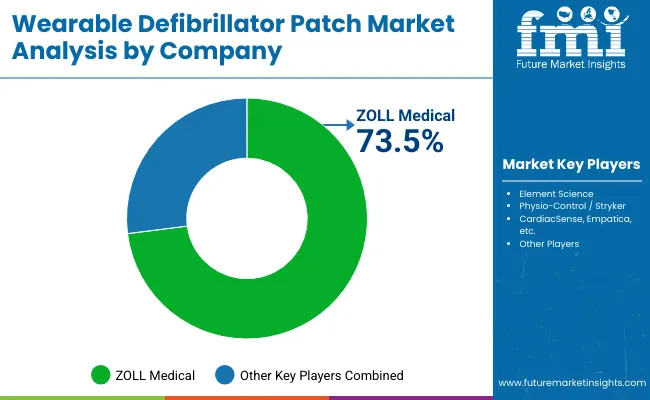
Wearable Defibrillator Patch Market By Company

The wearable defibrillator patch market is characterized by competition among established medical device companies, specialized cardiac monitoring manufacturers, and integrated healthcare technology suppliers. Companies are investing in advanced cardiac rhythm detection technologies, patient comfort optimization systems, application-specific product development, and comprehensive clinical support capabilities to deliver consistent, high-performance, and reliable wearable defibrillator products. Innovation in detection accuracy enhancement, battery life extension, and customized patient care compatibility is central to strengthening market position and healthcare provider satisfaction.

ZOLL Medical leads the market with a dominant 73.5% share, focusing on comprehensive cardiac care solutions and advanced emergency medical technologies, offering premium wearable defibrillator patch products with emphasis on clinical excellence and life-saving intervention capabilities. Other key players provide specialized cardiac monitoring and emergency response capabilities with focus on innovation and clinical support. Physio-Control/Stryker delivers integrated emergency medical solutions with emphasis on healthcare system integration and operational excellence. Cardiac Science specializes in cardiac monitoring technologies with focus on detection accuracy and clinical reliability. Empatica focuses on wearable health monitoring with emphasis on advanced sensor technology and patient experience optimization.

Key Players in the Wearable Defibrillator Patch Market

  • ZOLL Medical
  • Physio-Control/Stryker
  • Cardiac Science
  • Empatica

Scope of the Report

Items Values
Quantitative Units (2025) USD 51.3 million
Product Single-use Electrode Patches, Patch Defibrillator Unit, Monitoring Software & Cloud Services, Accessories & Prep Kit, Others
Application Post-Myocardial Infarction (MI), Newly Diagnosed Cardiomyopathy, ICD Explant/Bridge to Re-implant, Other Temporary High-Risk Patients
Regions Covered North America, Europe, East Asia, South Asia & Pacific, Latin America, Middle East & Africa
Countries Covered United States, Canada, United Kingdom, Germany, France, China, Japan, South Korea, India, Brazil, Australia and 40+ countries
Key Companies Profiled ZOLL Medical, Physio-Control/Stryker, Cardiac Science, Empatica
Additional Attributes Dollar sales by product and application, regional demand trends, competitive landscape, technological advancements in cardiac monitoring, healthcare integration initiatives, patient outcome optimization programs, and clinical excellence enhancement strategies

Wearable Defibrillator Patch Market by Segments

By Product:

  • Single-use Electrode Patches
  • Patch Defibrillator Unit
  • Monitoring Software & Cloud Services
  • Accessories & Prep Kit
  • Others

By Application:

  • Post-Myocardial Infarction (MI)
  • Newly Diagnosed Cardiomyopathy
  • ICD Explant/Bridge to Re-implant
  • Other Temporary High-Risk Patients

By Region:

  • North America
    • United States
    • Canada
    • Mexico
  • Europe
    • Germany
    • United Kingdom
    • France
    • Italy
    • Spain
    • Nordic
    • BENELUX
    • Rest of Europe
  • East Asia
    • China
    • Japan
    • South Korea
  • South Asia & Pacific
    • India
    • ASEAN
    • Australia & New Zealand
    • Rest of South Asia & Pacific
  • Latin America
    • Brazil
    • Chile
    • Rest of Latin America
  • Middle East & Africa
    • Kingdom of Saudi Arabia
    • Other GCC Countries
    • Turkiye
    • South Africa
    • Other African Union
    • Rest of Middle East & Africa

Table of Content

  1. Executive Summary
    • Global Market Outlook
    • Demand-side Trends
    • Supply-side Trends
    • Technology Roadmap Analysis
    • Analysis and Recommendations
  2. Market Overview
    • Market Coverage / Taxonomy
    • Market Definition / Scope / Limitations
  3. Market Background
    • Market Dynamics
      • Drivers
      • Restraints
      • Opportunity
      • Trends
    • Scenario Forecast
      • Demand in Optimistic Scenario
      • Demand in Likely Scenario
      • Demand in Conservative Scenario
    • Opportunity Map Analysis
    • Product Life Cycle Analysis
    • Supply Chain Analysis
      • Supply Side Participants and their Roles
        • Producers
        • Mid-Level Participants (Traders/ Agents/ Brokers)
        • Wholesalers and Distributors
      • Value Added and Value Created at Node in the Supply Chain
      • List of Raw Material Suppliers
      • List of Existing and Potential Buyer's
    • Investment Feasibility Matrix
    • Value Chain Analysis
      • Profit Margin Analysis
      • Wholesalers and Distributors
      • Retailers
    • PESTLE and Porter's Analysis
    • Regulatory Landscape
      • By Key Regions
      • By Key Countries
    • Regional Parent Market Outlook
    • Production and Consumption Statistics
    • Import and Export Statistics
  4. Global Market Analysis 2020 to 2024 and Forecast, 2025 to 2035
    • Historical Market Size Value (USD Million) & Volume (Units) Analysis, 2020 to 2024
    • Current and Future Market Size Value (USD Million) & Volume (Units) Projections, 2025 to 2035
      • Y-o-Y Growth Trend Analysis
      • Absolute $ Opportunity Analysis
  5. Global Market Pricing Analysis 2020 to 2024 and Forecast 2025 to 2035
  6. Global Market Analysis 2020 to 2024 and Forecast 2025 to 2035, By Product
    • Introduction / Key Findings
    • Historical Market Size Value (USD Million) & Volume (Units) Analysis By Product, 2020 to 2024
    • Current and Future Market Size Value (USD Million) & Volume (Units) Analysis and Forecast By Product, 2025 to 2035
      • Single-use Electrode Patches
      • Patch Defibrillator Unit
      • Monitoring Software & Cloud Services
      • Accessories & Prep Kit
      • Others
    • Y-o-Y Growth Trend Analysis By Product, 2020 to 2024
    • Absolute $ Opportunity Analysis By Product, 2025 to 2035
  7. Global Market Analysis 2020 to 2024 and Forecast 2025 to 2035, By Application
    • Introduction / Key Findings
    • Historical Market Size Value (USD Million) & Volume (Units) Analysis By Application, 2020 to 2024
    • Current and Future Market Size Value (USD Million) & Volume (Units) Analysis and Forecast By Application, 2025 to 2035
      • Post-Myocardial Infarction (MI)
      • Newly Diagnosed Cardiomyopathy
      • ICD Explant/Bridge to Re-implant
      • Other Temporary High-Risk Patients
    • Y-o-Y Growth Trend Analysis By Application, 2020 to 2024
    • Absolute $ Opportunity Analysis By Application, 2025 to 2035
  8. Global Market Analysis 2020 to 2024 and Forecast 2025 to 2035, By Region
    • Introduction
    • Historical Market Size Value (USD Million) & Volume (Units) Analysis By Region, 2020 to 2024
    • Current Market Size Value (USD Million) & Volume (Units) Analysis and Forecast By Region, 2025 to 2035
      • North America
      • Europe
      • East Asia
      • South Asia & Pacific
      • Latin America
      • Middle East & Africa
    • Market Attractiveness Analysis By Region
  9. North America Market Analysis 2020 to 2024 and Forecast 2025 to 2035, By Country
    • Historical Market Size Value (USD Million) & Volume (Units) Trend Analysis By Market Taxonomy, 2020 to 2024
    • Market Size Value (USD Million) & Volume (Units) Forecast By Market Taxonomy, 2025 to 2035
      • By Country
        • USA
        • Canada
        • Mexico
      • By Product
      • By Application
    • Market Attractiveness Analysis
      • By Country
      • By Product
      • By Application
    • Key Takeaways
  10. Europe Market Analysis 2020 to 2024 and Forecast 2025 to 2035, By Country
    • Historical Market Size Value (USD Million) & Volume (Units) Trend Analysis By Market Taxonomy, 2020 to 2024
    • Market Size Value (USD Million) & Volume (Units) Forecast By Market Taxonomy, 2025 to 2035
      • By Country
        • Germany
        • UK
        • France
        • Italy
        • Spain
        • Nordic Countries
        • BENELUX
        • Rest of Europe
      • By Product
      • By Application
    • Market Attractiveness Analysis
      • By Country
      • By Product
      • By Application
    • Key Takeaways
  11. East Asia Market Analysis 2020 to 2024 and Forecast 2025 to 2035, By Country
    • Historical Market Size Value (USD Million) & Volume (Units) Trend Analysis By Market Taxonomy, 2020 to 2024
    • Market Size Value (USD Million) & Volume (Units) Forecast By Market Taxonomy, 2025 to 2035
      • By Country
        • China
        • Japan
        • South Korea
      • By Product
      • By Application
    • Market Attractiveness Analysis
      • By Country
      • By Product
      • By Application
    • Key Takeaways
  12. South Asia & Pacific Market Analysis 2020 to 2024 and Forecast 2025 to 2035, By Country
    • Historical Market Size Value (USD Million) & Volume (Units) Trend Analysis By Market Taxonomy, 2020 to 2024
    • Market Size Value (USD Million) & Volume (Units) Forecast By Market Taxonomy, 2025 to 2035
      • By Country
        • India
        • ASEAN Countries
        • Australia & New Zealand
        • Rest of South Asia & Pacific
      • By Product
      • By Application
    • Market Attractiveness Analysis
      • By Country
      • By Product
      • By Application
    • Key Takeaways
  13. Latin America Market Analysis 2020 to 2024 and Forecast 2025 to 2035, By Country
    • Historical Market Size Value (USD Million) & Volume (Units) Trend Analysis By Market Taxonomy, 2020 to 2024
    • Market Size Value (USD Million) & Volume (Units) Forecast By Market Taxonomy, 2025 to 2035
      • By Country
        • Brazil
        • Chile
        • Rest of Latin America
      • By Product
      • By Application
    • Market Attractiveness Analysis
      • By Country
      • By Product
      • By Application
    • Key Takeaways
  14. Middle East & Africa Market Analysis 2020 to 2024 and Forecast 2025 to 2035, By Country
    • Historical Market Size Value (USD Million) & Volume (Units) Trend Analysis By Market Taxonomy, 2020 to 2024
    • Market Size Value (USD Million) & Volume (Units) Forecast By Market Taxonomy, 2025 to 2035
      • By Country
        • Kingdom of Saudi Arabia
        • Other GCC Countries
        • Türkiye
        • South Africa
        • Other African Union
        • Rest of Middle East & Africa
      • By Product
      • By Application
    • Market Attractiveness Analysis
      • By Country
      • By Product
      • By Application
    • Key Takeaways
  15. Key Countries Market Analysis
    • USA
      • Pricing Analysis
      • Market Share Analysis, 2024
        • By Product
        • By Application
    • Germany
      • Pricing Analysis
      • Market Share Analysis, 2024
        • By Product
        • By Application
    • China
      • Pricing Analysis
      • Market Share Analysis, 2024
        • By Product
        • By Application
    • India
      • Pricing Analysis
      • Market Share Analysis, 2024
        • By Product
        • By Application
    • Japan
      • Pricing Analysis
      • Market Share Analysis, 2024
        • By Product
        • By Application
    • Brazil
      • Pricing Analysis
      • Market Share Analysis, 2024
        • By Product
        • By Application
    • France
      • Pricing Analysis
      • Market Share Analysis, 2024
        • By Product
        • By Application
    • UK
      • Pricing Analysis
      • Market Share Analysis, 2024
        • By Product
        • By Application
  16. Market Structure Analysis
    • Competition Dashboard
    • Competition Benchmarking
    • Market Share Analysis of Top Players
      • By Regional
      • By Product
      • By Application
  17. Competition Analysis
    • Competition Deep Dive
      • ZOLL Medical
        • Overview
        • Product Portfolio
        • Profitability by Market Segments (Product/Age/Sales Channel/Region)
        • Sales Footprint
        • Strategy Overview
          • Marketing Strategy
          • Product Strategy
          • Channel Strategy
      • Physio-Control/Stryker
        • Overview
        • Product Portfolio
        • Profitability by Market Segments (Product/Age/Sales Channel/Region)
        • Sales Footprint
        • Strategy Overview
          • Marketing Strategy
          • Product Strategy
          • Channel Strategy
      • Cardiac Science
        • Overview
        • Product Portfolio
        • Profitability by Market Segments (Product/Age/Sales Channel/Region)
        • Sales Footprint
        • Strategy Overview
          • Marketing Strategy
          • Product Strategy
          • Channel Strategy
      • Empatica
        • Overview
        • Product Portfolio
        • Profitability by Market Segments (Product/Age/Sales Channel/Region)
        • Sales Footprint
        • Strategy Overview
          • Marketing Strategy
          • Product Strategy
          • Channel Strategy
      • Advanced Cardiac Monitoring Inc.
        • Overview
        • Product Portfolio
        • Profitability by Market Segments (Product/Age/Sales Channel/Region)
        • Sales Footprint
        • Strategy Overview
          • Marketing Strategy
          • Product Strategy
          • Channel Strategy
      • CardioTech Solutions
        • Overview
        • Product Portfolio
        • Profitability by Market Segments (Product/Age/Sales Channel/Region)
        • Sales Footprint
        • Strategy Overview
          • Marketing Strategy
          • Product Strategy
          • Channel Strategy
      • WearableTech Medical
        • Overview
        • Product Portfolio
        • Profitability by Market Segments (Product/Age/Sales Channel/Region)
        • Sales Footprint
        • Strategy Overview
          • Marketing Strategy
          • Product Strategy
          • Channel Strategy
      • LifeSaver Technologies
        • Overview
        • Product Portfolio
        • Profitability by Market Segments (Product/Age/Sales Channel/Region)
        • Sales Footprint
        • Strategy Overview
          • Marketing Strategy
          • Product Strategy
          • Channel Strategy
      • Cardiac Innovations Ltd.
        • Overview
        • Product Portfolio
        • Profitability by Market Segments (Product/Age/Sales Channel/Region)
        • Sales Footprint
        • Strategy Overview
          • Marketing Strategy
          • Product Strategy
          • Channel Strategy
      • MedTech Wearables Corp
        • Overview
        • Product Portfolio
        • Profitability by Market Segments (Product/Age/Sales Channel/Region)
        • Sales Footprint
        • Strategy Overview
          • Marketing Strategy
          • Product Strategy
          • Channel Strategy
  18. Assumptions & Acronyms Used
  19. Research Methodology

List of Tables

  • Table 1: Global Market Value (USD Million) Forecast by Region, 2020-2035
  • Table 2: Global Market Volume (Units) Forecast by Region, 2020-2035
  • Table 3: Global Market Value (USD Million) Forecast by Product, 2020-2035
  • Table 4: Global Market Volume (Units) Forecast by Product, 2020-2035
  • Table 5: Global Market Value (USD Million) Forecast by Application, 2020-2035
  • Table 6: Global Market Volume (Units) Forecast by Application, 2020-2035
  • Table 7: North America Market Value (USD Million) Forecast by Country, 2020-2035
  • Table 8: North America Market Volume (Units) Forecast by Country, 2020-2035
  • Table 9: North America Market Value (USD Million) Forecast by Product, 2020-2035
  • Table 10: North America Market Volume (Units) Forecast by Product, 2020-2035
  • Table 11: North America Market Value (USD Million) Forecast by Application, 2020-2035
  • Table 12: North America Market Volume (Units) Forecast by Application, 2020-2035
  • Table 13: Europe Market Value (USD Million) Forecast by Country, 2020-2035
  • Table 14: Europe Market Volume (Units) Forecast by Country, 2020-2035
  • Table 15: Europe Market Value (USD Million) Forecast by Product, 2020-2035
  • Table 16: Europe Market Volume (Units) Forecast by Product, 2020-2035
  • Table 17: Europe Market Value (USD Million) Forecast by Application, 2020-2035
  • Table 18: Europe Market Volume (Units) Forecast by Application, 2020-2035
  • Table 19: East Asia Market Value (USD Million) Forecast by Country, 2020-2035
  • Table 20: East Asia Market Volume (Units) Forecast by Country, 2020-2035
  • Table 21: East Asia Market Value (USD Million) Forecast by Product, 2020-2035
  • Table 22: East Asia Market Volume (Units) Forecast by Product, 2020-2035
  • Table 23: East Asia Market Value (USD Million) Forecast by Application, 2020-2035
  • Table 24: East Asia Market Volume (Units) Forecast by Application, 2020-2035
  • Table 25: South Asia & Pacific Market Value (USD Million) Forecast by Country, 2020-2035
  • Table 26: South Asia & Pacific Market Volume (Units) Forecast by Country, 2020-2035
  • Table 27: South Asia & Pacific Market Value (USD Million) Forecast by Product, 2020-2035
  • Table 28: South Asia & Pacific Market Volume (Units) Forecast by Product, 2020-2035
  • Table 29: South Asia & Pacific Market Value (USD Million) Forecast by Application, 2020-2035
  • Table 30: South Asia & Pacific Market Volume (Units) Forecast by Application, 2020-2035
  • Table 31: Latin America Market Value (USD Million) Forecast by Country, 2020-2035
  • Table 32: Latin America Market Volume (Units) Forecast by Country, 2020-2035
  • Table 33: Latin America Market Value (USD Million) Forecast by Product, 2020-2035
  • Table 34: Latin America Market Volume (Units) Forecast by Product, 2020-2035
  • Table 35: Latin America Market Value (USD Million) Forecast by Application, 2020-2035
  • Table 36: Latin America Market Volume (Units) Forecast by Application, 2020-2035
  • Table 37: Middle East & Africa Market Value (USD Million) Forecast by Country, 2020-2035
  • Table 38: Middle East & Africa Market Volume (Units) Forecast by Country, 2020-2035
  • Table 39: Middle East & Africa Market Value (USD Million) Forecast by Product, 2020-2035
  • Table 40: Middle East & Africa Market Volume (Units) Forecast by Product, 2020-2035
  • Table 41: Middle East & Africa Market Value (USD Million) Forecast by Application, 2020-2035
  • Table 42: Middle East & Africa Market Volume (Units) Forecast by Application, 2020-2035
  • Table 43: USA Market Value (USD Million) Forecast by Product, 2020-2035
  • Table 44: USA Market Volume (Units) Forecast by Product, 2020-2035
  • Table 45: USA Market Value (USD Million) Forecast by Application, 2020-2035
  • Table 46: USA Market Volume (Units) Forecast by Application, 2020-2035
  • Table 47: Canada Market Value (USD Million) Forecast by Product, 2020-2035
  • Table 48: Canada Market Volume (Units) Forecast by Product, 2020-2035
  • Table 49: Canada Market Value (USD Million) Forecast by Application, 2020-2035
  • Table 50: Canada Market Volume (Units) Forecast by Application, 2020-2035
  • Table 51: Mexico Market Value (USD Million) Forecast by Product, 2020-2035
  • Table 52: Mexico Market Volume (Units) Forecast by Product, 2020-2035
  • Table 53: Mexico Market Value (USD Million) Forecast by Application, 2020-2035
  • Table 54: Mexico Market Volume (Units) Forecast by Application, 2020-2035
  • Table 55: Germany Market Value (USD Million) Forecast by Product, 2020-2035
  • Table 56: Germany Market Volume (Units) Forecast by Product, 2020-2035
  • Table 57: Germany Market Value (USD Million) Forecast by Application, 2020-2035
  • Table 58: Germany Market Volume (Units) Forecast by Application, 2020-2035
  • Table 59: UK Market Value (USD Million) Forecast by Product, 2020-2035
  • Table 60: UK Market Volume (Units) Forecast by Product, 2020-2035
  • Table 61: UK Market Value (USD Million) Forecast by Application, 2020-2035
  • Table 62: UK Market Volume (Units) Forecast by Application, 2020-2035
  • Table 63: France Market Value (USD Million) Forecast by Product, 2020-2035
  • Table 64: France Market Volume (Units) Forecast by Product, 2020-2035
  • Table 65: France Market Value (USD Million) Forecast by Application, 2020-2035
  • Table 66: France Market Volume (Units) Forecast by Application, 2020-2035
  • Table 67: Italy Market Value (USD Million) Forecast by Product, 2020-2035
  • Table 68: Italy Market Volume (Units) Forecast by Product, 2020-2035
  • Table 69: Italy Market Value (USD Million) Forecast by Application, 2020-2035
  • Table 70: Italy Market Volume (Units) Forecast by Application, 2020-2035
  • Table 71: Spain Market Value (USD Million) Forecast by Product, 2020-2035
  • Table 72: Spain Market Volume (Units) Forecast by Product, 2020-2035
  • Table 73: Spain Market Value (USD Million) Forecast by Application, 2020-2035
  • Table 74: Spain Market Volume (Units) Forecast by Application, 2020-2035
  • Table 75: Nordic Countries Market Value (USD Million) Forecast by Product, 2020-2035
  • Table 76: Nordic Countries Market Volume (Units) Forecast by Product, 2020-2035
  • Table 77: Nordic Countries Market Value (USD Million) Forecast by Application, 2020-2035
  • Table 78: Nordic Countries Market Volume (Units) Forecast by Application, 2020-2035
  • Table 79: BENELUX Market Value (USD Million) Forecast by Product, 2020-2035
  • Table 80: BENELUX Market Volume (Units) Forecast by Product, 2020-2035
  • Table 81: BENELUX Market Value (USD Million) Forecast by Application, 2020-2035
  • Table 82: BENELUX Market Volume (Units) Forecast by Application, 2020-2035
  • Table 83: China Market Value (USD Million) Forecast by Product, 2020-2035
  • Table 84: China Market Volume (Units) Forecast by Product, 2020-2035
  • Table 85: China Market Value (USD Million) Forecast by Application, 2020-2035
  • Table 86: China Market Volume (Units) Forecast by Application, 2020-2035
  • Table 87: Japan Market Value (USD Million) Forecast by Product, 2020-2035
  • Table 88: Japan Market Volume (Units) Forecast by Product, 2020-2035
  • Table 89: Japan Market Value (USD Million) Forecast by Application, 2020-2035
  • Table 90: Japan Market Volume (Units) Forecast by Application, 2020-2035
  • Table 91: South Korea Market Value (USD Million) Forecast by Product, 2020-2035
  • Table 92: South Korea Market Volume (Units) Forecast by Product, 2020-2035
  • Table 93: South Korea Market Value (USD Million) Forecast by Application, 2020-2035
  • Table 94: South Korea Market Volume (Units) Forecast by Application, 2020-2035
  • Table 95: India Market Value (USD Million) Forecast by Product, 2020-2035
  • Table 96: India Market Volume (Units) Forecast by Product, 2020-2035
  • Table 97: India Market Value (USD Million) Forecast by Application, 2020-2035
  • Table 98: India Market Volume (Units) Forecast by Application, 2020-2035
  • Table 99: ASEAN Countries Market Value (USD Million) Forecast by Product, 2020-2035
  • Table 100: ASEAN Countries Market Volume (Units) Forecast by Product, 2020-2035
  • Table 101: ASEAN Countries Market Value (USD Million) Forecast by Application, 2020-2035
  • Table 102: ASEAN Countries Market Volume (Units) Forecast by Application, 2020-2035
  • Table 103: Australia & New Zealand Market Value (USD Million) Forecast by Product, 2020-2035
  • Table 104: Australia & New Zealand Market Volume (Units) Forecast by Product, 2020-2035
  • Table 105: Australia & New Zealand Market Value (USD Million) Forecast by Application, 2020-2035
  • Table 106: Australia & New Zealand Market Volume (Units) Forecast by Application, 2020-2035
  • Table 107: Brazil Market Value (USD Million) Forecast by Product, 2020-2035
  • Table 108: Brazil Market Volume (Units) Forecast by Product, 2020-2035
  • Table 109: Brazil Market Value (USD Million) Forecast by Application, 2020-2035
  • Table 110: Brazil Market Volume (Units) Forecast by Application, 2020-2035
  • Table 111: Chile Market Value (USD Million) Forecast by Product, 2020-2035
  • Table 112: Chile Market Volume (Units) Forecast by Product, 2020-2035
  • Table 113: Chile Market Value (USD Million) Forecast by Application, 2020-2035
  • Table 114: Chile Market Volume (Units) Forecast by Application, 2020-2035
  • Table 115: Kingdom of Saudi Arabia Market Value (USD Million) Forecast by Product, 2020-2035
  • Table 116: Kingdom of Saudi Arabia Market Volume (Units) Forecast by Product, 2020-2035
  • Table 117: Kingdom of Saudi Arabia Market Value (USD Million) Forecast by Application, 2020-2035
  • Table 118: Kingdom of Saudi Arabia Market Volume (Units) Forecast by Application, 2020-2035
  • Table 119: Other GCC Countries Market Value (USD Million) Forecast by Product, 2020-2035
  • Table 120: Other GCC Countries Market Volume (Units) Forecast by Product, 2020-2035
  • Table 121: Other GCC Countries Market Value (USD Million) Forecast by Application, 2020-2035
  • Table 122: Other GCC Countries Market Volume (Units) Forecast by Application, 2020-2035
  • Table 123: Türkiye Market Value (USD Million) Forecast by Product, 2020-2035
  • Table 124: Türkiye Market Volume (Units) Forecast by Product, 2020-2035
  • Table 125: Türkiye Market Value (USD Million) Forecast by Application, 2020-2035
  • Table 126: Türkiye Market Volume (Units) Forecast by Application, 2020-2035
  • Table 127: South Africa Market Value (USD Million) Forecast by Product, 2020-2035
  • Table 128: South Africa Market Volume (Units) Forecast by Product, 2020-2035
  • Table 129: South Africa Market Value (USD Million) Forecast by Application, 2020-2035
  • Table 130: South Africa Market Volume (Units) Forecast by Application, 2020-2035
  • Table 131: Single-use Electrode Patches Market Value (USD Million) Forecast by Region, 2020-2035
  • Table 132: Single-use Electrode Patches Market Volume (Units) Forecast by Region, 2020-2035
  • Table 133: Patch Defibrillator Unit Market Value (USD Million) Forecast by Region, 2020-2035
  • Table 134: Patch Defibrillator Unit Market Volume (Units) Forecast by Region, 2020-2035
  • Table 135: Monitoring Software & Cloud Services Market Value (USD Million) Forecast by Region, 2020-2035
  • Table 136: Monitoring Software & Cloud Services Market Volume (Units) Forecast by Region, 2020-2035
  • Table 137: Accessories & Prep Kit Market Value (USD Million) Forecast by Region, 2020-2035
  • Table 138: Accessories & Prep Kit Market Volume (Units) Forecast by Region, 2020-2035
  • Table 139: Others Product Market Value (USD Million) Forecast by Region, 2020-2035
  • Table 140: Others Product Market Volume (Units) Forecast by Region, 2020-2035
  • Table 141: Post-Myocardial Infarction (MI) Application Market Value (USD Million) Forecast by Region, 2020-2035
  • Table 142: Post-Myocardial Infarction (MI) Application Market Volume (Units) Forecast by Region, 2020-2035
  • Table 143: Newly Diagnosed Cardiomyopathy Application Market Value (USD Million) Forecast by Region, 2020-2035
  • Table 144: Newly Diagnosed Cardiomyopathy Application Market Volume (Units) Forecast by Region, 2020-2035
  • Table 145: ICD Explant/Bridge to Re-implant Application Market Value (USD Million) Forecast by Region, 2020-2035
  • Table 146: ICD Explant/Bridge to Re-implant Application Market Volume (Units) Forecast by Region, 2020-2035
  • Table 147: Other Temporary High-Risk Patients Application Market Value (USD Million) Forecast by Region, 2020-2035
  • Table 148: Other Temporary High-Risk Patients Application Market Volume (Units) Forecast by Region, 2020-2035
  • Table 149: ZOLL Medical Market Share Analysis by Product, 2020-2024
  • Table 150: ZOLL Medical Market Share Analysis by Application, 2020-2024
  • Table 151: ZOLL Medical Market Share Analysis by Region, 2020-2024
  • Table 152: ZOLL Medical Revenue Analysis by Market Segments, 2020-2024
  • Table 153: ZOLL Medical Profitability Analysis by Sales Channel, 2020-2024
  • Table 154: ZOLL Medical Strategic Initiatives Analysis, 2020-2024
  • Table 155: Physio-Control/Stryker Market Share Analysis by Product, 2020-2024
  • Table 156: Physio-Control/Stryker Market Share Analysis by Application, 2020-2024
  • Table 157: Physio-Control/Stryker Market Share Analysis by Region, 2020-2024
  • Table 158: Physio-Control/Stryker Revenue Analysis by Market Segments, 2020-2024
  • Table 159: Physio-Control/Stryker Profitability Analysis by Sales Channel, 2020-2024
  • Table 160: Physio-Control/Stryker Strategic Initiatives Analysis, 2020-2024
  • Table 161: Cardiac Science Market Share Analysis by Product, 2020-2024
  • Table 162: Cardiac Science Market Share Analysis by Application, 2020-2024
  • Table 163: Cardiac Science Market Share Analysis by Region, 2020-2024
  • Table 164: Cardiac Science Revenue Analysis by Market Segments, 2020-2024
  • Table 165: Cardiac Science Profitability Analysis by Sales Channel, 2020-2024
  • Table 166: Cardiac Science Strategic Initiatives Analysis, 2020-2024
  • Table 167: Empatica Market Share Analysis by Product, 2020-2024
  • Table 168: Empatica Market Share Analysis by Application, 2020-2024
  • Table 169: Empatica Market Share Analysis by Region, 2020-2024
  • Table 170: Empatica Revenue Analysis by Market Segments, 2020-2024
  • Table 171: Empatica Profitability Analysis by Sales Channel, 2020-2024
  • Table 172: Empatica Strategic Initiatives Analysis, 2020-2024
  • Table 173: Advanced Cardiac Monitoring Inc. Market Share Analysis by Product, 2020-2024
  • Table 174: Advanced Cardiac Monitoring Inc. Market Share Analysis by Application, 2020-2024
  • Table 175: Advanced Cardiac Monitoring Inc. Market Share Analysis by Region, 2020-2024
  • Table 176: CardioTech Solutions Market Share Analysis by Product, 2020-2024
  • Table 177: CardioTech Solutions Market Share Analysis by Application, 2020-2024
  • Table 178: CardioTech Solutions Market Share Analysis by Region, 2020-2024
  • Table 179: WearableTech Medical Market Share Analysis by Product, 2020-2024
  • Table 180: WearableTech Medical Market Share Analysis by Application, 2020-2024
  • Table 181: WearableTech Medical Market Share Analysis by Region, 2020-2024
  • Table 182: LifeSaver Technologies Market Share Analysis by Product, 2020-2024
  • Table 183: LifeSaver Technologies Market Share Analysis by Application, 2020-2024
  • Table 184: LifeSaver Technologies Market Share Analysis by Region, 2020-2024
  • Table 185: Cardiac Innovations Ltd. Market Share Analysis by Product, 2020-2024
  • Table 186: Cardiac Innovations Ltd. Market Share Analysis by Application, 2020-2024
  • Table 187: Cardiac Innovations Ltd. Market Share Analysis by Region, 2020-2024
  • Table 188: MedTech Wearables Corp Market Share Analysis by Product, 2020-2024
  • Table 189: MedTech Wearables Corp Market Share Analysis by Application, 2020-2024
  • Table 190: MedTech Wearables Corp Market Share Analysis by Region, 2020-2024
  • Table 191: Global Market Competition Matrix by Key Players, 2024
  • Table 192: Global Market Price Analysis by Product, 2020-2024
  • Table 193: Global Market Price Forecast by Product, 2025-2035
  • Table 194: Global Market Price Analysis by Region, 2020-2024
  • Table 195: Global Market Price Forecast by Region, 2025-2035
  • Table 196: Global Market Investment Feasibility Matrix by Region, 2025-2035
  • Table 197: Global Market Opportunity Analysis by Product, 2025-2035
  • Table 198: Global Market Opportunity Analysis by Application, 2025-2035
  • Table 199: Global Market Opportunity Analysis by Region, 2025-2035
  • Table 200: Global Market Technology Roadmap Analysis, 2025-2035
  • Table 201: Global Market Regulatory Impact Analysis by Region, 2025-2035
  • Table 202: Global Market Supply Chain Analysis by Key Components, 2025-2035
  • Table 203: Global Market Raw Material Supplier Analysis, 2024
  • Table 204: Global Market Distribution Channel Analysis by Region, 2024
  • Table 205: Global Market PESTLE Analysis by Region, 2025-2035
  • Table 206: Global Market Porter's Five Forces Analysis, 2024
  • Table 207: Global Market Value Chain Analysis by Key Stakeholders, 2024
  • Table 208: Global Market Market Entry Barriers Analysis by Region, 2024
  • Table 209: Global Market Customer Segmentation Analysis, 2024
  • Table 210: Global Market Adoption Rate Analysis by Product, 2020-2024
  • Table 211: Global Market Adoption Rate Analysis by Application, 2020-2024
  • Table 212: Global Market Adoption Rate Analysis by Region, 2020-2024
  • Table 213: Global Market Innovation Pipeline Analysis, 2025-2035
  • Table 214: Global Market Patent Activity Analysis by Company, 2020-2024
  • Table 215: Global Market R&D Investment Analysis by Company, 2020-2024
  • Table 216: Global Market Clinical Trial Activity Analysis, 2020-2024
  • Table 217: Global Market Regulatory Approval Timeline Analysis, 2020-2024
  • Table 218: Global Market Reimbursement Landscape Analysis by Region, 2024
  • Table 219: Global Market Healthcare Provider Adoption Analysis, 2024
  • Table 220: Global Market Patient Acceptance Analysis, 2024
  • Table 221: Global Market Key Success Factors Analysis, 2024
  • Table 222: Global Market Risk Analysis by Region, 2025-2035
  • Table 223: Global Market Scenario Analysis (Optimistic/Likely/Conservative), 2025-2035
  • Table 224: Global Market Sensitivity Analysis by Key Variables, 2025-2035
  • Table 225: Global Market Impact Analysis of COVID-19, 2020-2024
  • Table 226: Global Market Impact Analysis of Economic Factors, 2020-2024
  • Table 227: Global Market Impact Analysis of Regulatory Changes, 2020-2024
  • Table 228: Global Market Impact Analysis of Technology Disruption, 2025-2035
  • Table 229: Global Market Merger & Acquisition Activity Analysis, 2020-2024
  • Table 230: Global Market Partnership & Collaboration Analysis, 2020-2024
  • Table 231: Global Market Funding & Investment Activity Analysis, 2020-2024
  • Table 232: Global Market New Product Launch Analysis, 2020-2024
  • Table 233: Global Market Market Expansion Strategy Analysis by Company, 2024
  • Table 234: Global Market Key Performance Indicators (KPIs) by Company, 2024
  • Table 235: Global Market Financial Performance Analysis by Key Players, 2020-2024
  • Table 236: Global Market Market Share Evolution Analysis, 2020-2024
  • Table 237: Global Market Competitive Positioning Analysis, 2024
  • Table 238: Global Market SWOT Analysis by Key Players, 2024
  • Table 239: Global Market Strategic Recommendations by Region, 2025-2035
  • Table 240: Global Market Strategic Recommendations by Product, 2025-2035
  • Table 241: Global Market Strategic Recommendations by Application, 2025-2035
  • Table 242: Global Market Investment Opportunities Ranking, 2025-2035
  • Table 243: Global Market Growth Potential Assessment by Segment, 2025-2035
  • Table 244: Global Market Future Trends Forecast, 2025-2035
  • Table 245: Global Market Technology Evolution Roadmap, 2025-2035
  • Table 246: Global Market Market Maturity Analysis by Region, 2024
  • Table 247: Global Market Sustainability and ESG Impact Analysis, 2024
  • Table 248: Global Market Digital Transformation Impact Analysis, 2025-2035
  • Table 249: Global Market Key Assumptions and Limitations, 2025-2035
  • Table 250: Global Market Methodology and Data Sources, 2024

List of Figures

  • Figure 1: Global Market Value (USD Million) by Product, 2025-2035
  • Figure 2: Global Market Value (USD Million) by Application, 2025-2035
  • Figure 3: Global Market Value (USD Million) by Region, 2025-2035
  • Figure 4: Global Market Value (USD Million) Analysis by Region, 2020-2035
  • Figure 5: Global Market Volume (Units) Analysis by Region, 2020-2035
  • Figure 6: Global Market Value Share (%) and BPS Analysis by Region, 2025-2035
  • Figure 7: Global Market Y-o-Y Growth (%) Projections by Region, 2025-2035
  • Figure 8: Global Market Value (USD Million) Analysis by Product, 2020-2035
  • Figure 9: Global Market Volume (Units) Analysis by Product, 2020-2035
  • Figure 10: Global Market Value Share (%) and BPS Analysis by Product, 2025-2035
  • Figure 11: Global Market Y-o-Y Growth (%) Projections by Product, 2025-2035
  • Figure 12: Global Market Value (USD Million) Analysis by Application, 2020-2035
  • Figure 13: Global Market Volume (Units) Analysis by Application, 2020-2035
  • Figure 14: Global Market Value Share (%) and BPS Analysis by Application, 2025-2035
  • Figure 15: Global Market Y-o-Y Growth (%) Projections by Application, 2025-2035
  • Figure 16: Global Market Attractiveness by Product, 2025-2035
  • Figure 17: Global Market Attractiveness by Application, 2025-2035
  • Figure 18: Global Market Attractiveness by Region, 2025-2035
  • Figure 19: North America Market Value (USD Million) by Product, 2025-2035
  • Figure 20: North America Market Value (USD Million) by Application, 2025-2035
  • Figure 21: North America Market Value (USD Million) by Country, 2025-2035
  • Figure 22: North America Market Value (USD Million) Analysis by Country, 2020-2035
  • Figure 23: North America Market Volume (Units) Analysis by Country, 2020-2035
  • Figure 24: North America Market Value Share (%) and BPS Analysis by Country, 2025-2035
  • Figure 25: North America Market Y-o-Y Growth (%) Projections by Country, 2025-2035
  • Figure 26: North America Market Value (USD Million) Analysis by Product, 2020-2035
  • Figure 27: North America Market Volume (Units) Analysis by Product, 2020-2035
  • Figure 28: North America Market Value Share (%) and BPS Analysis by Product, 2025-2035
  • Figure 29: North America Market Y-o-Y Growth (%) Projections by Product, 2025-2035
  • Figure 30: North America Market Value (USD Million) Analysis by Application, 2020-2035
  • Figure 31: North America Market Volume (Units) Analysis by Application, 2020-2035
  • Figure 32: North America Market Value Share (%) and BPS Analysis by Application, 2025-2035
  • Figure 33: North America Market Y-o-Y Growth (%) Projections by Application, 2025-2035
  • Figure 34: North America Market Attractiveness by Product, 2025-2035
  • Figure 35: North America Market Attractiveness by Application, 2025-2035
  • Figure 36: North America Market Attractiveness by Country, 2025-2035
  • Figure 37: Europe Market Value (USD Million) by Product, 2025-2035
  • Figure 38: Europe Market Value (USD Million) by Application, 2025-2035
  • Figure 39: Europe Market Value (USD Million) by Country, 2025-2035
  • Figure 40: Europe Market Value (USD Million) Analysis by Country, 2020-2035
  • Figure 41: Europe Market Volume (Units) Analysis by Country, 2020-2035
  • Figure 42: Europe Market Value Share (%) and BPS Analysis by Country, 2025-2035
  • Figure 43: Europe Market Y-o-Y Growth (%) Projections by Country, 2025-2035
  • Figure 44: Europe Market Value (USD Million) Analysis by Product, 2020-2035
  • Figure 45: Europe Market Volume (Units) Analysis by Product, 2020-2035
  • Figure 46: Europe Market Value Share (%) and BPS Analysis by Product, 2025-2035
  • Figure 47: Europe Market Y-o-Y Growth (%) Projections by Product, 2025-2035
  • Figure 48: Europe Market Value (USD Million) Analysis by Application, 2020-2035
  • Figure 49: Europe Market Volume (Units) Analysis by Application, 2020-2035
  • Figure 50: Europe Market Value Share (%) and BPS Analysis by Application, 2025-2035
  • Figure 51: Europe Market Y-o-Y Growth (%) Projections by Application, 2025-2035
  • Figure 52: Europe Market Attractiveness by Product, 2025-2035
  • Figure 53: Europe Market Attractiveness by Application, 2025-2035
  • Figure 54: Europe Market Attractiveness by Country, 2025-2035
  • Figure 55: East Asia Market Value (USD Million) by Product, 2025-2035
  • Figure 56: East Asia Market Value (USD Million) by Application, 2025-2035
  • Figure 57: East Asia Market Value (USD Million) by Country, 2025-2035
  • Figure 58: East Asia Market Value (USD Million) Analysis by Country, 2020-2035
  • Figure 59: East Asia Market Volume (Units) Analysis by Country, 2020-2035
  • Figure 60: East Asia Market Value Share (%) and BPS Analysis by Country, 2025-2035
  • Figure 61: East Asia Market Y-o-Y Growth (%) Projections by Country, 2025-2035
  • Figure 62: East Asia Market Value (USD Million) Analysis by Product, 2020-2035
  • Figure 63: East Asia Market Volume (Units) Analysis by Product, 2020-2035
  • Figure 64: East Asia Market Value Share (%) and BPS Analysis by Product, 2025-2035
  • Figure 65: East Asia Market Y-o-Y Growth (%) Projections by Product, 2025-2035
  • Figure 66: East Asia Market Value (USD Million) Analysis by Application, 2020-2035
  • Figure 67: East Asia Market Volume (Units) Analysis by Application, 2020-2035
  • Figure 68: East Asia Market Value Share (%) and BPS Analysis by Application, 2025-2035
  • Figure 69: East Asia Market Y-o-Y Growth (%) Projections by Application, 2025-2035
  • Figure 70: East Asia Market Attractiveness by Product, 2025-2035
  • Figure 71: East Asia Market Attractiveness by Application, 2025-2035
  • Figure 72: East Asia Market Attractiveness by Country, 2025-2035
  • Figure 73: South Asia & Pacific Market Value (USD Million) by Product, 2025-2035
  • Figure 74: South Asia & Pacific Market Value (USD Million) by Application, 2025-2035
  • Figure 75: South Asia & Pacific Market Value (USD Million) by Country, 2025-2035
  • Figure 76: South Asia & Pacific Market Value (USD Million) Analysis by Country, 2020-2035
  • Figure 77: South Asia & Pacific Market Volume (Units) Analysis by Country, 2020-2035
  • Figure 78: South Asia & Pacific Market Value Share (%) and BPS Analysis by Country, 2025-2035
  • Figure 79: South Asia & Pacific Market Y-o-Y Growth (%) Projections by Country, 2025-2035
  • Figure 80: South Asia & Pacific Market Value (USD Million) Analysis by Product, 2020-2035
  • Figure 81: South Asia & Pacific Market Volume (Units) Analysis by Product, 2020-2035
  • Figure 82: South Asia & Pacific Market Value Share (%) and BPS Analysis by Product, 2025-2035
  • Figure 83: South Asia & Pacific Market Y-o-Y Growth (%) Projections by Product, 2025-2035
  • Figure 84: South Asia & Pacific Market Value (USD Million) Analysis by Application, 2020-2035
  • Figure 85: South Asia & Pacific Market Volume (Units) Analysis by Application, 2020-2035
  • Figure 86: South Asia & Pacific Market Value Share (%) and BPS Analysis by Application, 2025-2035
  • Figure 87: South Asia & Pacific Market Y-o-Y Growth (%) Projections by Application, 2025-2035
  • Figure 88: South Asia & Pacific Market Attractiveness by Product, 2025-2035
  • Figure 89: South Asia & Pacific Market Attractiveness by Application, 2025-2035
  • Figure 90: South Asia & Pacific Market Attractiveness by Country, 2025-2035
  • Figure 91: Latin America Market Value (USD Million) by Product, 2025-2035
  • Figure 92: Latin America Market Value (USD Million) by Application, 2025-2035
  • Figure 93: Latin America Market Value (USD Million) by Country, 2025-2035
  • Figure 94: Latin America Market Value (USD Million) Analysis by Country, 2020-2035
  • Figure 95: Latin America Market Volume (Units) Analysis by Country, 2020-2035
  • Figure 96: Latin America Market Value Share (%) and BPS Analysis by Country, 2025-2035
  • Figure 97: Latin America Market Y-o-Y Growth (%) Projections by Country, 2025-2035
  • Figure 98: Latin America Market Value (USD Million) Analysis by Product, 2020-2035
  • Figure 99: Latin America Market Volume (Units) Analysis by Product, 2020-2035
  • Figure 100: Latin America Market Value Share (%) and BPS Analysis by Product, 2025-2035
  • Figure 101: Latin America Market Y-o-Y Growth (%) Projections by Product, 2025-2035
  • Figure 102: Latin America Market Value (USD Million) Analysis by Application, 2020-2035
  • Figure 103: Latin America Market Volume (Units) Analysis by Application, 2020-2035
  • Figure 104: Latin America Market Value Share (%) and BPS Analysis by Application, 2025-2035
  • Figure 105: Latin America Market Y-o-Y Growth (%) Projections by Application, 2025-2035
  • Figure 106: Latin America Market Attractiveness by Product, 2025-2035
  • Figure 107: Latin America Market Attractiveness by Application, 2025-2035
  • Figure 108: Latin America Market Attractiveness by Country, 2025-2035
  • Figure 109: Middle East & Africa Market Value (USD Million) by Product, 2025-2035
  • Figure 110: Middle East & Africa Market Value (USD Million) by Application, 2025-2035
  • Figure 111: Middle East & Africa Market Value (USD Million) by Country, 2025-2035
  • Figure 112: Middle East & Africa Market Value (USD Million) Analysis by Country, 2020-2035
  • Figure 113: Middle East & Africa Market Volume (Units) Analysis by Country, 2020-2035
  • Figure 114: Middle East & Africa Market Value Share (%) and BPS Analysis by Country, 2025-2035
  • Figure 115: Middle East & Africa Market Y-o-Y Growth (%) Projections by Country, 2025-2035
  • Figure 116: Middle East & Africa Market Value (USD Million) Analysis by Product, 2020-2035
  • Figure 117: Middle East & Africa Market Volume (Units) Analysis by Product, 2020-2035
  • Figure 118: Middle East & Africa Market Value Share (%) and BPS Analysis by Product, 2025-2035
  • Figure 119: Middle East & Africa Market Y-o-Y Growth (%) Projections by Product, 2025-2035
  • Figure 120: Middle East & Africa Market Value (USD Million) Analysis by Application, 2020-2035
  • Figure 121: Middle East & Africa Market Volume (Units) Analysis by Application, 2020-2035
  • Figure 122: Middle East & Africa Market Value Share (%) and BPS Analysis by Application, 2025-2035
  • Figure 123: Middle East & Africa Market Y-o-Y Growth (%) Projections by Application, 2025-2035
  • Figure 124: Middle East & Africa Market Attractiveness by Product, 2025-2035
  • Figure 125: Middle East & Africa Market Attractiveness by Application, 2025-2035
  • Figure 126: Middle East & Africa Market Attractiveness by Country, 2025-2035
  • Figure 127: USA Market Value (USD Million) Analysis by Product, 2020-2035
  • Figure 128: USA Market Value (USD Million) Analysis by Application, 2020-2035
  • Figure 129: USA Market Share Analysis by Product, 2024
  • Figure 130: USA Market Share Analysis by Application, 2024
  • Figure 131: Germany Market Value (USD Million) Analysis by Product, 2020-2035
  • Figure 132: Germany Market Value (USD Million) Analysis by Application, 2020-2035
  • Figure 133: Germany Market Share Analysis by Product, 2024
  • Figure 134: Germany Market Share Analysis by Application, 2024
  • Figure 135: China Market Value (USD Million) Analysis by Product, 2020-2035
  • Figure 136: China Market Value (USD Million) Analysis by Application, 2020-2035
  • Figure 137: China Market Share Analysis by Product, 2024
  • Figure 138: China Market Share Analysis by Application, 2024
  • Figure 139: India Market Value (USD Million) Analysis by Product, 2020-2035
  • Figure 140: India Market Value (USD Million) Analysis by Application, 2020-2035
  • Figure 141: India Market Share Analysis by Product, 2024
  • Figure 142: India Market Share Analysis by Application, 2024
  • Figure 143: Japan Market Value (USD Million) Analysis by Product, 2020-2035
  • Figure 144: Japan Market Value (USD Million) Analysis by Application, 2020-2035
  • Figure 145: Japan Market Share Analysis by Product, 2024
  • Figure 146: Japan Market Share Analysis by Application, 2024
  • Figure 147: Brazil Market Value (USD Million) Analysis by Product, 2020-2035
  • Figure 148: Brazil Market Value (USD Million) Analysis by Application, 2020-2035
  • Figure 149: Brazil Market Share Analysis by Product, 2024
  • Figure 150: Brazil Market Share Analysis by Application, 2024
  • Figure 151: France Market Value (USD Million) Analysis by Product, 2020-2035
  • Figure 152: France Market Value (USD Million) Analysis by Application, 2020-2035
  • Figure 153: France Market Share Analysis by Product, 2024
  • Figure 154: France Market Share Analysis by Application, 2024
  • Figure 155: UK Market Value (USD Million) Analysis by Product, 2020-2035
  • Figure 156: UK Market Value (USD Million) Analysis by Application, 2020-2035
  • Figure 157: UK Market Share Analysis by Product, 2024
  • Figure 158: UK Market Share Analysis by Application, 2024
  • Figure 159: Single-use Electrode Patches Market Share Analysis by Region, 2024
  • Figure 160: Single-use Electrode Patches Market Value (USD Million) Analysis by Region, 2020-2035
  • Figure 161: Patch Defibrillator Unit Market Share Analysis by Region, 2024
  • Figure 162: Patch Defibrillator Unit Market Value (USD Million) Analysis by Region, 2020-2035
  • Figure 163: Monitoring Software & Cloud Services Market Share Analysis by Region, 2024
  • Figure 164: Monitoring Software & Cloud Services Market Value (USD Million) Analysis by Region, 2020-2035
  • Figure 165: Accessories & Prep Kit Market Share Analysis by Region, 2024
  • Figure 166: Accessories & Prep Kit Market Value (USD Million) Analysis by Region, 2020-2035
  • Figure 167: Post-Myocardial Infarction (MI) Application Market Share Analysis by Region, 2024
  • Figure 168: Post-Myocardial Infarction (MI) Application Market Value (USD Million) Analysis by Region, 2020-2035
  • Figure 169: Newly Diagnosed Cardiomyopathy Application Market Share Analysis by Region, 2024
  • Figure 170: Newly Diagnosed Cardiomyopathy Application Market Value (USD Million) Analysis by Region, 2020-2035
  • Figure 171: ICD Explant/Bridge to Re-implant Application Market Share Analysis by Region, 2024
  • Figure 172: ICD Explant/Bridge to Re-implant Application Market Value (USD Million) Analysis by Region, 2020-2035
  • Figure 173: Other Temporary High-Risk Patients Application Market Share Analysis by Region, 2024
  • Figure 174: Other Temporary High-Risk Patients Application Market Value (USD Million) Analysis by Region, 2020-2035
  • Figure 175: ZOLL Medical Company Market Share Analysis by Region, 2024
  • Figure 176: ZOLL Medical Company Product Portfolio Distribution, 2024
  • Figure 177: ZOLL Medical Company Sales Footprint Analysis, 2024
  • Figure 178: ZOLL Medical Company Revenue Analysis by Product Segment, 2020-2024
  • Figure 179: ZOLL Medical Company Market Position Analysis, 2024
  • Figure 180: Physio-Control/Stryker Company Market Share Analysis by Region, 2024
  • Figure 181: Physio-Control/Stryker Company Product Portfolio Distribution, 2024
  • Figure 182: Physio-Control/Stryker Company Sales Footprint Analysis, 2024
  • Figure 183: Physio-Control/Stryker Company Revenue Analysis by Product Segment, 2020-2024
  • Figure 184: Physio-Control/Stryker Company Market Position Analysis, 2024
  • Figure 185: Cardiac Science Company Market Share Analysis by Region, 2024
  • Figure 186: Cardiac Science Company Product Portfolio Distribution, 2024
  • Figure 187: Cardiac Science Company Sales Footprint Analysis, 2024
  • Figure 188: Cardiac Science Company Revenue Analysis by Product Segment, 2020-2024
  • Figure 189: Cardiac Science Company Market Position Analysis, 2024
  • Figure 190: Empatica Company Market Share Analysis by Region, 2024
  • Figure 191: Empatica Company Product Portfolio Distribution, 2024
  • Figure 192: Empatica Company Sales Footprint Analysis, 2024
  • Figure 193: Empatica Company Revenue Analysis by Product Segment, 2020-2024
  • Figure 194: Empatica Company Market Position Analysis, 2024
  • Figure 195: Advanced Cardiac Monitoring Inc. Company Market Share Analysis by Region, 2024
  • Figure 196: Advanced Cardiac Monitoring Inc. Company Product Portfolio Distribution, 2024
  • Figure 197: Advanced Cardiac Monitoring Inc. Company Sales Footprint Analysis, 2024
  • Figure 198: CardioTech Solutions Company Market Share Analysis by Region, 2024
  • Figure 199: CardioTech Solutions Company Product Portfolio Distribution, 2024
  • Figure 200: CardioTech Solutions Company Sales Footprint Analysis, 2024
  • Figure 201: WearableTech Medical Company Market Share Analysis by Region, 2024
  • Figure 202: WearableTech Medical Company Product Portfolio Distribution, 2024
  • Figure 203: WearableTech Medical Company Sales Footprint Analysis, 2024
  • Figure 204: LifeSaver Technologies Company Market Share Analysis by Region, 2024
  • Figure 205: LifeSaver Technologies Company Product Portfolio Distribution, 2024
  • Figure 206: LifeSaver Technologies Company Sales Footprint Analysis, 2024
  • Figure 207: Cardiac Innovations Ltd. Company Market Share Analysis by Region, 2024
  • Figure 208: Cardiac Innovations Ltd. Company Product Portfolio Distribution, 2024
  • Figure 209: Cardiac Innovations Ltd. Company Sales Footprint Analysis, 2024
  • Figure 210: MedTech Wearables Corp Company Market Share Analysis by Region, 2024
  • Figure 211: MedTech Wearables Corp Company Product Portfolio Distribution, 2024
  • Figure 212: MedTech Wearables Corp Company Sales Footprint Analysis, 2024
  • Figure 213: Global Market Competition Dashboard, 2024
  • Figure 214: Global Market Competition Benchmarking, 2024
  • Figure 215: Global Market Pricing Trends Analysis by Product, 2020-2024
  • Figure 216: Global Market Pricing Forecast by Product, 2025-2035
  • Figure 217: Global Market Technology Adoption Analysis, 2024
  • Figure 218: Global Market Innovation Pipeline Analysis, 2025-2035
  • Figure 219: Global Market Regulatory Impact Analysis by Region, 2024
  • Figure 220: Global Market Supply Chain Analysis, 2024
  • Figure 221: Global Market Value Chain Analysis, 2024
  • Figure 222: Global Market Investment Opportunities Analysis by Region, 2025-2035
  • Figure 223: Global Market Growth Opportunity Analysis by Product, 2025-2035
  • Figure 224: Global Market Growth Opportunity Analysis by Application, 2025-2035
  • Figure 225: Global Market Market Entry Strategy Analysis by Region, 2025-2035
  • Figure 226: Global Market Merger & Acquisition Activity Analysis, 2020-2024
  • Figure 227: Global Market Patent Landscape Analysis, 2024
  • Figure 228: Global Market Clinical Trial Activity Analysis, 2020-2024
  • Figure 229: Global Market Reimbursement Landscape Analysis by Region, 2024
  • Figure 230: Global Market Future Outlook and Strategic Recommendations, 2025-2035

Frequently Asked Questions

How big is the wearable defibrillator patch market in 2025?

The global wearable defibrillator patch market is valued at USD 51.3 million in 2025.

What will be the size of wearable defibrillator patch market in 2035?

The size for the wearable defibrillator patch market is projected to reach USD 98.1 million by 2035.

How much will be the wearable defibrillator patch market growth between 2025 and 2035?

The wearable defibrillator patch market is expected to grow at a 6.7% CAGR between 2025 and 2035.

What are the key product segments in the wearable defibrillator patch market?

The key product segments in the wearable defibrillator patch market are single-use electrode patches, patch defibrillator unit, monitoring software & cloud services, accessories & prep kit, and others.

Which application segment is expected to contribute significant share in the wearable defibrillator patch market in 2025?

In terms of application, post-myocardial infarction (MI) segment is set to command 41.1% share in the wearable defibrillator patch market in 2025.

Explore Similar Insights

Future Market Insights

Wearable Defibrillator Patch Market

Chat With

MaRIA

Hi There, I am MaRIA, Your Market Research Intelligence Assistant. How may I help you?