The wearable band market is estimated to be valued at USD 55.7 billion in 2025 and is projected to reach USD 225.2 billion by 2035, registering a compound annual growth rate (CAGR) of 15.0% over the forecast period.
The market faces substantial operational tensions that extend beyond simple technology adoption challenges, creating complex ecosystem dynamics between consumer expectations, technical limitations, and organizational requirements. Users consistently abandon devices due to accuracy concerns that manifest differently across demographic groups, with optical heart rate sensors particularly problematic for individuals with darker skin tones where melanin absorption affects green light technology performance. Healthcare providers struggle with data integration challenges when wearable information cannot seamlessly interface with existing electronic health records systems. Privacy concerns create persistent user anxiety, with 63% of wearable users expressing hesitation about sharing health and personal data due to fears of unauthorized access and misuse. This privacy tension becomes particularly acute when users realize their location tracking, biometric patterns, and behavioral data create detailed profiles that could be exploited by third parties for targeting or discrimination purposes.
The market experiences profound conflicts between engineering constraints and user expectations around battery life performance. Battery limitations rank as the primary abandonment factor, with 52% of users discontinuing device usage due to inadequate battery longevity that disrupts daily routines. Users demand continuous monitoring capabilities while expecting devices that require minimal maintenance interventions. This creates engineering challenges where advanced sensor arrays that provide comprehensive health metrics consume power faster than battery technology can accommodate. Design teams struggle to balance sophisticated functionality with energy efficiency, often resulting in devices that either sacrifice features for battery life or require frequent charging that interrupts user workflows.
Accuracy limitations create significant market tensions when devices fail to deliver reliable biometric data under real-world conditions. Photoplethysmographic sensors face substantial challenges from environmental factors including ambient light interference, motion artifacts during exercise, and skin characteristics such as tattoos, hair density, and perspiration levels. Users experience frustration when devices marketed for fitness tracking provide inconsistent readings during the activities they are designed to monitor. This accuracy paradox creates particularly problematic dynamics for healthcare applications where clinical decisions might rely on consumer-grade device data that lacks the precision required for medical interventions. Healthcare professionals remain skeptical of consumer wearable data due to concerns about liability and the absence of standardized validation protocols.
The competitive landscape creates market pressures where manufacturers must differentiate products through feature proliferation that may compromise core functionality reliability. Companies face decisions between developing specialized devices with focused capabilities versus comprehensive platforms that attempt to address multiple use cases simultaneously.
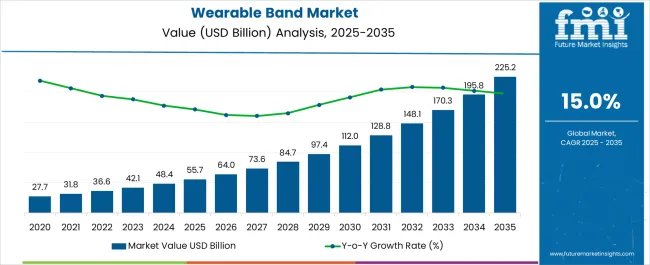
| Metric | Value |
|---|---|
| Wearable Band Market Estimated Value in (2025 E) | USD 55.7 billion |
| Wearable Band Market Forecast Value in (2035 F) | USD 225.2 billion |
| Forecast CAGR (2025 to 2035) | 15.0% |
The wearable band market is experiencing strong momentum supported by rising consumer adoption of health monitoring, fitness tracking, and lifestyle management devices. Growing health consciousness, combined with the integration of advanced sensors for heart rate, oxygen saturation, and sleep monitoring, has enhanced product utility across diverse user groups.
Expanding compatibility with smartphones, seamless app integration, and increasing emphasis on personalized wellness insights are reinforcing adoption. Continuous innovations in design, battery efficiency, and multifunctional features are strengthening consumer preference for connected wearables.
Regulatory focus on preventive healthcare and rising adoption among both urban and semi-urban populations are further contributing to market expansion. The outlook remains favorable as manufacturers leverage artificial intelligence, cloud-based data analytics, and connectivity ecosystems to position wearable bands as essential tools in personal health management.
The market is segmented by Product Type, Operating System, Category, Connectivity, Application, and Distribution Channel and region. By Product Type, the market is divided into With Screen and Without Screen. In terms of Operating System, the market is classified into Android Windows, iOS, and Others. Based on Category, the market is segmented into Basic Watches and Smart Watches. By Connectivity, the market is divided into Bluetooth, Wi-Fi, Cellular, NFC, and Others. By Application, the market is segmented into Personal Assistance, Wellness, Healthcare, Sports, and Others. By Distribution Channel, the market is segmented into Online and Offline. Regionally, the market is classified into North America, Latin America, Western Europe, Eastern Europe, Balkan & Baltic Countries, Russia & Belarus, Central Asia, East Asia, South Asia & Pacific, and the Middle East & Africa.
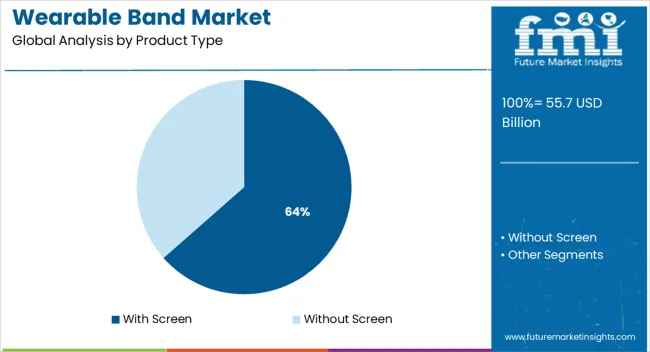
The with screen segment is projected to hold 63.50% of total market revenue by 2025, making it the leading product type. Its dominance is supported by consumer preference for interactive interfaces that allow real time health tracking, notifications, and user engagement.
The ability to integrate multiple features such as GPS, messaging, and mobile payment has further accelerated adoption.
Enhanced display technologies and customizable interfaces have strengthened its positioning as the preferred choice in the wearable band category.
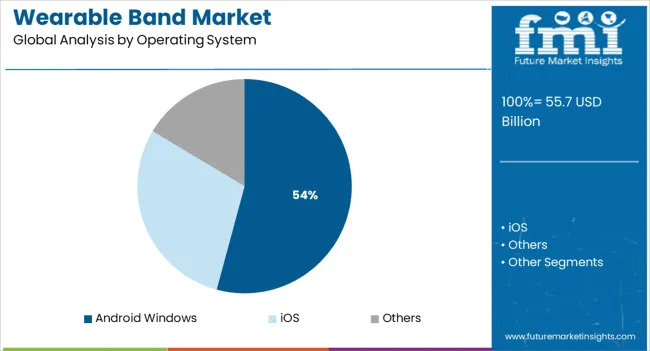
The Android Windows segment is expected to account for 54.20% of total market revenue by 2025, positioning it as the most prominent operating system. Its wide adoption is attributed to compatibility with diverse device ecosystems, affordability, and accessibility for a broad consumer base.
Open platform flexibility has enabled greater application support, customization, and integration with third party health and fitness solutions.
As a result, this segment continues to dominate due to its adaptability and strong user base.
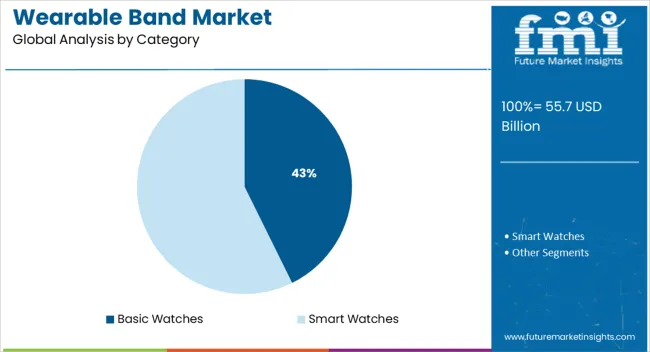
The basic watches segment is anticipated to represent 42.70% of market revenue by 2025 within the category classification. This growth is being driven by increasing demand for affordable entry level devices that provide essential health tracking without advanced complexities.
Their appeal lies in ease of use, long battery life, and cost effectiveness, making them popular among first time wearable users and price sensitive consumers.
As adoption expands in emerging markets, basic watches are expected to maintain a significant presence in the overall wearable band landscape.
Rising Product Prices and Data Security Threats Decline the Market Growth
Growing awareness-related health issues such as being overweight, diabetes, and sleeplessness are increasing the demand for wearable band equipment. Rising Artificial Intelligence and the Internet of Things to access smart devices are surging the demand for the wearable band. The adoption of the wearable band is growing to easily connect with a smartphone to check information about heartbeats, calories burned, sleep time, and others.
Manufacturers are developing types of fitness trackers for the end-users within budget prices, which results in driving market opportunities. The growing adoption of AR and wireless technologies in smartwatches is increasing the wearable band market opportunities.
| Attributes | Details |
|---|---|
| Market CAGR (2025 to 2035) | 15.0% |
| Market Valuation (2025) | USD 42.09 billion |
| Market Valuation (2035) | USD 170.31 billion |
According to Future Market Insights, the global wearable band market is predicted at a healthy 15.0% CAGR during the forecast period. Historically, the market registered a CAGR of 11.5% between 2020 and 2025.
During the COVID-19 situation, consumers are more conscious about wearable devices to monitor their daily health, which results in fueling market growth. Healthcare providers increase the adoption of advanced monitoring wearable devices to regulate patients' health updates and detect patients' early disease.
Increasing advanced and wearable device technology for excise routine, remote work, and others are prominently expanding the market during the forecast period. The innovation of Artificial Intelligence and machine learning in the healthcare sector for quick check-ups further enhance the market size. The development of wearable sensors equipped with the internet of things and novel technologies are driving market opportunities. Due to the rising popularity of wearable band devices, several countries are dropping the prices of their devices.
The market is estimated to reach USD 27.7 billion during the forecast period. Historically, the market stood at USD 36.60 billion from 2020 to 2025.
| Segment | Connectivity |
|---|---|
| Top Category | Bluetooth |
| Forecast CAGR | 17.1% |
| Segment | Operating System |
|---|---|
| Top Category | Android |
| Forecast CAGR | 16.6% |
| Segment | Distribution Channel |
|---|---|
| Top Category | Online |
| Forecast CAGR | 16.5 |
Based on connectivity, Bluetooth is leading the global market by securing a significant CAGR of 17.1% during the forecast period. The increasing wireless connectivity is surging the demand for Bluetooth among consumers. The Bluetooth connectivity saves power and can wear easily with its standardized features.
Through the pairing of Bluetooth, one can easily access and use it for several things such as transferring data, files, music, and others. Recently, the popularity of Bluetooth earphones has been increasing the market trends due to their wireless connectivity. Wi-Fi, NFC, and Cellular are other categories
Based on the operating system, the Android operating system is dominating the global market by registering a CAGR of 16.6% during the forecast period. The number of wide-ranging clients prefers to increase the adoption of Android compared to iOS and Windows due to its budget-friendly cost.
The manufacturers are increasing the production of the Android operating system as per consumers' requirements. Apart from it, growing disposable income and enhanced quality of android wearable bands with more advanced features than iOS are further propelling the market growth.
Based on the distribution channel, the online distribution channel is the dominating distribution channel in the global market, capturing a CAGR of 16.5% during the forecast period. Increasing the internet of things, smartphones, tablets, and laptops are enhancing the adoption of online distribution channels. In recent years, end-users have been buying products through online channels due to several discounts and vouchers.
Key vendors attract consumers by adopting several marketing tactics such as buy 1 get 1 policy, discounts on re-purchase, and others. The increasing smartphone is another method of endorsing their products through mobile phone advertising, including emails and messages. Therefore, they habitually buy their essential products by preferring online distribution channels.
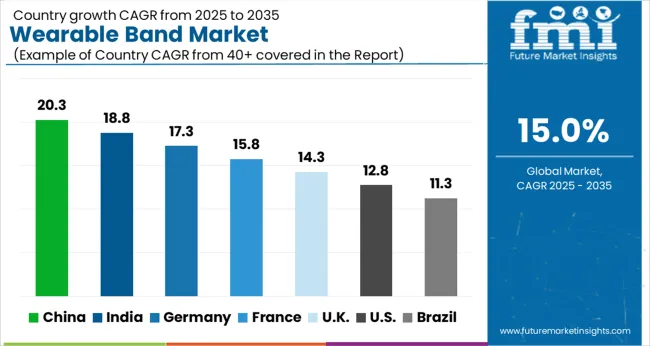
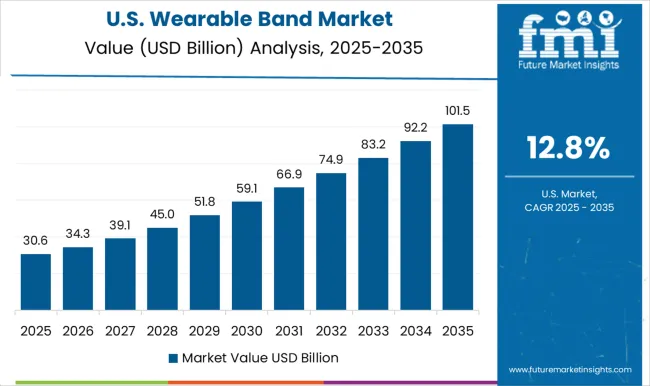
The USA is dominating the global market by registering a CAGR of 15.5% during the forecast period. Increasing technology gadgets and innovative products are propelling the USA market expansion. Growing novel technology, advanced wearable sensor bands, and multi-functional devices drive market growth.
Rising disposable income, innovative technologies, and the presence of key manufacturers are propelling the USA wearable band market growth. The popularity of smartwatches series among millennial are influencing the USA market.
The United States is progressively growing worldwide by securing a CAGR of 5.36% during the forecast period. The increasing popularity of smart wearable bands due to easy access and providing information-related moments throughout the day are further driving the market in the region. The adoption of a wearable band with multi-functional features, including GPS, biometrics, mapping, and others flourishing the United Kingdom wearable band market.
Germany is one of the leading nations in Europe which holds around 31.1% of the share. The increasing generic population and present key players are bolstering the German market growth during the forecast period. Adopting wearable tracker devices in the healthcare sector for several chronic disease patients fuels German Market further.
Asia Pacific is a significantly growing region in the global market securing a CAGR of 19.5% during the forecast period. The increasing e-commerce sector, smartphone users, and fashion trends are raising the demand for wearable bands.
China is one of the significant producers of advanced technology gadgets in the Asia Pacific. China secures a share of 14% in the region by increasing the production of wearable band devices at low costs. The top companies are investing huge amounts to upsurge the market by acquiring maximum output in China.
Rising government initiatives, research & development activities, and low-cost innovative product launches are the few factors propelling China's wearable band market. Moreover, Innovation in technology and built-in connections such as smartwatches and wearable advanced fitness bands are the factors driving the market growth. Key manufacturers such as Huawei, Realme, and Xiaomi are uplifting the Market by providing online services to their consumers in China.
How are Start-ups Experimenting with Latest Technologies in the Market?
The wearable band gained huge popularity in recent years. The fashion and healthcare sector is significantly growing by increasing the adoption of the wearable band. The start-ups are developing new products with the latest technologies to improve the technical results in the devices and gadgets. They are investing and developing a unique product with better features to satisfy customers.
Top Two Start-ups in the Wearable Band Market
Zepp Labs
The United States-based company develops wearable bands with unique technical methods to enhance interactive tools, 3D images, and more. The company also inbuilt several health-related features, including heartbeats, sleep, and sports monitoring. Their application is accessible for iOS and android.
Withings
Withings provides computing and storing properties for app development. Wi-Fi BodyScale can assess weight and fat mass. It can further transfer and upload data to the cloud through Wi-Fi. The company also offers Withings Home, a video monitoring and security system.
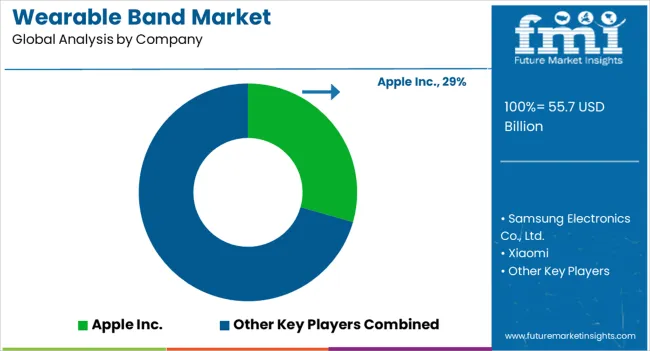
The wearable technology market is driven by manufacturers adopting advanced design, health-tracking, and AI integration to gain a competitive edge. Apple Inc. leads through its ecosystem of connected devices and services, with Apple Watch fueling consistent growth in health and fitness monitoring. Samsung Electronics Co. Ltd. combines its expertise in semiconductors, displays, and mobile technology to strengthen its smartwatch and fitness tracker lineup. Xiaomi Corp. expands through affordable smart wearables and IoT connectivity aimed at value-conscious consumers.
Huawei Technologies Co. Ltd. invests heavily in AI, sensor technology, and HarmonyOS integration to enhance wearable performance and independence from smartphone ecosystems. Garmin Ltd. focuses on GPS precision and endurance wearables for athletes and professionals. Fitbit, now part of Google, leverages AI analytics and Google integration to advance personalized wellness.
Fossil Group Inc. balances fashion and functionality through stylish smartwatches powered by Google’s Wear OS. Amazfit (Zepp Health) competes on affordability and long battery life, appealing to emerging market users. Oppo and Honor target younger demographics with design-centric, AI-enhanced smartwatches tied to their smartphone ecosystems.
| Attribute | Details |
|---|---|
| Forecast Period | 2025 to 2035 |
| Historical Data Available for | 2020 to 2025 |
| Market Analysis | USD billion for Value |
| Key Countries Covered | USA, Canada, Germany, United Kingdom, France, Italy, Spain, Russia, China, Japan, South Korea, India, Thailand, Malaysia, Indonesia, Australia, New Zealand, GCC Countries, Northern Africa, and South Africa |
| Key Segments Covered | Product Type, Operating System, Distribution Channel, Application, Category, Connectivity, Region |
| Key Companies Profiled | Apple Inc., Samsung Electronics Co. Ltd., Xiaomi Corp., Huawei Technologies Co. Ltd., Garmin Ltd., Fitbit (Google), Fossil Group Inc., Amazfit (Zepp Health), Oppo, and Honor |
| Report Coverage | Market Forecast, Company Share Analysis, Competition Intelligence, Drivers, Restraints, Opportunities and Threats Analysis, Market Dynamics and Challenges, and Strategic Growth Initiatives |
| Customization & Pricing | Available upon Request |
The global wearable band market is estimated to be valued at USD 55.7 billion in 2025.
The market size for the wearable band market is projected to reach USD 225.2 billion by 2035.
The wearable band market is expected to grow at a 15.0% CAGR between 2025 and 2035.
The key product types in wearable band market are with screen and without screen.
In terms of operating system, android windows segment to command 54.2% share in the wearable band market in 2025.


Our Research Products

The "Full Research Suite" delivers actionable market intel, deep dives on markets or technologies, so clients act faster, cut risk, and unlock growth.

The Leaderboard benchmarks and ranks top vendors, classifying them as Established Leaders, Leading Challengers, or Disruptors & Challengers.

Locates where complements amplify value and substitutes erode it, forecasting net impact by horizon

We deliver granular, decision-grade intel: market sizing, 5-year forecasts, pricing, adoption, usage, revenue, and operational KPIs—plus competitor tracking, regulation, and value chains—across 60 countries broadly.

Spot the shifts before they hit your P&L. We track inflection points, adoption curves, pricing moves, and ecosystem plays to show where demand is heading, why it is changing, and what to do next across high-growth markets and disruptive tech

Real-time reads of user behavior. We track shifting priorities, perceptions of today’s and next-gen services, and provider experience, then pace how fast tech moves from trial to adoption, blending buyer, consumer, and channel inputs with social signals (#WhySwitch, #UX).

Partner with our analyst team to build a custom report designed around your business priorities. From analysing market trends to assessing competitors or crafting bespoke datasets, we tailor insights to your needs.
Supplier Intelligence
Discovery & Profiling
Capacity & Footprint
Performance & Risk
Compliance & Governance
Commercial Readiness
Who Supplies Whom
Scorecards & Shortlists
Playbooks & Docs
Category Intelligence
Definition & Scope
Demand & Use Cases
Cost Drivers
Market Structure
Supply Chain Map
Trade & Policy
Operating Norms
Deliverables
Buyer Intelligence
Account Basics
Spend & Scope
Procurement Model
Vendor Requirements
Terms & Policies
Entry Strategy
Pain Points & Triggers
Outputs
Pricing Analysis
Benchmarks
Trends
Should-Cost
Indexation
Landed Cost
Commercial Terms
Deliverables
Brand Analysis
Positioning & Value Prop
Share & Presence
Customer Evidence
Go-to-Market
Digital & Reputation
Compliance & Trust
KPIs & Gaps
Outputs
Full Research Suite comprises of:
Market outlook & trends analysis
Interviews & case studies
Strategic recommendations
Vendor profiles & capabilities analysis
5-year forecasts
8 regions and 60+ country-level data splits
Market segment data splits
12 months of continuous data updates
DELIVERED AS:
PDF EXCEL ONLINE
Wearable Fall Detector Market Size and Share Forecast Outlook 2025 to 2035
Wearable Industrial Exoskeleton Devices Market Size and Share Forecast Outlook 2025 to 2035
Wearable Healthcare Devices Market Size and Share Forecast Outlook 2025 to 2035
Wearable Sensor Market Size and Share Forecast Outlook 2025 to 2035
Wearable Sleep Tracker Market Forecast and Outlook 2025 to 2035
Wearable Medical Device Market Size and Share Forecast Outlook 2025 to 2035
Wearable Injectors Market Size and Share Forecast Outlook 2025 to 2035
Wearable Defibrillator Patch Market Analysis - Size, Share, and Forecast Outlook 2025 to 2035
Wearable Fitness Tracker Market Size and Share Forecast Outlook 2025 to 2035
Wearable Translator Market Size and Share Forecast Outlook 2025 to 2035
Wearable Cardioverter Defibrillator Market Size and Share Forecast Outlook 2025 to 2035
Wearable Electronics Market Size and Share Forecast Outlook 2025 to 2035
Wearable Gaming Technology Market Size and Share Forecast Outlook 2025 to 2035
Wearable Beauty Market Size, Growth, and Forecast for 2025 to 2035
Wearable Medical Robots Market - Trends & Forecast 2025 to 2035
Wearable Computing Market Trends – Growth & Forecast 2025 to 2035
Wearable Blood Pressure Monitor Market Trends and Forecast 2025 to 2035
Wearable Pregnancy Devices Market Trends and Forecast 2025 to 2035
Wearable Fitness Technology Market Insights - Trends & Forecast 2025 to 2035
Wearable Computing Devices Market Analysis - Size, Share & Forecast 2025 to 2035

Thank you!
You will receive an email from our Business Development Manager. Please be sure to check your SPAM/JUNK folder too.
Chat With
MaRIA