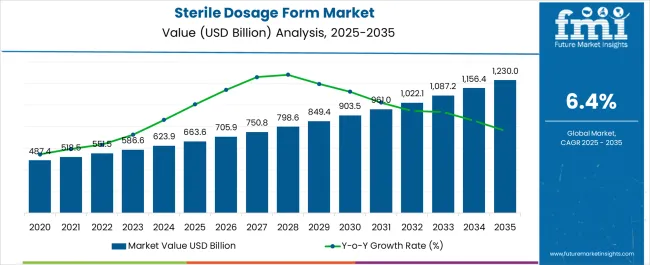
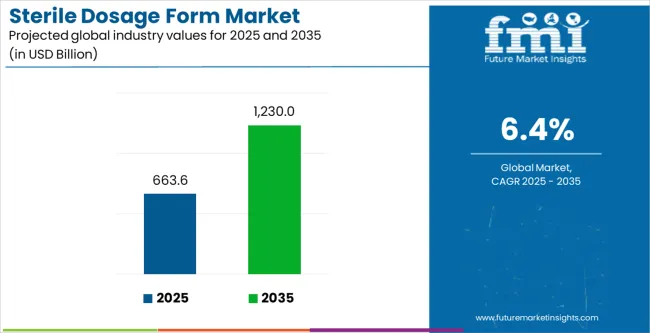
The Sterile Dosage Form Market is estimated to be valued at USD 663.6 billion in 2025 and is projected to reach USD 1230.0 billion by 2035, registering a compound annual growth rate (CAGR) of 6.4% over the forecast period.
| Metric | Value |
|---|---|
| Sterile Dosage Form Market Estimated Value in (2025 E) | USD 663.6 billion |
| Sterile Dosage Form Market Forecast Value in (2035 F) | USD 1230.0 billion |
| Forecast CAGR (2025 to 2035) | 6.4% |
The sterile dosage form market is witnessing strong momentum as regulatory bodies and healthcare systems emphasize the importance of safety, precision, and contamination free drug delivery. Rising prevalence of chronic diseases, expanding demand for injectable therapies, and the need for advanced formulations in ophthalmology, oncology, and biologics have accelerated the adoption of sterile preparations.
Pharmaceutical companies are increasing investments in sterile manufacturing facilities, supported by technological advancements in aseptic processing and fill finish automation. Additionally, patient preference for safe and effective therapies, along with the growing pipeline of biologics and biosimilars, is enhancing demand for sterile dosage forms across both developed and emerging markets.
With a clear shift toward targeted therapies and complex formulations, the sterile dosage form market is positioned for sustained growth as companies prioritize quality, compliance, and patient centric delivery systems.
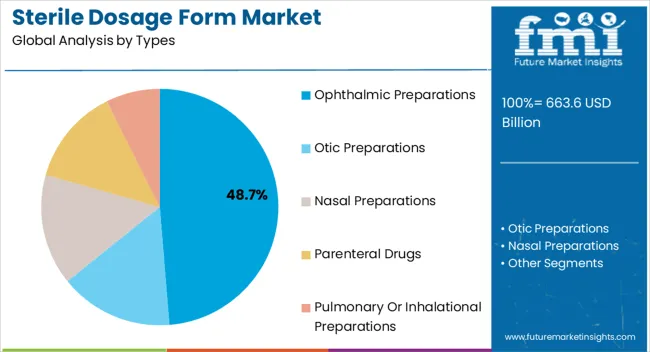
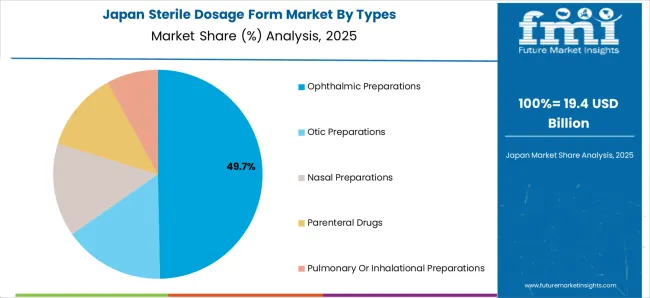
The ophthalmic preparations segment is expected to hold 48.70% of the overall market revenue by 2025 within the type category, making it the leading segment. The dominance of this segment is supported by the rising incidence of eye related disorders and the increased availability of innovative ophthalmic drugs.
Demand for sterile dosage forms in this category is further reinforced by the need for precise dosing and contamination free delivery methods to ensure ocular safety and therapeutic efficacy. Regulatory requirements for sterile ophthalmic solutions and suspensions have also intensified adoption, with manufacturers focusing on enhanced formulation stability and patient friendly administration techniques.
This has positioned ophthalmic preparations as the most significant contributor within the type segment.
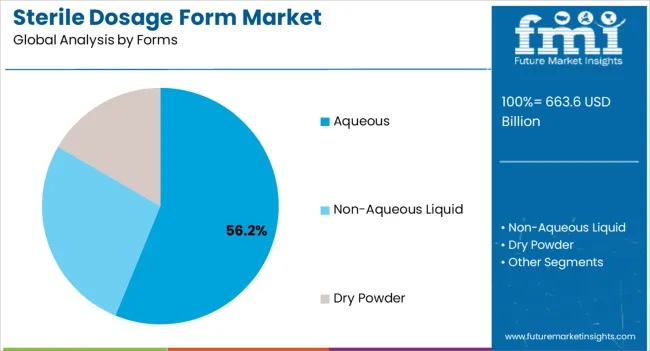
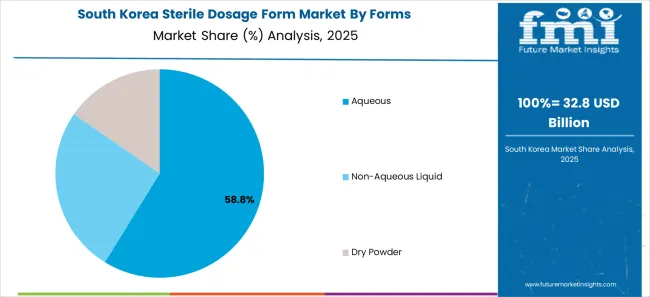
The aqueous form segment is projected to account for 56.20% of total revenue within the form category by 2025, establishing it as the dominant subsegment. This leadership is driven by its versatility, ease of formulation, and compatibility with a wide range of active pharmaceutical ingredients.
Aqueous solutions are highly preferred in sterile dosage applications due to their rapid absorption, patient safety, and ability to deliver consistent therapeutic outcomes. Manufacturing advancements in aseptic filling and filtration technologies have further strengthened the adoption of aqueous sterile forms.
Additionally, their widespread use in injectables, ophthalmic solutions, and parenteral therapies has solidified their market dominance, reinforcing the segment’s pivotal role in the overall sterile dosage form industry.
From 2012 to 2025, the global sterile dosage form market experienced a CAGR of 5.1%, reaching a market size of USD 663.6 million in 2025.
From 2012 to 2025, the market for sterile dosage forms has been steadily expanding in recent years. The prevalence of chronic diseases, the rise in the need for biologics and injectable medications, and the emphasis on patient safety have all been major market growth factors.
The market has also grown as a result of technological developments in sterile manufacturing and aseptic processing. According to the market's historical view, sterile dosage forms, including as pre-filled syringes, vials, and lyophilized goods, are becoming more widely used. Outsourcing and contract manufacturing are also becoming more important.
Future Forecast for Sterile Dosage Form Industry
Looking ahead, the global sterile dosage form industry is expected to rise at a CAGR of 6.7% from 2025 to 2035. During the forecast period, the market size is expected to reach USD 1230 billion by 2035.
The market for sterile dosage forms is anticipated to continue seeing favorable growth. The ageing population, the developments in medical technology, and the increased incidence of chronic diseases are all expected to contribute to the need for biologics and injectable medications continuing to rise.
The demand for sterile dosage forms will increase as personalized medicine becomes more prevalent and novel medicines and treatment choices become available. The effectiveness and quality of the production of sterile dosage forms are likely to be improved by technological developments in aseptic processing and factory automation.
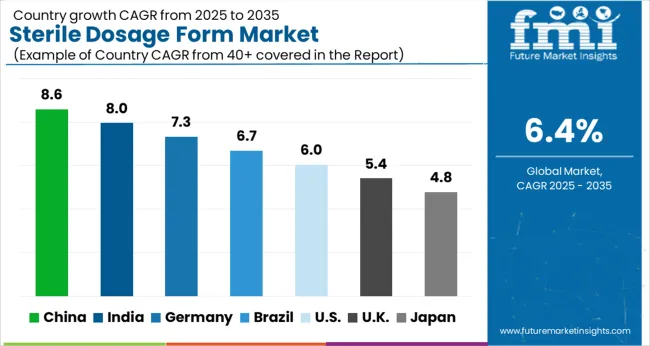
| Country | The United States |
|---|---|
| Market Size (USD million) by End of Forecast Period (2035) | USD 1230 million |
| CAGR % 2025 to End of Forecast (2035) | 6.2% |
The sterile dosage form industry in the United States is expected to reach a market size of USD 1230 million by 2035, expanding at a CAGR of 6.2%. Injectable, vials, prefilled syringes, and parenteral nutrition products are among the sterile dosage forms that are in high demand in the US today.
For the delivery of essential medications and treatments, sterile dosage forms are frequently utilized in hospitals, ambulatory surgery centers, and other healthcare settings. The demand for sterile dosage forms is driven by the expanding patient population, improvements in medical technology, and the requirement for safe and efficient drug delivery.
| Country | The United Kingdom |
|---|---|
| Market Size (USD million) by End of Forecast Period (2035) | USD 59.8 million |
| CAGR % 2025 to End of Forecast (2035) | 5.8% |
The sterile dosage form industry in the United Kingdom is expected to reach a market value of USD 59.8 million, expanding at a CAGR of 5.8% during the forecast period. The United Kingdom market is projected to growth of the market with major investments in healthcare services and infrastructure, the United Kingdom has a strong healthcare system.
The need for sterile dosage forms is fueled by the government's emphasis on enhancing patient care and increasing access to high-quality healthcare. The United Kingdom market for sterile dosage forms has chances to expand due to rising healthcare costs.
| Country | China |
|---|---|
| Market Size (USD million) by End of Forecast Period (2035) | USD 98.3 million |
| CAGR % 2025 to End of Forecast (2035) | 8.0% |
The sterile dosage form industry in China is anticipated to reach a market size of USD 98.3 million, moving at a CAGR of 8.0% during the forecast period. The pharmaceutical sector in China has expanded significantly in recent years.
To encourage the expansion of the local pharmaceutical industry, the nation has made investments in research and development, production capacity, and regulatory reforms. As pharmaceutical businesses increase their product portfolios and improve their production skills, this growth generates a demand for sterile dosage forms.
| Country | Japan |
|---|---|
| Market Size (USD million) by End of Forecast Period (2035) | USD 58.6 million |
| CAGR % 2025 to End of Forecast (2035) | 7.0% |
The sterile dosage form industry in Japan is estimated to reach a market size of USD 58.6 million by 2035, thriving at a CAGR of 7.0%. Pharmaceutical items, including sterile dosage forms, are manufactured, monitored for quality, and distributed in Japan under tight regulatory standards and rules.
Product safety and quality are ensured by the Pharmaceutical and Medical Devices Agency (PMDA), a regulatory body. Entry into the market is impossible without compliance with these rules, which also motivates firms to spend money on cutting-edge equipment and quality assurance procedures.
The market for sterile dosage forms is expanding as a result of the strict regulatory environment.
| Country | South Korea |
|---|---|
| Market Size (USD million) by End of Forecast Period (2035) | USD 53.8 million |
| CAGR % 2025 to End of Forecast (2035) | 7.7% |
The sterile dosage form industry in South Korea is expected to reach a market size of USD 53.8 million, expanding at a CAGR of 7.7% during the forecast period. The South Korean government has implemented policies and initiatives to promote the growth of the pharmaceutical industry and enhance healthcare services.
These include research and development grants, tax incentives, and regulatory reforms. Government support creates a favorable environment for the growth of the Sterile Dosage Form market by encouraging investment in advanced manufacturing capabilities and quality control measures.
The Parenteral Drugs is expected to dominate the sterile dosage form industry with a CAGR of 6.5% from 2025 to 2035. Parenteral medications are given by injection, skipping the digestive system and going straight to the bloodstream.
For medications with a poor oral bioavailability or those requiring quick and exact delivery, this mode of administration is crucial. The market for sterile dosage forms is expanding as a result of the demand for injectable treatments such as biologics, vaccines, and specialty drugs.
The aqueous forms are expected to dominate the sterile dosage form industry with a CAGR of 6.4% from 2025 to 2035. The onset and duration associated with drug action to initiate is usually dependent on its chemical as well as physical properties.
Soluble drugs or drugs in aqueous suspensions are rapidly absorbed by the body owed to higher miscibility of aqueous preparations and rapid contact of drug particles with body fluids.
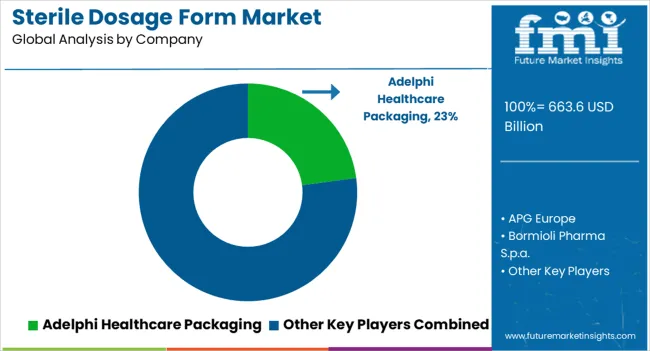
The sterile dosage form sector is fiercely competitive, with many companies fighting for market dominance. To stay ahead of the competition in such a circumstance, essential players must employ smart techniques.
Key Strategies Used by the Participants
To produce innovative goods that increase efficacy, dependability, and cost-effectiveness, businesses make significant investments in R&D. Product innovation enables companies to stand out from the competition while also meeting the shifting needs of their customers.
Key industry leaders frequently develop strategic partnerships and collaborations with other companies in order to harness their strengths and increase their market reach. Companies might also gain access to new technology and markets through such agreements.
The sterile dosage form sector is expanding rapidly in emerging regions such as China and India. Key firms are enhancing their distribution networks and developing local manufacturing facilities to increase their presence in these areas.
Mergers and acquisitions are frequently used by key players in the sterile dosage form business to consolidate their market position, extend their product range, and gain access to new markets.
Key Developments in the Sterile Dosage Form Market:
The global sterile dosage form market is estimated to be valued at USD 663.6 billion in 2025.
The market size for the sterile dosage form market is projected to reach USD 1,230.0 billion by 2035.
The sterile dosage form market is expected to grow at a 6.4% CAGR between 2025 and 2035.
The key product types in sterile dosage form market are ophthalmic preparations, otic preparations, nasal preparations, parenteral drugs and pulmonary or inhalational preparations.
In terms of forms, aqueous segment to command 56.2% share in the sterile dosage form market in 2025.


Full Research Suite comprises of:
Market outlook & trends analysis
Interviews & case studies
Strategic recommendations
Vendor profiles & capabilities analysis
5-year forecasts
8 regions and 60+ country-level data splits
Market segment data splits
12 months of continuous data updates
DELIVERED AS:
PDF EXCEL ONLINE
Sterile Packaging Market Size and Share Forecast Outlook 2025 to 2035
Sterile Tubing Welders Market Size and Share Forecast Outlook 2025 to 2035
Sterile Prep-Pack Workstations Market Size and Share Forecast Outlook 2025 to 2035
Sterile Barrier Packaging Market Growth - Demand & Forecast 2025 to 2035
Analyzing Sterile Packaging Market Share & Industry Leaders
Sterile and Antiviral Packaging Market Trends – Growth & Forecast 2024-2034
Global Sterile Injectable CDMO Market Analysis – Size, Share & Forecast 2024-2034
Sterile Rubber Stopper Market Demand & Pharmaceutical Advancements 2024-2034
Sterile Medical Packaging Market
Sterile Wraps Market
Sterile IV Containers Market
Sterile Container Market
Sterile Lids Market
Sterile Oncology Injectable Market
Non-Sterile Liquids Suspensions Market Size and Share Forecast Outlook 2025 to 2035
Global Non-Sterile Outsourcing Market Analysis – Size, Share & Forecast 2024-2034
Mobile Sterile Units Market Analysis – Growth, Applications & Outlook 2025–2035
UK Mobile Sterile Units Market Growth – Innovations, Trends & Forecast 2025-2035
Japan Mobile Sterile Units Market Analysis – Size & Industry Trends 2025-2035
Depyrogenated Sterile Empty Vials Market Size and Share Forecast Outlook 2025 to 2035

Thank you!
You will receive an email from our Business Development Manager. Please be sure to check your SPAM/JUNK folder too.
Chat With
MaRIA