Reports

- Global Locations -

Headquarters

Future Market Insights, Inc.

Christiana Corporate, 200
Continental Drive, Suite 401,
Newark, Delaware - 19713,
United States

T: +1-845-579-5705

Americas

Future Market Insights, Inc.

616 Corporate Way, Suite 2-9018,
Valley Cottage, NY 10989, United States

T: +1-347-918-3531

MEA

Future Market Insights

1602-6 Jumeirah Bay X2 Tower, Plot No: JLT-PH2-X2A,
Jumeirah Lakes Towers, Dubai,
United Arab Emirates

Europe

Future Market Insights

3rd Floor, 207 Regent Street,
W1B 3HH London
United Kingdom

T: + 44 (0) 20 8123 9659
D: +44 (0) 20 3287 4268

Asia Pacific

Future Market Insights

IndiaLand Global Tech Park, Unit UG-1, Behind Grand HighStreet, Phase 1, Hinjawadi, MH, Pune – 411057, India

Sterile Rubber Stopper Market Outlook from 2024 to 2034

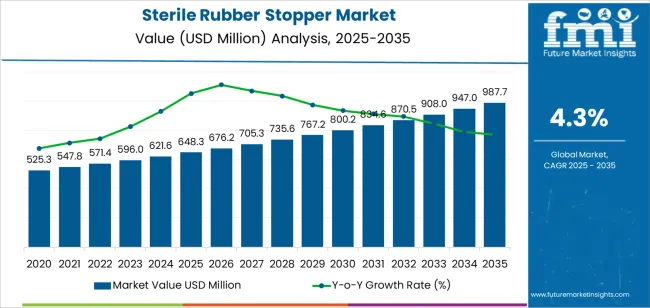
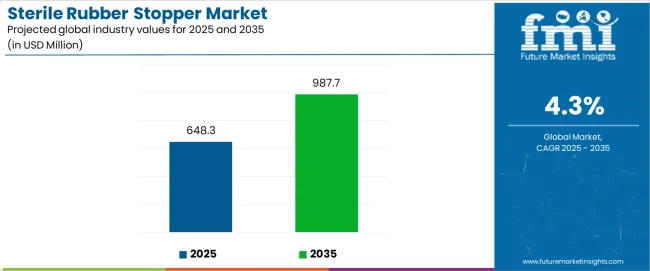
The sterile rubber stopper market is estimated to stand at US$ 621.6 million in 2024. The market is forecasted to exceed a valuation of US$ 947.1 million by 2034. The market is projected to experience moderate growth through 2034, recording a CAGR of 4.3%. Sterile rubber stopper demand is primarily driven by the needs of various industries that rely on aseptic conditions for their processes.

Attributes Details
Estimated Sterile Rubber Stopper Market Size (2024) US$ 621.6 million
Forecasted Market Size (2034) US$ 947.1 million
Projected Value CAGR (2024 to 2034) 4.3%

Don't pay for what you don't need

Customize your report by selecting specific countries or regions and save 30%!

Medicinal Sterile Rubber Stopper Market Overview

  • The healthcare sector, with its constant need for sterile medical equipment, contributes significantly to the demand for these stoppers. Consequently, there is likely to be around a 1.5X surge in the sales of sterile rubber stoppers by 2034.
  • China and India are set to offer intense competition in the market with their advanced manufacturing capabilities and growing pharmaceutical industries.
  • Sterile rubber stopper manufacturers need to think outside the box as well as explore innovative materials and production techniques to stay ahead of the competition.

Key Factors Influencing the Global Sterile Rubber Stopper Market Growth

Sterile Rubber Stoppers Revolutionize Industry Safety! Sterile rubber stoppers have become indispensable across diverse sectors such as pharmaceuticals, medicine, and chemicals.

  • Their ability to forge robust seals and shield against gases, moisture, and UV rays has propelled their demand, driving global sales to new heights.
  • This widespread adoption underscores the crucial role these sterilized rubber seal stoppers play in ensuring product integrity and safety across industries.

Governments Tighten Grip with Pharma Sterilization Rules! Governments and regulatory bodies, including the International Organization for Standardization and the Food and Drug Administration, are implementing stringent sterilization protocols to safeguard the delivery of pharmaceuticals.

  • These regulations aim to uphold the highest standards of safety and efficacy in drug manufacturing and distribution, prioritizing public health and well-being.
  • Compliance with these rigorous guidelines is essential for pharmaceutical companies to maintain trust and confidence in their products within the market.

Advanced Sterilization Drives Safety in Rubber Stopper Manufacturing! The implementation of new sterilization protocols is poised to fuel growth in the sterile rubber stopper industry.

  • In response to stringent regulations, leading companies are adopting cutting-edge sterilization techniques such as autoclaving and gamma irradiation for manufacturing sterile rubber stoppers.
  • This proactive approach ensures compliance with evolving standards while enhancing product safety and quality.
Ismail Sutaria
Ismail Sutaria

Principal Consultant

Talk to Analyst

Find your sweet spots for generating winning opportunities in this market.

Obstacles Compressing the Sterile Rubber Stopper Market Revenue Trends

Fluctuating raw material prices and more options for closures are making it tough for the market to grow. Additionally, strict regulations against using Teflon coatings on sterile rubber stoppers, because of their environmental impact, are expected to slow down sales.

Historical Market Study on Sterile Rubber Stopper alongside Future Projections

From 2019 to 2023, the sterile rubber stopper market showed steady growth, boasting a 5.2% CAGR. During this period, the market faced various challenges, including supply chain disruptions, increasing raw material costs, and stringent regulatory requirements. Additionally, competition intensified with the entry of new players and advancements in alternative packaging technologies.

Despite these obstacles, the market continued to expand due to rising demand from the pharmaceutical and healthcare industries for reliable and contamination-free packaging solutions. This trend has contributed to the positive outlook of the Sterile Rubber Stopper industry.

Attributes Quantitative Outlook
Sterile Rubber Stopper Market Size (2023) US$ 591.5 million
Historical CAGR (2019 to 2023) 5.2%

Short-term Sterile Rubber Stopper Market Analysis

The sterile rubber stopper market global forecast suggests considerable growth owing to the increasing demand for sterile packaging solutions in the healthcare industry.

As advancements in medical technologies continue to rise, the need for reliable and aseptic packaging of pharmaceuticals and medical devices becomes paramount. The market is poised to capitalize on this trend, offering a crucial component in ensuring the integrity and safety of medical products.

Long-term Sterile Rubber Stopper Market Analysis

Global trends in the sterile rubber stopper industry spotlight a dynamic landscape. One notable trend is the increasing demand for specialized medical vial stoppers tailored to specific drug formulations and delivery systems. This trend shows that pharmaceutical companies want packaging that fits their drugs perfectly.

They need it to work well and be safe for patients. Also, new manufacturing technologies like automation and precision molding are making rubber stopper production faster and better. This is expected to have a highly positive impact on the global demand for sterile rubber stoppers in the long run.

Get the data you need at a Fraction of the cost

Personalize your report by choosing insights you need
and save 40%!

Top Opportunities for Sterile Rubber Stopper Manufacturers

Sterile rubber stopper makers are in a good spot as the demand for cleaner packaging is booming. They can benefit from the rise of pharmaceutical and biotech industries. The push for better quality and safety in delivering drugs creates opportunities for using new technologies and materials.

Manufacturers can adapt to changing industry needs. Also, as more people care about the environment, there is a chance for a market for eco-friendly rubber stoppers. This lets manufacturers support environmental concerns and meet the needs of conscious customers.

Sterile Rubber Stopper Market Trends

  • Adoption of advanced manufacturing techniques and materials to enhance the quality and performance of sterile rubber stoppers, such as the use of synthetic rubber compounds and improved molding processes.
  • Another evolving trend in the sterile rubber stopper market is the growing focus on sustainability and eco-friendly packaging solutions. This is leading to the development of biodegradable sterile rubber stoppers to reduce environmental impact.
  • Sterile rubber stopper sales are increasing due to manufacturers recognizing the critical role of quality assurance in pharmaceutical and biotechnology processes.

Comparative Analysis of the Adjacent Sterile Rubber Stopper Global Market

The sterile rubber stopper market stands in contrast to its counterparts, including the sleeve rubber stopper market and the plunger stopper market. After examining the table below, it becomes evident that from 2024 to 2034, the expected growth rates across all three markets are expected to be comparable, showing minimal fluctuations.

This is because each segment caters to distinct yet interconnected industries, forming a symbiotic relationship that influences their parallel trajectories.

Sterile Rubber Stopper Market:

Differentiating Aspects Sterile Rubber Stopper Market
CAGR (2024 to 2034) 4.3%
Growth Factor Growing adoption of prefilled syringes and parenteral drug delivery systems
Key Trend Shift toward sustainable and environmentally friendly materials in packaging

Sleeve Rubber Stopper Market:

Differentiating Aspects Sleeve Rubber Stopper Market
CAGR (2024 to 2034) 5.0%
Growth Factor Expansion of the biopharmaceutical sector and the need for specialized packaging solutions
Key Trend Advancements in drug delivery systems, such as auto-injectors and infusion pumps

Plunger Stopper Market:

Differentiating Aspects Plunger Stopper Market
CAGR (2024 to 2034) 5.4%
Growth Factor Introduction of plunger stoppers with innovative and user-friendly designs
Key Trend Integration of smart technologies, such as sensors and automation, to enhance functionality

Demand Analysis of Sterile Rubber Stopper by Region

The North America sterile rubber stopper market is expected to grow well. This is because of the increasing demand for pharmaceutical products. Europe is witnessing continuous and steady growth in demand for sterile rubber stoppers. This is due to the growing emphasis on healthcare quality and safety

The Asia Pacific sterile rubber stopper industry is likely to make big progress. One reason is the region's growing pharmaceutical sector. Also, increasing healthcare investments contribute to this growth.

Countries Forecasted CAGR (2024 to 2034)
United States 3.5%
Germany 3.1%
Japan 4.5%
China 5.1%
India 5.9%

Government Regulations Drive Surge in Sterile Rubber Stopper Usage in the United States Pharmaceutical Industry

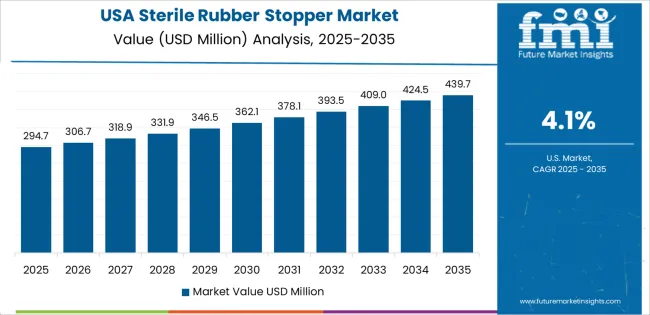
Demand for sterile rubber stoppers in the United States is set to rise with an anticipated CAGR of 3.5% through 2034. Key factors influencing the sterile rubber stopper market include:
  • The government has set rules for how pharmaceutical drugs should be labeled and packaged. Some drug companies here don't have their packaging setup, so these regulations might make them need more injectable packaging components. Because of this, there is a growing use of sterile rubber stoppers in the industry.
  • In the battle against counterfeiters, a multi-level strategy is crucial, with secure packaging playing a key role. The increasing demand for smart and anti-counterfeiting packaging solutions aligns with the stringent regulations imposed by the government. This trend drives the adoption of sterile rubber stoppers, as it becomes an integral component in ensuring the safety and authenticity of pharmaceutical products.

Germany's Homeopathy Sector Boosts Sterile Rubber Stopper Adoption

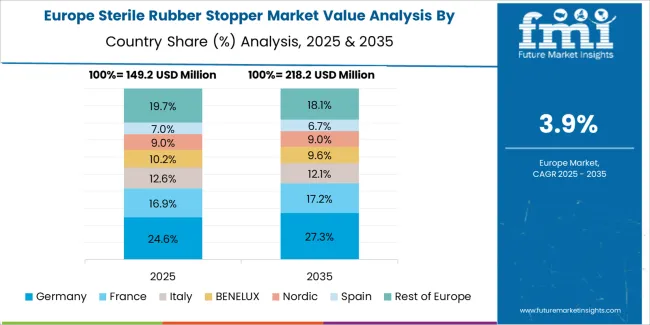
The market in Germany is likely to exhibit a CAGR of 3.1% through 2034. Reasons supporting the growth of the sterile rubber stopper market in the country include:
  • As the demand for sterile devices in the region skyrockets, the sterile rubber stopper market is experiencing a significant surge. The market's growth is fueled by the rising number of hospitals, therapeutic equipment manufacturers, and diagnostic centers.
  • Germany's flourishing homeopathy industry is propelling a surge in demand for specialized medical packaging solutions nationwide. The unique nature of homeopathic medicines necessitates packaging that ensures both efficacy and safety. With the ongoing expansion of the homeopathy sector, there's a heightened requirement for dependable and inventive medical packaging solutions like sterilizable rubber plug stoppers.

Technological Advancements Fuel Surge in Japan's Sterile Rubber Stopper Industry

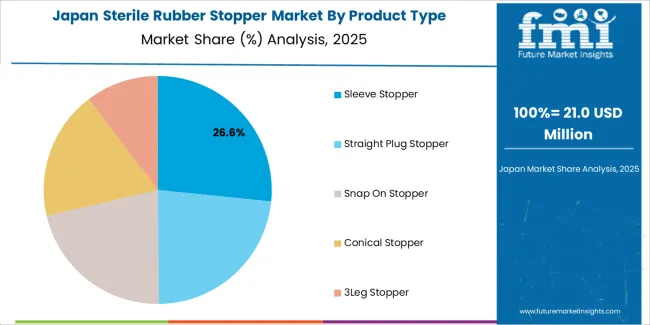
The Japan sterile rubber stopper market is expected to surge at a CAGR of 4.5% through 2034. The topmost dynamic forces supporting the sterile rubber stopper adoption in the country include:

  • The increasing focus on tamper-evident and child-resistant packaging to safeguard the safety and integrity of pharmaceuticals and medical devices is significantly impacting the pharmaceutical packaging stopper market. This emphasis aligns with strict regulatory standards, driving the demand for innovative packaging solutions that offer enhanced security features.
  • The increasing focus on technological advancements and innovation within the healthcare sector further fuels the demand for these packaging solutions. Consequently, the sterile rubber stopper market is significantly impacted, prompting a growing necessity to adapt and innovate.

Innovation Drives Sterile Rubber Stopper Market Growth in China's Healthcare Sector

The adoption of sterile rubber stoppers in China is forecasted to inflate at a CAGR of 5.1% through 2034. Prominent factors backing up the pharmaceutical rubber stopper market growth are:

  • The swift aging of China's population and the escalating healthcare expenditure are fueling a surge in demand for medical products, including essential medical packaging solutions, throughout the country. This demographic shift is significantly influencing the sterile rubber stopper market.
  • The active promotion by the government in the healthcare sector, including the medical packaging market, through policy incentives and investments, is profoundly impacting the sterile rubber stopper market. With stringent regulatory requirements in place, there is a notable push toward the development of innovative and compliant packaging solutions.

Rapid Growth in India's Pharmaceutical Packaging Sector Propels Sterile Rubber Stopper Demand

Sales of sterile rubber stoppers in India are estimated to record a CAGR of 5.9% through 2034. The primary factors bolstering the sterile rubber stopper market size are:

  • The expansion of the sterile rubber stopper industry can be credited to factors such as a growing population, heightened health awareness, and longer life expectancy. These trends are driving increased demand for pharmaceutical packaging solutions, including sterilized vial seals.
  • India's burgeoning pharmaceutical packaging sector is experiencing rapid growth, fueled by the establishment of numerous small and large manufacturing and processing industries. Moreover, as many pharmaceutical companies export their products to overseas markets, they adhere to high-level packaging standards, further boosting demand for quality packaging solutions like sterile rubber stoppers.

Demand Analysis of Sterile Rubber Stopper by Segment

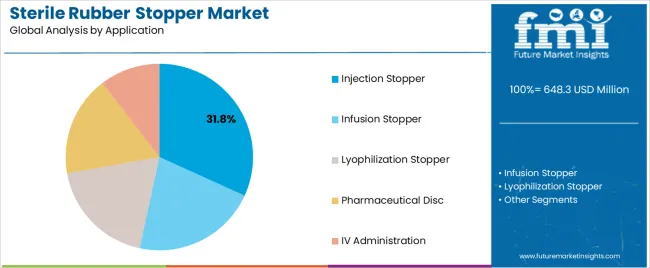
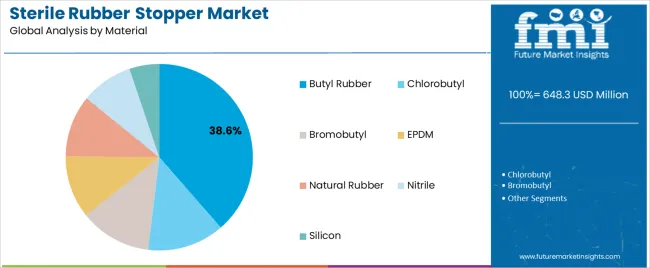
As far as the material of sterile rubber stopper is concerned, the silicone segment is likely to generate significant profit in 2024, holding 32.1% sterile rubber stopper market share. Similarly, the IV administration segment is expected to perform better in terms of application, possessing a 37.3% revenue share of the sterile rubber stopper industry in 2024.

Segment Estimated Market Share in 2024
Silicone 32.1%
IV Administration 37.3%

Silicone Set to Overtake Traditional Materials with Superiority

The silicone segment is poised to become the primary revenue generator within the market. Several key factors contribute to the growing acceptance of silicone, including:

  • Silicone is gaining traction as the preferred material in the market due to its superior properties compared to traditional materials.
  • Silicone's enhanced chemical inertness ensures compatibility with a wide range of substances, while its flexibility and resilience make it suitable for various applications.
  • The material's biocompatibility is crucial for medical and pharmaceutical uses, and advancements in silicone manufacturing technology contribute to its growing reception.

IV Administration Segment Elevates Sterile Rubber Stoppers to Prime Position

The chief position in the market is held by the IV administration segment, a trend substantiated by factors such as:
  • IV administration involves the widespread use of sterile rubber stoppers. These stoppers are crucial components in various medical procedures.
  • The healthcare industry heavily relies on IV administration, further driving the demand for sterile rubber stoppers.
  • Regulatory requirements emphasize the importance of using sterile components in IV setups, amplifying the application of sterile rubber stoppers within this segment.

Competitive Landscape

Sterile rubber stopper market players employ diverse strategies to gain a competitive edge. Some focus on technological innovation, introducing advanced materials and manufacturing processes.

Others prioritize cost leadership, optimizing production efficiency to offer competitive pricing. Customer-centric approaches emphasize tailored solutions and responsive customer service. Market entrants often carve niches by specializing in specific applications.

Key Players and their Top Developments

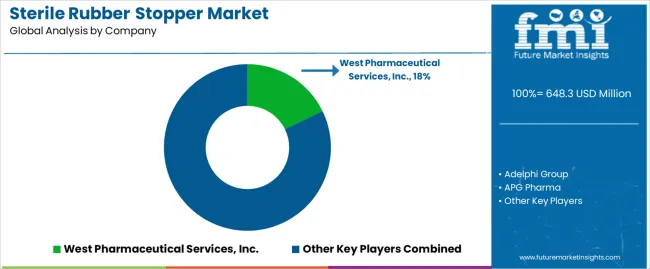
Adelphi Group: Adelphi Group manufactures big batches of sterile rubber stoppers. They have various types, like the West FluroTec injection stoppers. These are good to go and certified sterile and endotoxin-free. Adelphi's stoppers are crafted from bromobutyl latex-free rubber and are suitable for sterilization as per VIA1130 standards.

APG Pharma: APG Pharma serves as a B2B partner offering various sterile rubber stoppers for pharmaceutical use. It provides a wide selection of rubber stoppers, all meeting high-quality standards and manufactured under secure and certified processes following guidelines. Within their standard range, one can find common models for injection vials, infusion vials, and freeze-drying stoppers. These products come in 'ready to sterilize' or 'ready to use' options, ensuring top quality.

West Pharmaceutical Services (WPS): West Pharmaceutical Services provides different rubber stoppers for pharmaceutical vials. These stoppers play a crucial role in shielding drugs from the environment, ensuring their quality and safety. An example is the 4040 LyoTec® ready-to-sterilize stoppers, offering a secure closure for lyophilized drug products. These stoppers have an igloo design to stay stable on the vial when vented.

Key Sterile Rubber Stopper Market Players

  • Adelphi Group
  • APG Pharma
  • SciLabware Ltd.
  • West Pharmaceutical Services, Inc.
  • VWR International, LLC.
  • DWK Life Sciences Inc. (Wheaton Industries)
  • Others

Key Coverage in the Sterile Rubber Stopper Market Research Report

  • Adjacent Study on the Rubber Closure Market and the Biopharmaceutical Stopper Market
  • Recent Developments in Medical Grade Rubber Stoppers
  • Opportunities Available in the Injectable Stopper Market
  • Top Innovations in Sterile Packaging Components

Key Segments Profiled in the Sterile Rubber Stopper Market Survey

By Product Type:

  • Sleeve Stopper
  • Straight Plug Stopper
  • Snap On Stopper
  • Conical Stopper
  • 3Leg Stopper

By Application:

  • Injection Stopper
  • Infusion Stopper
  • Lyophilization Stopper
  • Pharmaceutical Disc
  • IV Administration

By Material:

  • Butyl Rubber
  • Chlorobutyl
  • Bromobutyl
  • EPDM
  • Natural Rubber
  • Nitrile
  • Silicon

By Coating:

  • B2 Coating
  • Flurotech & Teflon Coating

By Sterilization Technology:

  • Autoclavable
  • Gamma Irradiation

By Diameter Size:

  • 13mm
  • 20mm
  • 28mm
  • 32mm

By End Use:

  • Pharmaceutical
  • Medical & Healthcare
  • Chemical
  • Research & Development

By Region:

  • North America
  • Latin America
  • Europe
  • East Asia
  • South Asia
  • Oceania
  • Middle East and Africa

Frequently Asked Questions

How Big is the Sterile Rubber Stopper Market?

The market size for sterile rubber stopper is forecasted to be worth US$ 621.6 million in 2024.

What is the Sales Forecast for Sterile Rubber Stopper?

The sterile rubber stopper market value is projected to surpass US$ 947.1 million by 2034.

What is the Projected CAGR for the Sterile Rubber Stopper Market?

The CAGR of the sterile rubber stopper industry is estimated to be around 4.3% through 2034.

What is the Key Market Trend in Sterile Rubber Stopper?

Increased demand for sterile rubber stoppers in pharmaceutical industry.

Which Countries Drive the Sales of Sterile Rubber Stoppers?

China and India are key consumers of sterile rubber stoppers as of 2024.

What are the Different Types of Sterile Rubber Stoppers?

Sleeve stopper, straight plug stopper, snap on stopper, conical stopper, and 3leg stopper are different type of stoppers.

Which is the Leading Brand of Sterile Rubber Stopper?

Adelphi Group and APG Pharma are sterile rubber stopper industry leaders.

Table of Content

1. Executive Summary

    1.1. Global Market Outlook

    1.2. Demand-side Trends

    1.3. Supply-side Trends

    1.4. Technology Roadmap Analysis

    1.5. Analysis and Recommendations

2. Market Overview

    2.1. Market Coverage / Taxonomy

    2.2. Market Definition / Scope / Limitations

3. Market Background

    3.1. Market Dynamics

        3.1.1. Drivers

        3.1.2. Restraints

        3.1.3. Opportunity

        3.1.4. Trends

    3.2. Scenario Forecast

        3.2.1. Demand in Optimistic Scenario

        3.2.2. Demand in Likely Scenario

        3.2.3. Demand in Conservative Scenario

    3.3. Opportunity Map Analysis

    3.4. Product Life Cycle Analysis

    3.5. Supply Chain Analysis

        3.5.1. Supply Side Participants and their Roles

            3.5.1.1. Manufacturer

            3.5.1.2. Mid-Level Participants (Traders)

            3.5.1.3. Distributors

        3.5.2. Value Added and Value Created at Node in the Supply Chain

        3.5.3. List of Raw Material Suppliers

        3.5.4. List of Existing and Potential Buyer’s

    3.6. Investment Feasibility Matrix

    3.7. Value Chain Analysis

        3.7.1. Profit Margin Analysis

        3.7.2. Distributors

    3.8. PESTLE and Porter’s Analysis

    3.9. Regulatory Landscape

        3.9.1. By Key Regions

        3.9.2. By Key Countries

    3.10. Regional Parent Market Outlook

    3.11. Production and Consumption Statistics

    3.12. Import and Export Statistics

4. Global Market Analysis 2019 to 2023 and Forecast, 2024 to 2034

    4.1. Historical Market Size Value (US$ Million) & Volume (Units) Analysis, 2019 to 2023

    4.2. Current and Future Market Size Value (US$ Million) & Volume (Units) Projections, 2024 to 2034

        4.2.1. Y-o-Y Growth Trend Analysis

        4.2.2. Absolute $ Opportunity Analysis

5. Global Market Analysis 2019 to 2023 and Forecast 2024 to 2034, By Product Type

    5.1. Introduction / Key Findings

    5.2. Historical Market Size Value (US$ Million) & Volume (Units) Analysis By Product Type, 2019 to 2023

    5.3. Current and Future Market Size Value (US$ Million) & Volume (Units) Analysis and Forecast By Product Type, 2024 to 2034

        5.3.1. Sleeve Stopper

        5.3.2. Straight Plug Stopper

        5.3.3. Snap On Stopper

        5.3.4. Conical Stopper

        5.3.5. 3Leg Stopper

    5.4. Y-o-Y Growth Trend Analysis By Product Type, 2019 to 2023

    5.5. Absolute $ Opportunity Analysis By Product Type, 2024 to 2034

6. Global Market Analysis 2019 to 2023 and Forecast 2024 to 2034, By Application

    6.1. Introduction / Key Findings

    6.2. Historical Market Size Value (US$ Million) & Volume (Units) Analysis By Application, 2019 to 2023

    6.3. Current and Future Market Size Value (US$ Million) & Volume (Units) Analysis and Forecast By Application, 2024 to 2034

        6.3.1. Injection Stopper

        6.3.2. Infusion Stopper

        6.3.3. Lyophilisation Stopper

        6.3.4. Pharmaceutical Disc

    6.4. Y-o-Y Growth Trend Analysis By Application, 2019 to 2023

    6.5. Absolute $ Opportunity Analysis By Application, 2024 to 2034

7. Global Market Analysis 2019 to 2023 and Forecast 2024 to 2034, By Material

    7.1. Introduction / Key Findings

    7.2. Historical Market Size Value (US$ Million) & Volume (Units) Analysis By Material, 2019 to 2023

    7.3. Current and Future Market Size Value (US$ Million) & Volume (Units) Analysis and Forecast By Material, 2024 to 2034

        7.3.1. Butyl Rubber

        7.3.2. Chlorobutyl

        7.3.3. Bromobutyl

        7.3.4. EPDM

        7.3.5. Natural Rubber

        7.3.6. Nitrile

        7.3.7. Silicon

    7.4. Y-o-Y Growth Trend Analysis By Material, 2019 to 2023

    7.5. Absolute $ Opportunity Analysis By Material, 2024 to 2034

8. Global Market Analysis 2019 to 2023 and Forecast 2024 to 2034, By Coating

    8.1. Introduction / Key Findings

    8.2. Historical Market Size Value (US$ Million) & Volume (Units) Analysis By Coating, 2019 to 2023

    8.3. Current and Future Market Size Value (US$ Million) & Volume (Units) Analysis and Forecast By Coating, 2024 to 2034

        8.3.1. B2 Coating

        8.3.2. Flurotech & Teflon Coating

    8.4. Y-o-Y Growth Trend Analysis By Coating, 2019 to 2023

    8.5. Absolute $ Opportunity Analysis By Coating, 2024 to 2034

9. Global Market Analysis 2019 to 2023 and Forecast 2024 to 2034, By Sterilization Technology

    9.1. Introduction / Key Findings

    9.2. Historical Market Size Value (US$ Million) & Volume (Units) Analysis By Sterilization Technology, 2019 to 2023

    9.3. Current and Future Market Size Value (US$ Million) & Volume (Units) Analysis and Forecast By Sterilization Technology, 2024 to 2034

        9.3.1. Autoclavable

        9.3.2. Gamma Irradiation

    9.4. Y-o-Y Growth Trend Analysis By Sterilization Technology, 2019 to 2023

    9.5. Absolute $ Opportunity Analysis By Sterilization Technology, 2024 to 2034

10. Global Market Analysis 2019 to 2023 and Forecast 2024 to 2034, By Diameter Size

    10.1. Introduction / Key Findings

    10.2. Historical Market Size Value (US$ Million) & Volume (Units) Analysis By Diameter Size, 2019 to 2023

    10.3. Current and Future Market Size Value (US$ Million) & Volume (Units) Analysis and Forecast By Diameter Size, 2024 to 2034

        10.3.1. 13mm

        10.3.2. 20mm

        10.3.3. 28mm

        10.3.4. 32mm

    10.4. Y-o-Y Growth Trend Analysis By Diameter Size, 2019 to 2023

    10.5. Absolute $ Opportunity Analysis By Diameter Size, 2024 to 2034

11. Global Market Analysis 2019 to 2023 and Forecast 2024 to 2034, By End Use

    11.1. Introduction / Key Findings

    11.2. Historical Market Size Value (US$ Million) & Volume (Units) Analysis By End Use, 2019 to 2023

    11.3. Current and Future Market Size Value (US$ Million) & Volume (Units) Analysis and Forecast By End Use, 2024 to 2034

        11.3.1. Pharmaceutical

        11.3.2. Medical & Healthcare

        11.3.3. Chemical

        11.3.4. Research & Development

    11.4. Y-o-Y Growth Trend Analysis By End Use, 2019 to 2023

    11.5. Absolute $ Opportunity Analysis By End Use, 2024 to 2034

12. Global Market Analysis 2019 to 2023 and Forecast 2024 to 2034, By Region

    12.1. Introduction

    12.2. Historical Market Size Value (US$ Million) & Volume (Units) Analysis By Region, 2019 to 2023

    12.3. Current Market Size Value (US$ Million) & Volume (Units) Analysis and Forecast By Region, 2024 to 2034

        12.3.1. North America

        12.3.2. Latin America

        12.3.3. Western Europe

        12.3.4. Eastern Europe

        12.3.5. South Asia and Pacific

        12.3.6. East Asia

        12.3.7. Middle East and Africa

    12.4. Market Attractiveness Analysis By Region

13. North America Market Analysis 2019 to 2023 and Forecast 2024 to 2034, By Country

    13.1. Historical Market Size Value (US$ Million) & Volume (Units) Trend Analysis By Market Taxonomy, 2019 to 2023

    13.2. Market Size Value (US$ Million) & Volume (Units) Forecast By Market Taxonomy, 2024 to 2034

        13.2.1. By Country

            13.2.1.1. USA

            13.2.1.2. Canada

        13.2.2. By Product Type

        13.2.3. By Application

        13.2.4. By Material

        13.2.5. By Coating

        13.2.6. By Sterilization Technology

        13.2.7. By Diameter Size

        13.2.8. By End Use

    13.3. Market Attractiveness Analysis

        13.3.1. By Country

        13.3.2. By Product Type

        13.3.3. By Application

        13.3.4. By Material

        13.3.5. By Coating

        13.3.6. By Sterilization Technology

        13.3.7. By Diameter Size

        13.3.8. By End Use

    13.4. Key Takeaways

14. Latin America Market Analysis 2019 to 2023 and Forecast 2024 to 2034, By Country

    14.1. Historical Market Size Value (US$ Million) & Volume (Units) Trend Analysis By Market Taxonomy, 2019 to 2023

    14.2. Market Size Value (US$ Million) & Volume (Units) Forecast By Market Taxonomy, 2024 to 2034

        14.2.1. By Country

            14.2.1.1. Brazil

            14.2.1.2. Mexico

            14.2.1.3. Rest of Latin America

        14.2.2. By Product Type

        14.2.3. By Application

        14.2.4. By Material

        14.2.5. By Coating

        14.2.6. By Sterilization Technology

        14.2.7. By Diameter Size

        14.2.8. By End Use

    14.3. Market Attractiveness Analysis

        14.3.1. By Country

        14.3.2. By Product Type

        14.3.3. By Application

        14.3.4. By Material

        14.3.5. By Coating

        14.3.6. By Sterilization Technology

        14.3.7. By Diameter Size

        14.3.8. By End Use

    14.4. Key Takeaways

15. Western Europe Market Analysis 2019 to 2023 and Forecast 2024 to 2034, By Country

    15.1. Historical Market Size Value (US$ Million) & Volume (Units) Trend Analysis By Market Taxonomy, 2019 to 2023

    15.2. Market Size Value (US$ Million) & Volume (Units) Forecast By Market Taxonomy, 2024 to 2034

        15.2.1. By Country

            15.2.1.1. Germany

            15.2.1.2. UK

            15.2.1.3. France

            15.2.1.4. Spain

            15.2.1.5. Italy

            15.2.1.6. Rest of Western Europe

        15.2.2. By Product Type

        15.2.3. By Application

        15.2.4. By Material

        15.2.5. By Coating

        15.2.6. By Sterilization Technology

        15.2.7. By Diameter Size

        15.2.8. By End Use

    15.3. Market Attractiveness Analysis

        15.3.1. By Country

        15.3.2. By Product Type

        15.3.3. By Application

        15.3.4. By Material

        15.3.5. By Coating

        15.3.6. By Sterilization Technology

        15.3.7. By Diameter Size

        15.3.8. By End Use

    15.4. Key Takeaways

16. Eastern Europe Market Analysis 2019 to 2023 and Forecast 2024 to 2034, By Country

    16.1. Historical Market Size Value (US$ Million) & Volume (Units) Trend Analysis By Market Taxonomy, 2019 to 2023

    16.2. Market Size Value (US$ Million) & Volume (Units) Forecast By Market Taxonomy, 2024 to 2034

        16.2.1. By Country

            16.2.1.1. Poland

            16.2.1.2. Russia

            16.2.1.3. Czech Republic

            16.2.1.4. Romania

            16.2.1.5. Rest of Eastern Europe

        16.2.2. By Product Type

        16.2.3. By Application

        16.2.4. By Material

        16.2.5. By Coating

        16.2.6. By Sterilization Technology

        16.2.7. By Diameter Size

        16.2.8. By End Use

    16.3. Market Attractiveness Analysis

        16.3.1. By Country

        16.3.2. By Product Type

        16.3.3. By Application

        16.3.4. By Material

        16.3.5. By Coating

        16.3.6. By Sterilization Technology

        16.3.7. By Diameter Size

        16.3.8. By End Use

    16.4. Key Takeaways

17. South Asia and Pacific Market Analysis 2019 to 2023 and Forecast 2024 to 2034, By Country

    17.1. Historical Market Size Value (US$ Million) & Volume (Units) Trend Analysis By Market Taxonomy, 2019 to 2023

    17.2. Market Size Value (US$ Million) & Volume (Units) Forecast By Market Taxonomy, 2024 to 2034

        17.2.1. By Country

            17.2.1.1. India

            17.2.1.2. Bangladesh

            17.2.1.3. Australia

            17.2.1.4. New Zealand

            17.2.1.5. Rest of South Asia and Pacific

        17.2.2. By Product Type

        17.2.3. By Application

        17.2.4. By Material

        17.2.5. By Coating

        17.2.6. By Sterilization Technology

        17.2.7. By Diameter Size

        17.2.8. By End Use

    17.3. Market Attractiveness Analysis

        17.3.1. By Country

        17.3.2. By Product Type

        17.3.3. By Application

        17.3.4. By Material

        17.3.5. By Coating

        17.3.6. By Sterilization Technology

        17.3.7. By Diameter Size

        17.3.8. By End Use

    17.4. Key Takeaways

18. East Asia Market Analysis 2019 to 2023 and Forecast 2024 to 2034, By Country

    18.1. Historical Market Size Value (US$ Million) & Volume (Units) Trend Analysis By Market Taxonomy, 2019 to 2023

    18.2. Market Size Value (US$ Million) & Volume (Units) Forecast By Market Taxonomy, 2024 to 2034

        18.2.1. By Country

            18.2.1.1. China

            18.2.1.2. Japan

            18.2.1.3. South Korea

        18.2.2. By Product Type

        18.2.3. By Application

        18.2.4. By Material

        18.2.5. By Coating

        18.2.6. By Sterilization Technology

        18.2.7. By Diameter Size

        18.2.8. By End Use

    18.3. Market Attractiveness Analysis

        18.3.1. By Country

        18.3.2. By Product Type

        18.3.3. By Application

        18.3.4. By Material

        18.3.5. By Coating

        18.3.6. By Sterilization Technology

        18.3.7. By Diameter Size

        18.3.8. By End Use

    18.4. Key Takeaways

19. Middle East and Africa Market Analysis 2019 to 2023 and Forecast 2024 to 2034, By Country

    19.1. Historical Market Size Value (US$ Million) & Volume (Units) Trend Analysis By Market Taxonomy, 2019 to 2023

    19.2. Market Size Value (US$ Million) & Volume (Units) Forecast By Market Taxonomy, 2024 to 2034

        19.2.1. By Country

            19.2.1.1. GCC Countries

            19.2.1.2. South Africa

            19.2.1.3. Israel

            19.2.1.4. Rest of MEA

        19.2.2. By Product Type

        19.2.3. By Application

        19.2.4. By Material

        19.2.5. By Coating

        19.2.6. By Sterilization Technology

        19.2.7. By Diameter Size

        19.2.8. By End Use

    19.3. Market Attractiveness Analysis

        19.3.1. By Country

        19.3.2. By Product Type

        19.3.3. By Application

        19.3.4. By Material

        19.3.5. By Coating

        19.3.6. By Sterilization Technology

        19.3.7. By Diameter Size

        19.3.8. By End Use

    19.4. Key Takeaways

20. Key Countries Market Analysis

    20.1. USA

        20.1.1. Pricing Analysis

        20.1.2. Market Share Analysis, 2023

            20.1.2.1. By Product Type

            20.1.2.2. By Application

            20.1.2.3. By Material

            20.1.2.4. By Coating

            20.1.2.5. By Sterilization Technology

            20.1.2.6. By Diameter Size

            20.1.2.7. By End Use

    20.2. Canada

        20.2.1. Pricing Analysis

        20.2.2. Market Share Analysis, 2023

            20.2.2.1. By Product Type

            20.2.2.2. By Application

            20.2.2.3. By Material

            20.2.2.4. By Coating

            20.2.2.5. By Sterilization Technology

            20.2.2.6. By Diameter Size

            20.2.2.7. By End Use

    20.3. Brazil

        20.3.1. Pricing Analysis

        20.3.2. Market Share Analysis, 2023

            20.3.2.1. By Product Type

            20.3.2.2. By Application

            20.3.2.3. By Material

            20.3.2.4. By Coating

            20.3.2.5. By Sterilization Technology

            20.3.2.6. By Diameter Size

            20.3.2.7. By End Use

    20.4. Mexico

        20.4.1. Pricing Analysis

        20.4.2. Market Share Analysis, 2023

            20.4.2.1. By Product Type

            20.4.2.2. By Application

            20.4.2.3. By Material

            20.4.2.4. By Coating

            20.4.2.5. By Sterilization Technology

            20.4.2.6. By Diameter Size

            20.4.2.7. By End Use

    20.5. Germany

        20.5.1. Pricing Analysis

        20.5.2. Market Share Analysis, 2023

            20.5.2.1. By Product Type

            20.5.2.2. By Application

            20.5.2.3. By Material

            20.5.2.4. By Coating

            20.5.2.5. By Sterilization Technology

            20.5.2.6. By Diameter Size

            20.5.2.7. By End Use

    20.6. UK

        20.6.1. Pricing Analysis

        20.6.2. Market Share Analysis, 2023

            20.6.2.1. By Product Type

            20.6.2.2. By Application

            20.6.2.3. By Material

            20.6.2.4. By Coating

            20.6.2.5. By Sterilization Technology

            20.6.2.6. By Diameter Size

            20.6.2.7. By End Use

    20.7. France

        20.7.1. Pricing Analysis

        20.7.2. Market Share Analysis, 2023

            20.7.2.1. By Product Type

            20.7.2.2. By Application

            20.7.2.3. By Material

            20.7.2.4. By Coating

            20.7.2.5. By Sterilization Technology

            20.7.2.6. By Diameter Size

            20.7.2.7. By End Use

    20.8. Spain

        20.8.1. Pricing Analysis

        20.8.2. Market Share Analysis, 2023

            20.8.2.1. By Product Type

            20.8.2.2. By Application

            20.8.2.3. By Material

            20.8.2.4. By Coating

            20.8.2.5. By Sterilization Technology

            20.8.2.6. By Diameter Size

            20.8.2.7. By End Use

    20.9. Italy

        20.9.1. Pricing Analysis

        20.9.2. Market Share Analysis, 2023

            20.9.2.1. By Product Type

            20.9.2.2. By Application

            20.9.2.3. By Material

            20.9.2.4. By Coating

            20.9.2.5. By Sterilization Technology

            20.9.2.6. By Diameter Size

            20.9.2.7. By End Use

    20.10. Poland

        20.10.1. Pricing Analysis

        20.10.2. Market Share Analysis, 2023

            20.10.2.1. By Product Type

            20.10.2.2. By Application

            20.10.2.3. By Material

            20.10.2.4. By Coating

            20.10.2.5. By Sterilization Technology

            20.10.2.6. By Diameter Size

            20.10.2.7. By End Use

    20.11. Russia

        20.11.1. Pricing Analysis

        20.11.2. Market Share Analysis, 2023

            20.11.2.1. By Product Type

            20.11.2.2. By Application

            20.11.2.3. By Material

            20.11.2.4. By Coating

            20.11.2.5. By Sterilization Technology

            20.11.2.6. By Diameter Size

            20.11.2.7. By End Use

    20.12. Czech Republic

        20.12.1. Pricing Analysis

        20.12.2. Market Share Analysis, 2023

            20.12.2.1. By Product Type

            20.12.2.2. By Application

            20.12.2.3. By Material

            20.12.2.4. By Coating

            20.12.2.5. By Sterilization Technology

            20.12.2.6. By Diameter Size

            20.12.2.7. By End Use

    20.13. Romania

        20.13.1. Pricing Analysis

        20.13.2. Market Share Analysis, 2023

            20.13.2.1. By Product Type

            20.13.2.2. By Application

            20.13.2.3. By Material

            20.13.2.4. By Coating

            20.13.2.5. By Sterilization Technology

            20.13.2.6. By Diameter Size

            20.13.2.7. By End Use

    20.14. India

        20.14.1. Pricing Analysis

        20.14.2. Market Share Analysis, 2023

            20.14.2.1. By Product Type

            20.14.2.2. By Application

            20.14.2.3. By Material

            20.14.2.4. By Coating

            20.14.2.5. By Sterilization Technology

            20.14.2.6. By Diameter Size

            20.14.2.7. By End Use

    20.15. Bangladesh

        20.15.1. Pricing Analysis

        20.15.2. Market Share Analysis, 2023

            20.15.2.1. By Product Type

            20.15.2.2. By Application

            20.15.2.3. By Material

            20.15.2.4. By Coating

            20.15.2.5. By Sterilization Technology

            20.15.2.6. By Diameter Size

            20.15.2.7. By End Use

    20.16. Australia

        20.16.1. Pricing Analysis

        20.16.2. Market Share Analysis, 2023

            20.16.2.1. By Product Type

            20.16.2.2. By Application

            20.16.2.3. By Material

            20.16.2.4. By Coating

            20.16.2.5. By Sterilization Technology

            20.16.2.6. By Diameter Size

            20.16.2.7. By End Use

    20.17. New Zealand

        20.17.1. Pricing Analysis

        20.17.2. Market Share Analysis, 2023

            20.17.2.1. By Product Type

            20.17.2.2. By Application

            20.17.2.3. By Material

            20.17.2.4. By Coating

            20.17.2.5. By Sterilization Technology

            20.17.2.6. By Diameter Size

            20.17.2.7. By End Use

    20.18. China

        20.18.1. Pricing Analysis

        20.18.2. Market Share Analysis, 2023

            20.18.2.1. By Product Type

            20.18.2.2. By Application

            20.18.2.3. By Material

            20.18.2.4. By Coating

            20.18.2.5. By Sterilization Technology

            20.18.2.6. By Diameter Size

            20.18.2.7. By End Use

    20.19. Japan

        20.19.1. Pricing Analysis

        20.19.2. Market Share Analysis, 2023

            20.19.2.1. By Product Type

            20.19.2.2. By Application

            20.19.2.3. By Material

            20.19.2.4. By Coating

            20.19.2.5. By Sterilization Technology

            20.19.2.6. By Diameter Size

            20.19.2.7. By End Use

    20.20. South Korea

        20.20.1. Pricing Analysis

        20.20.2. Market Share Analysis, 2023

            20.20.2.1. By Product Type

            20.20.2.2. By Application

            20.20.2.3. By Material

            20.20.2.4. By Coating

            20.20.2.5. By Sterilization Technology

            20.20.2.6. By Diameter Size

            20.20.2.7. By End Use

    20.21. GCC Countries

        20.21.1. Pricing Analysis

        20.21.2. Market Share Analysis, 2023

            20.21.2.1. By Product Type

            20.21.2.2. By Application

            20.21.2.3. By Material

            20.21.2.4. By Coating

            20.21.2.5. By Sterilization Technology

            20.21.2.6. By Diameter Size

            20.21.2.7. By End Use

    20.22. South Africa

        20.22.1. Pricing Analysis

        20.22.2. Market Share Analysis, 2023

            20.22.2.1. By Product Type

            20.22.2.2. By Application

            20.22.2.3. By Material

            20.22.2.4. By Coating

            20.22.2.5. By Sterilization Technology

            20.22.2.6. By Diameter Size

            20.22.2.7. By End Use

    20.23. Israel

        20.23.1. Pricing Analysis

        20.23.2. Market Share Analysis, 2023

            20.23.2.1. By Product Type

            20.23.2.2. By Application

            20.23.2.3. By Material

            20.23.2.4. By Coating

            20.23.2.5. By Sterilization Technology

            20.23.2.6. By Diameter Size

            20.23.2.7. By End Use

21. Market Structure Analysis

    21.1. Competition Dashboard

    21.2. Competition Benchmarking

    21.3. Market Share Analysis of Top Players

        21.3.1. By Regional

        21.3.2. By Product Type

        21.3.3. By Application

        21.3.4. By Material

        21.3.5. By Coating

        21.3.6. By Sterilization Technology

        21.3.7. By Diameter Size

        21.3.8. By End Use

22. Competition Analysis

    22.1. Competition Deep Dive

        22.1.1. Adelphi Group

            22.1.1.1. Overview

            22.1.1.2. Product Portfolio

            22.1.1.3. Profitability by Market Segments

            22.1.1.4. Sales Footprint

            22.1.1.5. Strategy Overview

                22.1.1.5.1. Marketing Strategy

                22.1.1.5.2. Product Strategy

                22.1.1.5.3. Channel Strategy

        22.1.2. APG Pharma

            22.1.2.1. Overview

            22.1.2.2. Product Portfolio

            22.1.2.3. Profitability by Market Segments

            22.1.2.4. Sales Footprint

            22.1.2.5. Strategy Overview

                22.1.2.5.1. Marketing Strategy

                22.1.2.5.2. Product Strategy

                22.1.2.5.3. Channel Strategy

        22.1.3. SciLabware Ltd.

            22.1.3.1. Overview

            22.1.3.2. Product Portfolio

            22.1.3.3. Profitability by Market Segments

            22.1.3.4. Sales Footprint

            22.1.3.5. Strategy Overview

                22.1.3.5.1. Marketing Strategy

                22.1.3.5.2. Product Strategy

                22.1.3.5.3. Channel Strategy

        22.1.4. West Pharmaceutical Services, Inc.

            22.1.4.1. Overview

            22.1.4.2. Product Portfolio

            22.1.4.3. Profitability by Market Segments

            22.1.4.4. Sales Footprint

            22.1.4.5. Strategy Overview

                22.1.4.5.1. Marketing Strategy

                22.1.4.5.2. Product Strategy

                22.1.4.5.3. Channel Strategy

        22.1.5. VWR International, LLC.

            22.1.5.1. Overview

            22.1.5.2. Product Portfolio

            22.1.5.3. Profitability by Market Segments

            22.1.5.4. Sales Footprint

            22.1.5.5. Strategy Overview

                22.1.5.5.1. Marketing Strategy

                22.1.5.5.2. Product Strategy

                22.1.5.5.3. Channel Strategy

        22.1.6. DWK Life Sciences Inc. (Wheaton Industries)

            22.1.6.1. Overview

            22.1.6.2. Product Portfolio

            22.1.6.3. Profitability by Market Segments

            22.1.6.4. Sales Footprint

            22.1.6.5. Strategy Overview

                22.1.6.5.1. Marketing Strategy

                22.1.6.5.2. Product Strategy

                22.1.6.5.3. Channel Strategy

        22.1.7. Carclo Plc

            22.1.7.1. Overview

            22.1.7.2. Product Portfolio

            22.1.7.3. Profitability by Market Segments

            22.1.7.4. Sales Footprint

            22.1.7.5. Strategy Overview

                22.1.7.5.1. Marketing Strategy

                22.1.7.5.2. Product Strategy

                22.1.7.5.3. Channel Strategy

        22.1.8. Teleflex Incorporated

            22.1.8.1. Overview

            22.1.8.2. Product Portfolio

            22.1.8.3. Profitability by Market Segments

            22.1.8.4. Sales Footprint

            22.1.8.5. Strategy Overview

                22.1.8.5.1. Marketing Strategy

                22.1.8.5.2. Product Strategy

                22.1.8.5.3. Channel Strategy

        22.1.9. JSR Corporation

            22.1.9.1. Overview

            22.1.9.2. Product Portfolio

            22.1.9.3. Profitability by Market Segments

            22.1.9.4. Sales Footprint

            22.1.9.5. Strategy Overview

                22.1.9.5.1. Marketing Strategy

                22.1.9.5.2. Product Strategy

                22.1.9.5.3. Channel Strategy

        22.1.10. Schott AG

            22.1.10.1. Overview

            22.1.10.2. Product Portfolio

            22.1.10.3. Profitability by Market Segments

            22.1.10.4. Sales Footprint

            22.1.10.5. Strategy Overview

                22.1.10.5.1. Marketing Strategy

                22.1.10.5.2. Product Strategy

                22.1.10.5.3. Channel Strategy

23. Assumptions & Acronyms Used

24. Research Methodology

Don't pay for what you don't need

Customize your report by selecting specific countries or regions and save 30%!

List of Tables

Table 1: Global Market Value (US$ Million) Forecast by Region, 2019 to 2034

Table 2: Global Market Volume (Units) Forecast by Region, 2019 to 2034

Table 3: Global Market Value (US$ Million) Forecast by Product Type, 2019 to 2034

Table 4: Global Market Volume (Units) Forecast by Product Type, 2019 to 2034

Table 5: Global Market Value (US$ Million) Forecast by Application, 2019 to 2034

Table 6: Global Market Volume (Units) Forecast by Application, 2019 to 2034

Table 7: Global Market Value (US$ Million) Forecast by Material, 2019 to 2034

Table 8: Global Market Volume (Units) Forecast by Material, 2019 to 2034

Table 9: Global Market Value (US$ Million) Forecast by Coating, 2019 to 2034

Table 10: Global Market Volume (Units) Forecast by Coating, 2019 to 2034

Table 11: Global Market Value (US$ Million) Forecast by Sterilization Technology, 2019 to 2034

Table 12: Global Market Volume (Units) Forecast by Sterilization Technology, 2019 to 2034

Table 13: Global Market Value (US$ Million) Forecast by Diameter Size, 2019 to 2034

Table 14: Global Market Volume (Units) Forecast by Diameter Size, 2019 to 2034

Table 15: Global Market Value (US$ Million) Forecast by End Use, 2019 to 2034

Table 16: Global Market Volume (Units) Forecast by End Use, 2019 to 2034

Table 17: North America Market Value (US$ Million) Forecast by Country, 2019 to 2034

Table 18: North America Market Volume (Units) Forecast by Country, 2019 to 2034

Table 19: North America Market Value (US$ Million) Forecast by Product Type, 2019 to 2034

Table 20: North America Market Volume (Units) Forecast by Product Type, 2019 to 2034

Table 21: North America Market Value (US$ Million) Forecast by Application, 2019 to 2034

Table 22: North America Market Volume (Units) Forecast by Application, 2019 to 2034

Table 23: North America Market Value (US$ Million) Forecast by Material, 2019 to 2034

Table 24: North America Market Volume (Units) Forecast by Material, 2019 to 2034

Table 25: North America Market Value (US$ Million) Forecast by Coating, 2019 to 2034

Table 26: North America Market Volume (Units) Forecast by Coating, 2019 to 2034

Table 27: North America Market Value (US$ Million) Forecast by Sterilization Technology, 2019 to 2034

Table 28: North America Market Volume (Units) Forecast by Sterilization Technology, 2019 to 2034

Table 29: North America Market Value (US$ Million) Forecast by Diameter Size, 2019 to 2034

Table 30: North America Market Volume (Units) Forecast by Diameter Size, 2019 to 2034

Table 31: North America Market Value (US$ Million) Forecast by End Use, 2019 to 2034

Table 32: North America Market Volume (Units) Forecast by End Use, 2019 to 2034

Table 33: Latin America Market Value (US$ Million) Forecast by Country, 2019 to 2034

Table 34: Latin America Market Volume (Units) Forecast by Country, 2019 to 2034

Table 35: Latin America Market Value (US$ Million) Forecast by Product Type, 2019 to 2034

Table 36: Latin America Market Volume (Units) Forecast by Product Type, 2019 to 2034

Table 37: Latin America Market Value (US$ Million) Forecast by Application, 2019 to 2034

Table 38: Latin America Market Volume (Units) Forecast by Application, 2019 to 2034

Table 39: Latin America Market Value (US$ Million) Forecast by Material, 2019 to 2034

Table 40: Latin America Market Volume (Units) Forecast by Material, 2019 to 2034

Table 41: Latin America Market Value (US$ Million) Forecast by Coating, 2019 to 2034

Table 42: Latin America Market Volume (Units) Forecast by Coating, 2019 to 2034

Table 43: Latin America Market Value (US$ Million) Forecast by Sterilization Technology, 2019 to 2034

Table 44: Latin America Market Volume (Units) Forecast by Sterilization Technology, 2019 to 2034

Table 45: Latin America Market Value (US$ Million) Forecast by Diameter Size, 2019 to 2034

Table 46: Latin America Market Volume (Units) Forecast by Diameter Size, 2019 to 2034

Table 47: Latin America Market Value (US$ Million) Forecast by End Use, 2019 to 2034

Table 48: Latin America Market Volume (Units) Forecast by End Use, 2019 to 2034

Table 49: Western Europe Market Value (US$ Million) Forecast by Country, 2019 to 2034

Table 50: Western Europe Market Volume (Units) Forecast by Country, 2019 to 2034

Table 51: Western Europe Market Value (US$ Million) Forecast by Product Type, 2019 to 2034

Table 52: Western Europe Market Volume (Units) Forecast by Product Type, 2019 to 2034

Table 53: Western Europe Market Value (US$ Million) Forecast by Application, 2019 to 2034

Table 54: Western Europe Market Volume (Units) Forecast by Application, 2019 to 2034

Table 55: Western Europe Market Value (US$ Million) Forecast by Material, 2019 to 2034

Table 56: Western Europe Market Volume (Units) Forecast by Material, 2019 to 2034

Table 57: Western Europe Market Value (US$ Million) Forecast by Coating, 2019 to 2034

Table 58: Western Europe Market Volume (Units) Forecast by Coating, 2019 to 2034

Table 59: Western Europe Market Value (US$ Million) Forecast by Sterilization Technology, 2019 to 2034

Table 60: Western Europe Market Volume (Units) Forecast by Sterilization Technology, 2019 to 2034

Table 61: Western Europe Market Value (US$ Million) Forecast by Diameter Size, 2019 to 2034

Table 62: Western Europe Market Volume (Units) Forecast by Diameter Size, 2019 to 2034

Table 63: Western Europe Market Value (US$ Million) Forecast by End Use, 2019 to 2034

Table 64: Western Europe Market Volume (Units) Forecast by End Use, 2019 to 2034

Table 65: Eastern Europe Market Value (US$ Million) Forecast by Country, 2019 to 2034

Table 66: Eastern Europe Market Volume (Units) Forecast by Country, 2019 to 2034

Table 67: Eastern Europe Market Value (US$ Million) Forecast by Product Type, 2019 to 2034

Table 68: Eastern Europe Market Volume (Units) Forecast by Product Type, 2019 to 2034

Table 69: Eastern Europe Market Value (US$ Million) Forecast by Application, 2019 to 2034

Table 70: Eastern Europe Market Volume (Units) Forecast by Application, 2019 to 2034

Table 71: Eastern Europe Market Value (US$ Million) Forecast by Material, 2019 to 2034

Table 72: Eastern Europe Market Volume (Units) Forecast by Material, 2019 to 2034

Table 73: Eastern Europe Market Value (US$ Million) Forecast by Coating, 2019 to 2034

Table 74: Eastern Europe Market Volume (Units) Forecast by Coating, 2019 to 2034

Table 75: Eastern Europe Market Value (US$ Million) Forecast by Sterilization Technology, 2019 to 2034

Table 76: Eastern Europe Market Volume (Units) Forecast by Sterilization Technology, 2019 to 2034

Table 77: Eastern Europe Market Value (US$ Million) Forecast by Diameter Size, 2019 to 2034

Table 78: Eastern Europe Market Volume (Units) Forecast by Diameter Size, 2019 to 2034

Table 79: Eastern Europe Market Value (US$ Million) Forecast by End Use, 2019 to 2034

Table 80: Eastern Europe Market Volume (Units) Forecast by End Use, 2019 to 2034

Table 81: South Asia and Pacific Market Value (US$ Million) Forecast by Country, 2019 to 2034

Table 82: South Asia and Pacific Market Volume (Units) Forecast by Country, 2019 to 2034

Table 83: South Asia and Pacific Market Value (US$ Million) Forecast by Product Type, 2019 to 2034

Table 84: South Asia and Pacific Market Volume (Units) Forecast by Product Type, 2019 to 2034

Table 85: South Asia and Pacific Market Value (US$ Million) Forecast by Application, 2019 to 2034

Table 86: South Asia and Pacific Market Volume (Units) Forecast by Application, 2019 to 2034

Table 87: South Asia and Pacific Market Value (US$ Million) Forecast by Material, 2019 to 2034

Table 88: South Asia and Pacific Market Volume (Units) Forecast by Material, 2019 to 2034

Table 89: South Asia and Pacific Market Value (US$ Million) Forecast by Coating, 2019 to 2034

Table 90: South Asia and Pacific Market Volume (Units) Forecast by Coating, 2019 to 2034

Table 91: South Asia and Pacific Market Value (US$ Million) Forecast by Sterilization Technology, 2019 to 2034

Table 92: South Asia and Pacific Market Volume (Units) Forecast by Sterilization Technology, 2019 to 2034

Table 93: South Asia and Pacific Market Value (US$ Million) Forecast by Diameter Size, 2019 to 2034

Table 94: South Asia and Pacific Market Volume (Units) Forecast by Diameter Size, 2019 to 2034

Table 95: South Asia and Pacific Market Value (US$ Million) Forecast by End Use, 2019 to 2034

Table 96: South Asia and Pacific Market Volume (Units) Forecast by End Use, 2019 to 2034

Table 97: East Asia Market Value (US$ Million) Forecast by Country, 2019 to 2034

Table 98: East Asia Market Volume (Units) Forecast by Country, 2019 to 2034

Table 99: East Asia Market Value (US$ Million) Forecast by Product Type, 2019 to 2034

Table 100: East Asia Market Volume (Units) Forecast by Product Type, 2019 to 2034

Table 101: East Asia Market Value (US$ Million) Forecast by Application, 2019 to 2034

Table 102: East Asia Market Volume (Units) Forecast by Application, 2019 to 2034

Table 103: East Asia Market Value (US$ Million) Forecast by Material, 2019 to 2034

Table 104: East Asia Market Volume (Units) Forecast by Material, 2019 to 2034

Table 105: East Asia Market Value (US$ Million) Forecast by Coating, 2019 to 2034

Table 106: East Asia Market Volume (Units) Forecast by Coating, 2019 to 2034

Table 107: East Asia Market Value (US$ Million) Forecast by Sterilization Technology, 2019 to 2034

Table 108: East Asia Market Volume (Units) Forecast by Sterilization Technology, 2019 to 2034

Table 109: East Asia Market Value (US$ Million) Forecast by Diameter Size, 2019 to 2034

Table 110: East Asia Market Volume (Units) Forecast by Diameter Size, 2019 to 2034

Table 111: East Asia Market Value (US$ Million) Forecast by End Use, 2019 to 2034

Table 112: East Asia Market Volume (Units) Forecast by End Use, 2019 to 2034

Table 113: Middle East and Africa Market Value (US$ Million) Forecast by Country, 2019 to 2034

Table 114: Middle East and Africa Market Volume (Units) Forecast by Country, 2019 to 2034

Table 115: Middle East and Africa Market Value (US$ Million) Forecast by Product Type, 2019 to 2034

Table 116: Middle East and Africa Market Volume (Units) Forecast by Product Type, 2019 to 2034

Table 117: Middle East and Africa Market Value (US$ Million) Forecast by Application, 2019 to 2034

Table 118: Middle East and Africa Market Volume (Units) Forecast by Application, 2019 to 2034

Table 119: Middle East and Africa Market Value (US$ Million) Forecast by Material, 2019 to 2034

Table 120: Middle East and Africa Market Volume (Units) Forecast by Material, 2019 to 2034

Table 121: Middle East and Africa Market Value (US$ Million) Forecast by Coating, 2019 to 2034

Table 122: Middle East and Africa Market Volume (Units) Forecast by Coating, 2019 to 2034

Table 123: Middle East and Africa Market Value (US$ Million) Forecast by Sterilization Technology, 2019 to 2034

Table 124: Middle East and Africa Market Volume (Units) Forecast by Sterilization Technology, 2019 to 2034

Table 125: Middle East and Africa Market Value (US$ Million) Forecast by Diameter Size, 2019 to 2034

Table 126: Middle East and Africa Market Volume (Units) Forecast by Diameter Size, 2019 to 2034

Table 127: Middle East and Africa Market Value (US$ Million) Forecast by End Use, 2019 to 2034

Table 128: Middle East and Africa Market Volume (Units) Forecast by End Use, 2019 to 2034
Ismail Sutaria
Ismail Sutaria

Principal Consultant

Talk to Analyst

Find your sweet spots for generating winning opportunities in this market.

List of Charts

Figure 1: Global Market Value (US$ Million) by Product Type, 2024 to 2034

Figure 2: Global Market Value (US$ Million) by Application, 2024 to 2034

Figure 3: Global Market Value (US$ Million) by Material, 2024 to 2034

Figure 4: Global Market Value (US$ Million) by Coating, 2024 to 2034

Figure 5: Global Market Value (US$ Million) by Sterilization Technology, 2024 to 2034

Figure 6: Global Market Value (US$ Million) by Diameter Size, 2024 to 2034

Figure 7: Global Market Value (US$ Million) by End Use, 2024 to 2034

Figure 8: Global Market Value (US$ Million) by Region, 2024 to 2034

Figure 9: Global Market Value (US$ Million) Analysis by Region, 2019 to 2034

Figure 10: Global Market Volume (Units) Analysis by Region, 2019 to 2034

Figure 11: Global Market Value Share (%) and BPS Analysis by Region, 2024 to 2034

Figure 12: Global Market Y-o-Y Growth (%) Projections by Region, 2024 to 2034

Figure 13: Global Market Value (US$ Million) Analysis by Product Type, 2019 to 2034

Figure 14: Global Market Volume (Units) Analysis by Product Type, 2019 to 2034

Figure 15: Global Market Value Share (%) and BPS Analysis by Product Type, 2024 to 2034

Figure 16: Global Market Y-o-Y Growth (%) Projections by Product Type, 2024 to 2034

Figure 17: Global Market Value (US$ Million) Analysis by Application, 2019 to 2034

Figure 18: Global Market Volume (Units) Analysis by Application, 2019 to 2034

Figure 19: Global Market Value Share (%) and BPS Analysis by Application, 2024 to 2034

Figure 20: Global Market Y-o-Y Growth (%) Projections by Application, 2024 to 2034

Figure 21: Global Market Value (US$ Million) Analysis by Material, 2019 to 2034

Figure 22: Global Market Volume (Units) Analysis by Material, 2019 to 2034

Figure 23: Global Market Value Share (%) and BPS Analysis by Material, 2024 to 2034

Figure 24: Global Market Y-o-Y Growth (%) Projections by Material, 2024 to 2034

Figure 25: Global Market Value (US$ Million) Analysis by Coating, 2019 to 2034

Figure 26: Global Market Volume (Units) Analysis by Coating, 2019 to 2034

Figure 27: Global Market Value Share (%) and BPS Analysis by Coating, 2024 to 2034

Figure 28: Global Market Y-o-Y Growth (%) Projections by Coating, 2024 to 2034

Figure 29: Global Market Value (US$ Million) Analysis by Sterilization Technology, 2019 to 2034

Figure 30: Global Market Volume (Units) Analysis by Sterilization Technology, 2019 to 2034

Figure 31: Global Market Value Share (%) and BPS Analysis by Sterilization Technology, 2024 to 2034

Figure 32: Global Market Y-o-Y Growth (%) Projections by Sterilization Technology, 2024 to 2034

Figure 33: Global Market Value (US$ Million) Analysis by Diameter Size, 2019 to 2034

Figure 34: Global Market Volume (Units) Analysis by Diameter Size, 2019 to 2034

Figure 35: Global Market Value Share (%) and BPS Analysis by Diameter Size, 2024 to 2034

Figure 36: Global Market Y-o-Y Growth (%) Projections by Diameter Size, 2024 to 2034

Figure 37: Global Market Value (US$ Million) Analysis by End Use, 2019 to 2034

Figure 38: Global Market Volume (Units) Analysis by End Use, 2019 to 2034

Figure 39: Global Market Value Share (%) and BPS Analysis by End Use, 2024 to 2034

Figure 40: Global Market Y-o-Y Growth (%) Projections by End Use, 2024 to 2034

Figure 41: Global Market Attractiveness by Product Type, 2024 to 2034

Figure 42: Global Market Attractiveness by Application, 2024 to 2034

Figure 43: Global Market Attractiveness by Material, 2024 to 2034

Figure 44: Global Market Attractiveness by Coating, 2024 to 2034

Figure 45: Global Market Attractiveness by Sterilization Technology, 2024 to 2034

Figure 46: Global Market Attractiveness by Diameter Size, 2024 to 2034

Figure 47: Global Market Attractiveness by End Use, 2024 to 2034

Figure 48: Global Market Attractiveness by Region, 2024 to 2034

Figure 49: North America Market Value (US$ Million) by Product Type, 2024 to 2034

Figure 50: North America Market Value (US$ Million) by Application, 2024 to 2034

Figure 51: North America Market Value (US$ Million) by Material, 2024 to 2034

Figure 52: North America Market Value (US$ Million) by Coating, 2024 to 2034

Figure 53: North America Market Value (US$ Million) by Sterilization Technology, 2024 to 2034

Figure 54: North America Market Value (US$ Million) by Diameter Size, 2024 to 2034

Figure 55: North America Market Value (US$ Million) by End Use, 2024 to 2034

Figure 56: North America Market Value (US$ Million) by Country, 2024 to 2034

Figure 57: North America Market Value (US$ Million) Analysis by Country, 2019 to 2034

Figure 58: North America Market Volume (Units) Analysis by Country, 2019 to 2034

Figure 59: North America Market Value Share (%) and BPS Analysis by Country, 2024 to 2034

Figure 60: North America Market Y-o-Y Growth (%) Projections by Country, 2024 to 2034

Figure 61: North America Market Value (US$ Million) Analysis by Product Type, 2019 to 2034

Figure 62: North America Market Volume (Units) Analysis by Product Type, 2019 to 2034

Figure 63: North America Market Value Share (%) and BPS Analysis by Product Type, 2024 to 2034

Figure 64: North America Market Y-o-Y Growth (%) Projections by Product Type, 2024 to 2034

Figure 65: North America Market Value (US$ Million) Analysis by Application, 2019 to 2034

Figure 66: North America Market Volume (Units) Analysis by Application, 2019 to 2034

Figure 67: North America Market Value Share (%) and BPS Analysis by Application, 2024 to 2034

Figure 68: North America Market Y-o-Y Growth (%) Projections by Application, 2024 to 2034

Figure 69: North America Market Value (US$ Million) Analysis by Material, 2019 to 2034

Figure 70: North America Market Volume (Units) Analysis by Material, 2019 to 2034

Figure 71: North America Market Value Share (%) and BPS Analysis by Material, 2024 to 2034

Figure 72: North America Market Y-o-Y Growth (%) Projections by Material, 2024 to 2034

Figure 73: North America Market Value (US$ Million) Analysis by Coating, 2019 to 2034

Figure 74: North America Market Volume (Units) Analysis by Coating, 2019 to 2034

Figure 75: North America Market Value Share (%) and BPS Analysis by Coating, 2024 to 2034

Figure 76: North America Market Y-o-Y Growth (%) Projections by Coating, 2024 to 2034

Figure 77: North America Market Value (US$ Million) Analysis by Sterilization Technology, 2019 to 2034

Figure 78: North America Market Volume (Units) Analysis by Sterilization Technology, 2019 to 2034

Figure 79: North America Market Value Share (%) and BPS Analysis by Sterilization Technology, 2024 to 2034

Figure 80: North America Market Y-o-Y Growth (%) Projections by Sterilization Technology, 2024 to 2034

Figure 81: North America Market Value (US$ Million) Analysis by Diameter Size, 2019 to 2034

Figure 82: North America Market Volume (Units) Analysis by Diameter Size, 2019 to 2034

Figure 83: North America Market Value Share (%) and BPS Analysis by Diameter Size, 2024 to 2034

Figure 84: North America Market Y-o-Y Growth (%) Projections by Diameter Size, 2024 to 2034

Figure 85: North America Market Value (US$ Million) Analysis by End Use, 2019 to 2034

Figure 86: North America Market Volume (Units) Analysis by End Use, 2019 to 2034

Figure 87: North America Market Value Share (%) and BPS Analysis by End Use, 2024 to 2034

Figure 88: North America Market Y-o-Y Growth (%) Projections by End Use, 2024 to 2034

Figure 89: North America Market Attractiveness by Product Type, 2024 to 2034

Figure 90: North America Market Attractiveness by Application, 2024 to 2034

Figure 91: North America Market Attractiveness by Material, 2024 to 2034

Figure 92: North America Market Attractiveness by Coating, 2024 to 2034

Figure 93: North America Market Attractiveness by Sterilization Technology, 2024 to 2034

Figure 94: North America Market Attractiveness by Diameter Size, 2024 to 2034

Figure 95: North America Market Attractiveness by End Use, 2024 to 2034

Figure 96: North America Market Attractiveness by Country, 2024 to 2034

Figure 97: Latin America Market Value (US$ Million) by Product Type, 2024 to 2034

Figure 98: Latin America Market Value (US$ Million) by Application, 2024 to 2034

Figure 99: Latin America Market Value (US$ Million) by Material, 2024 to 2034

Figure 100: Latin America Market Value (US$ Million) by Coating, 2024 to 2034

Figure 101: Latin America Market Value (US$ Million) by Sterilization Technology, 2024 to 2034

Figure 102: Latin America Market Value (US$ Million) by Diameter Size, 2024 to 2034

Figure 103: Latin America Market Value (US$ Million) by End Use, 2024 to 2034

Figure 104: Latin America Market Value (US$ Million) by Country, 2024 to 2034

Figure 105: Latin America Market Value (US$ Million) Analysis by Country, 2019 to 2034

Figure 106: Latin America Market Volume (Units) Analysis by Country, 2019 to 2034

Figure 107: Latin America Market Value Share (%) and BPS Analysis by Country, 2024 to 2034

Figure 108: Latin America Market Y-o-Y Growth (%) Projections by Country, 2024 to 2034

Figure 109: Latin America Market Value (US$ Million) Analysis by Product Type, 2019 to 2034

Figure 110: Latin America Market Volume (Units) Analysis by Product Type, 2019 to 2034

Figure 111: Latin America Market Value Share (%) and BPS Analysis by Product Type, 2024 to 2034

Figure 112: Latin America Market Y-o-Y Growth (%) Projections by Product Type, 2024 to 2034

Figure 113: Latin America Market Value (US$ Million) Analysis by Application, 2019 to 2034

Figure 114: Latin America Market Volume (Units) Analysis by Application, 2019 to 2034

Figure 115: Latin America Market Value Share (%) and BPS Analysis by Application, 2024 to 2034

Figure 116: Latin America Market Y-o-Y Growth (%) Projections by Application, 2024 to 2034

Figure 117: Latin America Market Value (US$ Million) Analysis by Material, 2019 to 2034

Figure 118: Latin America Market Volume (Units) Analysis by Material, 2019 to 2034

Figure 119: Latin America Market Value Share (%) and BPS Analysis by Material, 2024 to 2034

Figure 120: Latin America Market Y-o-Y Growth (%) Projections by Material, 2024 to 2034

Figure 121: Latin America Market Value (US$ Million) Analysis by Coating, 2019 to 2034

Figure 122: Latin America Market Volume (Units) Analysis by Coating, 2019 to 2034

Figure 123: Latin America Market Value Share (%) and BPS Analysis by Coating, 2024 to 2034

Figure 124: Latin America Market Y-o-Y Growth (%) Projections by Coating, 2024 to 2034

Figure 125: Latin America Market Value (US$ Million) Analysis by Sterilization Technology, 2019 to 2034

Figure 126: Latin America Market Volume (Units) Analysis by Sterilization Technology, 2019 to 2034

Figure 127: Latin America Market Value Share (%) and BPS Analysis by Sterilization Technology, 2024 to 2034

Figure 128: Latin America Market Y-o-Y Growth (%) Projections by Sterilization Technology, 2024 to 2034

Figure 129: Latin America Market Value (US$ Million) Analysis by Diameter Size, 2019 to 2034

Figure 130: Latin America Market Volume (Units) Analysis by Diameter Size, 2019 to 2034

Figure 131: Latin America Market Value Share (%) and BPS Analysis by Diameter Size, 2024 to 2034

Figure 132: Latin America Market Y-o-Y Growth (%) Projections by Diameter Size, 2024 to 2034

Figure 133: Latin America Market Value (US$ Million) Analysis by End Use, 2019 to 2034

Figure 134: Latin America Market Volume (Units) Analysis by End Use, 2019 to 2034

Figure 135: Latin America Market Value Share (%) and BPS Analysis by End Use, 2024 to 2034

Figure 136: Latin America Market Y-o-Y Growth (%) Projections by End Use, 2024 to 2034

Figure 137: Latin America Market Attractiveness by Product Type, 2024 to 2034

Figure 138: Latin America Market Attractiveness by Application, 2024 to 2034

Figure 139: Latin America Market Attractiveness by Material, 2024 to 2034

Figure 140: Latin America Market Attractiveness by Coating, 2024 to 2034

Figure 141: Latin America Market Attractiveness by Sterilization Technology, 2024 to 2034

Figure 142: Latin America Market Attractiveness by Diameter Size, 2024 to 2034

Figure 143: Latin America Market Attractiveness by End Use, 2024 to 2034

Figure 144: Latin America Market Attractiveness by Country, 2024 to 2034

Figure 145: Western Europe Market Value (US$ Million) by Product Type, 2024 to 2034

Figure 146: Western Europe Market Value (US$ Million) by Application, 2024 to 2034

Figure 147: Western Europe Market Value (US$ Million) by Material, 2024 to 2034

Figure 148: Western Europe Market Value (US$ Million) by Coating, 2024 to 2034

Figure 149: Western Europe Market Value (US$ Million) by Sterilization Technology, 2024 to 2034

Figure 150: Western Europe Market Value (US$ Million) by Diameter Size, 2024 to 2034

Figure 151: Western Europe Market Value (US$ Million) by End Use, 2024 to 2034

Figure 152: Western Europe Market Value (US$ Million) by Country, 2024 to 2034

Figure 153: Western Europe Market Value (US$ Million) Analysis by Country, 2019 to 2034

Figure 154: Western Europe Market Volume (Units) Analysis by Country, 2019 to 2034

Figure 155: Western Europe Market Value Share (%) and BPS Analysis by Country, 2024 to 2034

Figure 156: Western Europe Market Y-o-Y Growth (%) Projections by Country, 2024 to 2034

Figure 157: Western Europe Market Value (US$ Million) Analysis by Product Type, 2019 to 2034

Figure 158: Western Europe Market Volume (Units) Analysis by Product Type, 2019 to 2034

Figure 159: Western Europe Market Value Share (%) and BPS Analysis by Product Type, 2024 to 2034

Figure 160: Western Europe Market Y-o-Y Growth (%) Projections by Product Type, 2024 to 2034

Figure 161: Western Europe Market Value (US$ Million) Analysis by Application, 2019 to 2034

Figure 162: Western Europe Market Volume (Units) Analysis by Application, 2019 to 2034

Figure 163: Western Europe Market Value Share (%) and BPS Analysis by Application, 2024 to 2034

Figure 164: Western Europe Market Y-o-Y Growth (%) Projections by Application, 2024 to 2034

Figure 165: Western Europe Market Value (US$ Million) Analysis by Material, 2019 to 2034

Figure 166: Western Europe Market Volume (Units) Analysis by Material, 2019 to 2034

Figure 167: Western Europe Market Value Share (%) and BPS Analysis by Material, 2024 to 2034

Figure 168: Western Europe Market Y-o-Y Growth (%) Projections by Material, 2024 to 2034

Figure 169: Western Europe Market Value (US$ Million) Analysis by Coating, 2019 to 2034

Figure 170: Western Europe Market Volume (Units) Analysis by Coating, 2019 to 2034

Figure 171: Western Europe Market Value Share (%) and BPS Analysis by Coating, 2024 to 2034

Figure 172: Western Europe Market Y-o-Y Growth (%) Projections by Coating, 2024 to 2034

Figure 173: Western Europe Market Value (US$ Million) Analysis by Sterilization Technology, 2019 to 2034

Figure 174: Western Europe Market Volume (Units) Analysis by Sterilization Technology, 2019 to 2034

Figure 175: Western Europe Market Value Share (%) and BPS Analysis by Sterilization Technology, 2024 to 2034

Figure 176: Western Europe Market Y-o-Y Growth (%) Projections by Sterilization Technology, 2024 to 2034

Figure 177: Western Europe Market Value (US$ Million) Analysis by Diameter Size, 2019 to 2034

Figure 178: Western Europe Market Volume (Units) Analysis by Diameter Size, 2019 to 2034

Figure 179: Western Europe Market Value Share (%) and BPS Analysis by Diameter Size, 2024 to 2034

Figure 180: Western Europe Market Y-o-Y Growth (%) Projections by Diameter Size, 2024 to 2034

Figure 181: Western Europe Market Value (US$ Million) Analysis by End Use, 2019 to 2034

Figure 182: Western Europe Market Volume (Units) Analysis by End Use, 2019 to 2034

Figure 183: Western Europe Market Value Share (%) and BPS Analysis by End Use, 2024 to 2034

Figure 184: Western Europe Market Y-o-Y Growth (%) Projections by End Use, 2024 to 2034

Figure 185: Western Europe Market Attractiveness by Product Type, 2024 to 2034

Figure 186: Western Europe Market Attractiveness by Application, 2024 to 2034

Figure 187: Western Europe Market Attractiveness by Material, 2024 to 2034

Figure 188: Western Europe Market Attractiveness by Coating, 2024 to 2034

Figure 189: Western Europe Market Attractiveness by Sterilization Technology, 2024 to 2034

Figure 190: Western Europe Market Attractiveness by Diameter Size, 2024 to 2034

Figure 191: Western Europe Market Attractiveness by End Use, 2024 to 2034

Figure 192: Western Europe Market Attractiveness by Country, 2024 to 2034

Figure 193: Eastern Europe Market Value (US$ Million) by Product Type, 2024 to 2034

Figure 194: Eastern Europe Market Value (US$ Million) by Application, 2024 to 2034

Figure 195: Eastern Europe Market Value (US$ Million) by Material, 2024 to 2034

Figure 196: Eastern Europe Market Value (US$ Million) by Coating, 2024 to 2034

Figure 197: Eastern Europe Market Value (US$ Million) by Sterilization Technology, 2024 to 2034

Figure 198: Eastern Europe Market Value (US$ Million) by Diameter Size, 2024 to 2034

Figure 199: Eastern Europe Market Value (US$ Million) by End Use, 2024 to 2034

Figure 200: Eastern Europe Market Value (US$ Million) by Country, 2024 to 2034

Figure 201: Eastern Europe Market Value (US$ Million) Analysis by Country, 2019 to 2034

Figure 202: Eastern Europe Market Volume (Units) Analysis by Country, 2019 to 2034

Figure 203: Eastern Europe Market Value Share (%) and BPS Analysis by Country, 2024 to 2034

Figure 204: Eastern Europe Market Y-o-Y Growth (%) Projections by Country, 2024 to 2034

Figure 205: Eastern Europe Market Value (US$ Million) Analysis by Product Type, 2019 to 2034

Figure 206: Eastern Europe Market Volume (Units) Analysis by Product Type, 2019 to 2034

Figure 207: Eastern Europe Market Value Share (%) and BPS Analysis by Product Type, 2024 to 2034

Figure 208: Eastern Europe Market Y-o-Y Growth (%) Projections by Product Type, 2024 to 2034

Figure 209: Eastern Europe Market Value (US$ Million) Analysis by Application, 2019 to 2034

Figure 210: Eastern Europe Market Volume (Units) Analysis by Application, 2019 to 2034

Figure 211: Eastern Europe Market Value Share (%) and BPS Analysis by Application, 2024 to 2034

Figure 212: Eastern Europe Market Y-o-Y Growth (%) Projections by Application, 2024 to 2034

Figure 213: Eastern Europe Market Value (US$ Million) Analysis by Material, 2019 to 2034

Figure 214: Eastern Europe Market Volume (Units) Analysis by Material, 2019 to 2034

Figure 215: Eastern Europe Market Value Share (%) and BPS Analysis by Material, 2024 to 2034

Figure 216: Eastern Europe Market Y-o-Y Growth (%) Projections by Material, 2024 to 2034

Figure 217: Eastern Europe Market Value (US$ Million) Analysis by Coating, 2019 to 2034

Figure 218: Eastern Europe Market Volume (Units) Analysis by Coating, 2019 to 2034

Figure 219: Eastern Europe Market Value Share (%) and BPS Analysis by Coating, 2024 to 2034

Figure 220: Eastern Europe Market Y-o-Y Growth (%) Projections by Coating, 2024 to 2034

Figure 221: Eastern Europe Market Value (US$ Million) Analysis by Sterilization Technology, 2019 to 2034

Figure 222: Eastern Europe Market Volume (Units) Analysis by Sterilization Technology, 2019 to 2034

Figure 223: Eastern Europe Market Value Share (%) and BPS Analysis by Sterilization Technology, 2024 to 2034

Figure 224: Eastern Europe Market Y-o-Y Growth (%) Projections by Sterilization Technology, 2024 to 2034

Figure 225: Eastern Europe Market Value (US$ Million) Analysis by Diameter Size, 2019 to 2034

Figure 226: Eastern Europe Market Volume (Units) Analysis by Diameter Size, 2019 to 2034

Figure 227: Eastern Europe Market Value Share (%) and BPS Analysis by Diameter Size, 2024 to 2034

Figure 228: Eastern Europe Market Y-o-Y Growth (%) Projections by Diameter Size, 2024 to 2034

Figure 229: Eastern Europe Market Value (US$ Million) Analysis by End Use, 2019 to 2034

Figure 230: Eastern Europe Market Volume (Units) Analysis by End Use, 2019 to 2034

Figure 231: Eastern Europe Market Value Share (%) and BPS Analysis by End Use, 2024 to 2034

Figure 232: Eastern Europe Market Y-o-Y Growth (%) Projections by End Use, 2024 to 2034

Figure 233: Eastern Europe Market Attractiveness by Product Type, 2024 to 2034

Figure 234: Eastern Europe Market Attractiveness by Application, 2024 to 2034

Figure 235: Eastern Europe Market Attractiveness by Material, 2024 to 2034

Figure 236: Eastern Europe Market Attractiveness by Coating, 2024 to 2034

Figure 237: Eastern Europe Market Attractiveness by Sterilization Technology, 2024 to 2034

Figure 238: Eastern Europe Market Attractiveness by Diameter Size, 2024 to 2034

Figure 239: Eastern Europe Market Attractiveness by End Use, 2024 to 2034

Figure 240: Eastern Europe Market Attractiveness by Country, 2024 to 2034

Figure 241: South Asia and Pacific Market Value (US$ Million) by Product Type, 2024 to 2034

Figure 242: South Asia and Pacific Market Value (US$ Million) by Application, 2024 to 2034

Figure 243: South Asia and Pacific Market Value (US$ Million) by Material, 2024 to 2034

Figure 244: South Asia and Pacific Market Value (US$ Million) by Coating, 2024 to 2034

Figure 245: South Asia and Pacific Market Value (US$ Million) by Sterilization Technology, 2024 to 2034

Figure 246: South Asia and Pacific Market Value (US$ Million) by Diameter Size, 2024 to 2034

Figure 247: South Asia and Pacific Market Value (US$ Million) by End Use, 2024 to 2034

Figure 248: South Asia and Pacific Market Value (US$ Million) by Country, 2024 to 2034

Figure 249: South Asia and Pacific Market Value (US$ Million) Analysis by Country, 2019 to 2034

Figure 250: South Asia and Pacific Market Volume (Units) Analysis by Country, 2019 to 2034

Figure 251: South Asia and Pacific Market Value Share (%) and BPS Analysis by Country, 2024 to 2034

Figure 252: South Asia and Pacific Market Y-o-Y Growth (%) Projections by Country, 2024 to 2034

Figure 253: South Asia and Pacific Market Value (US$ Million) Analysis by Product Type, 2019 to 2034

Figure 254: South Asia and Pacific Market Volume (Units) Analysis by Product Type, 2019 to 2034

Figure 255: South Asia and Pacific Market Value Share (%) and BPS Analysis by Product Type, 2024 to 2034

Figure 256: South Asia and Pacific Market Y-o-Y Growth (%) Projections by Product Type, 2024 to 2034

Figure 257: South Asia and Pacific Market Value (US$ Million) Analysis by Application, 2019 to 2034

Figure 258: South Asia and Pacific Market Volume (Units) Analysis by Application, 2019 to 2034

Figure 259: South Asia and Pacific Market Value Share (%) and BPS Analysis by Application, 2024 to 2034

Figure 260: South Asia and Pacific Market Y-o-Y Growth (%) Projections by Application, 2024 to 2034

Figure 261: South Asia and Pacific Market Value (US$ Million) Analysis by Material, 2019 to 2034

Figure 262: South Asia and Pacific Market Volume (Units) Analysis by Material, 2019 to 2034

Figure 263: South Asia and Pacific Market Value Share (%) and BPS Analysis by Material, 2024 to 2034

Figure 264: South Asia and Pacific Market Y-o-Y Growth (%) Projections by Material, 2024 to 2034

Figure 265: South Asia and Pacific Market Value (US$ Million) Analysis by Coating, 2019 to 2034

Figure 266: South Asia and Pacific Market Volume (Units) Analysis by Coating, 2019 to 2034

Figure 267: South Asia and Pacific Market Value Share (%) and BPS Analysis by Coating, 2024 to 2034

Figure 268: South Asia and Pacific Market Y-o-Y Growth (%) Projections by Coating, 2024 to 2034

Figure 269: South Asia and Pacific Market Value (US$ Million) Analysis by Sterilization Technology, 2019 to 2034

Figure 270: South Asia and Pacific Market Volume (Units) Analysis by Sterilization Technology, 2019 to 2034

Figure 271: South Asia and Pacific Market Value Share (%) and BPS Analysis by Sterilization Technology, 2024 to 2034

Figure 272: South Asia and Pacific Market Y-o-Y Growth (%) Projections by Sterilization Technology, 2024 to 2034

Figure 273: South Asia and Pacific Market Value (US$ Million) Analysis by Diameter Size, 2019 to 2034

Figure 274: South Asia and Pacific Market Volume (Units) Analysis by Diameter Size, 2019 to 2034

Figure 275: South Asia and Pacific Market Value Share (%) and BPS Analysis by Diameter Size, 2024 to 2034

Figure 276: South Asia and Pacific Market Y-o-Y Growth (%) Projections by Diameter Size, 2024 to 2034

Figure 277: South Asia and Pacific Market Value (US$ Million) Analysis by End Use, 2019 to 2034

Figure 278: South Asia and Pacific Market Volume (Units) Analysis by End Use, 2019 to 2034

Figure 279: South Asia and Pacific Market Value Share (%) and BPS Analysis by End Use, 2024 to 2034

Figure 280: South Asia and Pacific Market Y-o-Y Growth (%) Projections by End Use, 2024 to 2034

Figure 281: South Asia and Pacific Market Attractiveness by Product Type, 2024 to 2034

Figure 282: South Asia and Pacific Market Attractiveness by Application, 2024 to 2034

Figure 283: South Asia and Pacific Market Attractiveness by Material, 2024 to 2034

Figure 284: South Asia and Pacific Market Attractiveness by Coating, 2024 to 2034

Figure 285: South Asia and Pacific Market Attractiveness by Sterilization Technology, 2024 to 2034

Figure 286: South Asia and Pacific Market Attractiveness by Diameter Size, 2024 to 2034

Figure 287: South Asia and Pacific Market Attractiveness by End Use, 2024 to 2034

Figure 288: South Asia and Pacific Market Attractiveness by Country, 2024 to 2034

Figure 289: East Asia Market Value (US$ Million) by Product Type, 2024 to 2034

Figure 290: East Asia Market Value (US$ Million) by Application, 2024 to 2034

Figure 291: East Asia Market Value (US$ Million) by Material, 2024 to 2034

Figure 292: East Asia Market Value (US$ Million) by Coating, 2024 to 2034

Figure 293: East Asia Market Value (US$ Million) by Sterilization Technology, 2024 to 2034

Figure 294: East Asia Market Value (US$ Million) by Diameter Size, 2024 to 2034

Figure 295: East Asia Market Value (US$ Million) by End Use, 2024 to 2034

Figure 296: East Asia Market Value (US$ Million) by Country, 2024 to 2034

Figure 297: East Asia Market Value (US$ Million) Analysis by Country, 2019 to 2034

Figure 298: East Asia Market Volume (Units) Analysis by Country, 2019 to 2034

Figure 299: East Asia Market Value Share (%) and BPS Analysis by Country, 2024 to 2034

Figure 300: East Asia Market Y-o-Y Growth (%) Projections by Country, 2024 to 2034

Figure 301: East Asia Market Value (US$ Million) Analysis by Product Type, 2019 to 2034

Figure 302: East Asia Market Volume (Units) Analysis by Product Type, 2019 to 2034

Figure 303: East Asia Market Value Share (%) and BPS Analysis by Product Type, 2024 to 2034

Figure 304: East Asia Market Y-o-Y Growth (%) Projections by Product Type, 2024 to 2034

Figure 305: East Asia Market Value (US$ Million) Analysis by Application, 2019 to 2034

Figure 306: East Asia Market Volume (Units) Analysis by Application, 2019 to 2034

Figure 307: East Asia Market Value Share (%) and BPS Analysis by Application, 2024 to 2034

Figure 308: East Asia Market Y-o-Y Growth (%) Projections by Application, 2024 to 2034

Figure 309: East Asia Market Value (US$ Million) Analysis by Material, 2019 to 2034

Figure 310: East Asia Market Volume (Units) Analysis by Material, 2019 to 2034

Figure 311: East Asia Market Value Share (%) and BPS Analysis by Material, 2024 to 2034

Figure 312: East Asia Market Y-o-Y Growth (%) Projections by Material, 2024 to 2034

Figure 313: East Asia Market Value (US$ Million) Analysis by Coating, 2019 to 2034

Figure 314: East Asia Market Volume (Units) Analysis by Coating, 2019 to 2034

Figure 315: East Asia Market Value Share (%) and BPS Analysis by Coating, 2024 to 2034

Figure 316: East Asia Market Y-o-Y Growth (%) Projections by Coating, 2024 to 2034

Figure 317: East Asia Market Value (US$ Million) Analysis by Sterilization Technology, 2019 to 2034

Figure 318: East Asia Market Volume (Units) Analysis by Sterilization Technology, 2019 to 2034

Figure 319: East Asia Market Value Share (%) and BPS Analysis by Sterilization Technology, 2024 to 2034

Figure 320: East Asia Market Y-o-Y Growth (%) Projections by Sterilization Technology, 2024 to 2034

Figure 321: East Asia Market Value (US$ Million) Analysis by Diameter Size, 2019 to 2034

Figure 322: East Asia Market Volume (Units) Analysis by Diameter Size, 2019 to 2034

Figure 323: East Asia Market Value Share (%) and BPS Analysis by Diameter Size, 2024 to 2034

Figure 324: East Asia Market Y-o-Y Growth (%) Projections by Diameter Size, 2024 to 2034

Figure 325: East Asia Market Value (US$ Million) Analysis by End Use, 2019 to 2034

Figure 326: East Asia Market Volume (Units) Analysis by End Use, 2019 to 2034

Figure 327: East Asia Market Value Share (%) and BPS Analysis by End Use, 2024 to 2034

Figure 328: East Asia Market Y-o-Y Growth (%) Projections by End Use, 2024 to 2034

Figure 329: East Asia Market Attractiveness by Product Type, 2024 to 2034

Figure 330: East Asia Market Attractiveness by Application, 2024 to 2034

Figure 331: East Asia Market Attractiveness by Material, 2024 to 2034

Figure 332: East Asia Market Attractiveness by Coating, 2024 to 2034

Figure 333: East Asia Market Attractiveness by Sterilization Technology, 2024 to 2034

Figure 334: East Asia Market Attractiveness by Diameter Size, 2024 to 2034

Figure 335: East Asia Market Attractiveness by End Use, 2024 to 2034

Figure 336: East Asia Market Attractiveness by Country, 2024 to 2034

Figure 337: Middle East and Africa Market Value (US$ Million) by Product Type, 2024 to 2034

Figure 338: Middle East and Africa Market Value (US$ Million) by Application, 2024 to 2034

Figure 339: Middle East and Africa Market Value (US$ Million) by Material, 2024 to 2034

Figure 340: Middle East and Africa Market Value (US$ Million) by Coating, 2024 to 2034

Figure 341: Middle East and Africa Market Value (US$ Million) by Sterilization Technology, 2024 to 2034

Figure 342: Middle East and Africa Market Value (US$ Million) by Diameter Size, 2024 to 2034

Figure 343: Middle East and Africa Market Value (US$ Million) by End Use, 2024 to 2034

Figure 344: Middle East and Africa Market Value (US$ Million) by Country, 2024 to 2034

Figure 345: Middle East and Africa Market Value (US$ Million) Analysis by Country, 2019 to 2034

Figure 346: Middle East and Africa Market Volume (Units) Analysis by Country, 2019 to 2034

Figure 347: Middle East and Africa Market Value Share (%) and BPS Analysis by Country, 2024 to 2034

Figure 348: Middle East and Africa Market Y-o-Y Growth (%) Projections by Country, 2024 to 2034

Figure 349: Middle East and Africa Market Value (US$ Million) Analysis by Product Type, 2019 to 2034

Figure 350: Middle East and Africa Market Volume (Units) Analysis by Product Type, 2019 to 2034

Figure 351: Middle East and Africa Market Value Share (%) and BPS Analysis by Product Type, 2024 to 2034

Figure 352: Middle East and Africa Market Y-o-Y Growth (%) Projections by Product Type, 2024 to 2034

Figure 353: Middle East and Africa Market Value (US$ Million) Analysis by Application, 2019 to 2034

Figure 354: Middle East and Africa Market Volume (Units) Analysis by Application, 2019 to 2034

Figure 355: Middle East and Africa Market Value Share (%) and BPS Analysis by Application, 2024 to 2034

Figure 356: Middle East and Africa Market Y-o-Y Growth (%) Projections by Application, 2024 to 2034

Figure 357: Middle East and Africa Market Value (US$ Million) Analysis by Material, 2019 to 2034

Figure 358: Middle East and Africa Market Volume (Units) Analysis by Material, 2019 to 2034

Figure 359: Middle East and Africa Market Value Share (%) and BPS Analysis by Material, 2024 to 2034

Figure 360: Middle East and Africa Market Y-o-Y Growth (%) Projections by Material, 2024 to 2034

Figure 361: Middle East and Africa Market Value (US$ Million) Analysis by Coating, 2019 to 2034

Figure 362: Middle East and Africa Market Volume (Units) Analysis by Coating, 2019 to 2034

Figure 363: Middle East and Africa Market Value Share (%) and BPS Analysis by Coating, 2024 to 2034

Figure 364: Middle East and Africa Market Y-o-Y Growth (%) Projections by Coating, 2024 to 2034

Figure 365: Middle East and Africa Market Value (US$ Million) Analysis by Sterilization Technology, 2019 to 2034

Figure 366: Middle East and Africa Market Volume (Units) Analysis by Sterilization Technology, 2019 to 2034

Figure 367: Middle East and Africa Market Value Share (%) and BPS Analysis by Sterilization Technology, 2024 to 2034

Figure 368: Middle East and Africa Market Y-o-Y Growth (%) Projections by Sterilization Technology, 2024 to 2034

Figure 369: Middle East and Africa Market Value (US$ Million) Analysis by Diameter Size, 2019 to 2034

Figure 370: Middle East and Africa Market Volume (Units) Analysis by Diameter Size, 2019 to 2034

Figure 371: Middle East and Africa Market Value Share (%) and BPS Analysis by Diameter Size, 2024 to 2034

Figure 372: Middle East and Africa Market Y-o-Y Growth (%) Projections by Diameter Size, 2024 to 2034

Figure 373: Middle East and Africa Market Value (US$ Million) Analysis by End Use, 2019 to 2034

Figure 374: Middle East and Africa Market Volume (Units) Analysis by End Use, 2019 to 2034

Figure 375: Middle East and Africa Market Value Share (%) and BPS Analysis by End Use, 2024 to 2034

Figure 376: Middle East and Africa Market Y-o-Y Growth (%) Projections by End Use, 2024 to 2034

Figure 377: Middle East and Africa Market Attractiveness by Product Type, 2024 to 2034

Figure 378: Middle East and Africa Market Attractiveness by Application, 2024 to 2034

Figure 379: Middle East and Africa Market Attractiveness by Material, 2024 to 2034

Figure 380: Middle East and Africa Market Attractiveness by Coating, 2024 to 2034

Figure 381: Middle East and Africa Market Attractiveness by Sterilization Technology, 2024 to 2034

Figure 382: Middle East and Africa Market Attractiveness by Diameter Size, 2024 to 2034

Figure 383: Middle East and Africa Market Attractiveness by End Use, 2024 to 2034

Figure 384: Middle East and Africa Market Attractiveness by Country, 2024 to 2034

Recommendations

Packaging

Snap on Rubber Stopper Market

Published : April 2023

Packaging

Sleeve Rubber Stoppers Market

Published : August 2022

Explore Packaging Insights

View Reports

Sterile Rubber Stopper Market