Sterile Prep-Pack Workstations Market Size and Share Forecast Outlook 2025 to 2035

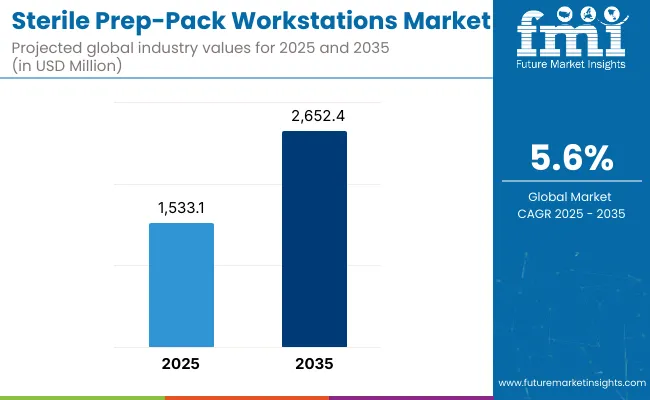
The sterile pre-pack workstations market is expected to grow to a valuation of USD 1,533.1 million in 2025. By 2035, demand is anticipated to grow to USD 2,652.4 million, at a CAGR of 5.6% during the forecast period.
Quick Stats for Sterile Prep-Pack Workstations Market

  • Industry Value (2025): USD 1,533.1 million
  • Forecast Value (2035): USD 2,652.4 million
  • Forecast CAGR: 5.6%
  • Leading Segment in 2025: Laminar Flow Workstations (28.5% market share)
  • Key Growth Region: Asia Pacific, Europe, North America
  • Top Key Players: Getinge AB, STERIS, Skytron LLC, MAC Medical Inc, Belimed Inc. (Steelco S.p.A), Pure Processing LLC, Coulmed Products, BOSTONtec, Reos Medical

Sterile Prep Pack Workstations Market

Metric Value
Sterile Prep Pack Workstations Estimated Value in (2025) USD 1,533.1 million
Sterile Prep Pack Workstations Estimated Value in (2035) USD 2,652.4 million
Forecast CAGR (2025 to 2035) 5.6%

The Compounding Aseptic Isolators (CAIs) segment will rise to 24.5% by 2030, while Automated Sterile Prep-Pack Stations will remain niche at under 15% share. The second half from 2030 to 2035 contributes USD 635.9 million which is equal to 56.8% of the total growth as the market jumps from USD 2016.5 million to USD 2652.4 million.

This acceleration is powered by widespread adoption of these devices in end user settings. Laminar Flow Workstations and Compounding Aseptic Isolators (CAIs) together capture a large share of above 54.5% by the end of the decade. Biological Safety Cabinets (BSCs) is likely to hold around 23.0% surpassing traditional ergonomic tables.

From 2020 to 2024, the overall Sterile Prep‑Pack Workstation grew from USD 1212.7 million to USD 1449.0 million. Leading manufacturers such as Getinge, Steris and Skytron, LLC together account for nearly 52.5% of global revenue through bundled instruments and ergonomic workstation sales. Key strategies deployed by these players include advances in ergonomics, integration of modular storage packagesand partnerships with sterile processing departments to pilot new workflows.

In 2025, the Sterile Prep-Pack Workstations market is expected to reach a value of approximately USD 1533.1 million, driven by a shift from basic ergonomic worktables to digitally integrated sterile workspace ecosystems. Growth will be propelled by hospital investments in workflow optimization, infection prevention, and compliance with USP <797> and <800> standards. Sterile processing departments (SPDs) are increasingly adopting modular and height-adjustable systems equipped with task lighting, instrument tracking modules, and HEPA-filtered airflow controls to improve staff productivity and reduce contamination risks.

Why is the Sterile Prep-Pack Workstations Market Growing?

Sterile Prep‑Pack Workstations are seeing strong growth because healthcare facilities worldwide face mounting pressure to reduce surgical site infections, improve process efficiency, and support staff ergonomics. Major drivers include stricter sterilization compliance and infection control regulations, increasing surgical volumes, and labor shortage in sterile processing departments.

Innovations such as height‑adjustable stainless‑steel workstations with integrated storage, along with sensor‑based workflow monitoring, reduce assembly time and human errorand generate measurable ROI for hospitals. The pandemic amplified demand for reliable sterile workflows, accelerating adoption of high‑performance prep‑pack stations.

As hospital budgets prioritize operator safety and throughput, manufacturers who deliver hygienic surfaces, efficient layouts, and traceability modules are achieving robust sales. In countries with expanding healthcare infrastructureparticularly in North America and Asia Pacific, these new facilities and upgrades is further boosting demand.

Segmental Analysis

The market is segmented by product, application, end-user, and region. Product include Laminar Flow Workstations, Compounding Aseptic Isolators (CAIs), Biological Safety Cabinets (BSCs), Automated Sterile Prep-Pack Stations and Modular Cleanroom Workstations highlighting the core elements driving adoption.

Application classification covers Hospital Sterile Compounding, Pharmaceutical Manufacturing, Clinical Trial Packaging, Biotech & Research Aseptic Use, Veterinary and Specialty Use and Others. Based on End User, the segmentation includes Hospitals, Compounding Pharmacies (503A/503B), Biopharmaceutical Manufacturing, Research Institutes & CROs, Veterinary Clinics & Labs. Regionally, the scope spans North America, Latin America, Western and Eastern Europe, East Asia, South Asia and Pacific, and the Middle East and Africa.
Insights into the Product Segment with Laminar Flow Workstations Leading in Market Share

Sterile Prep Pack Workstations Market Analysis By Product Type

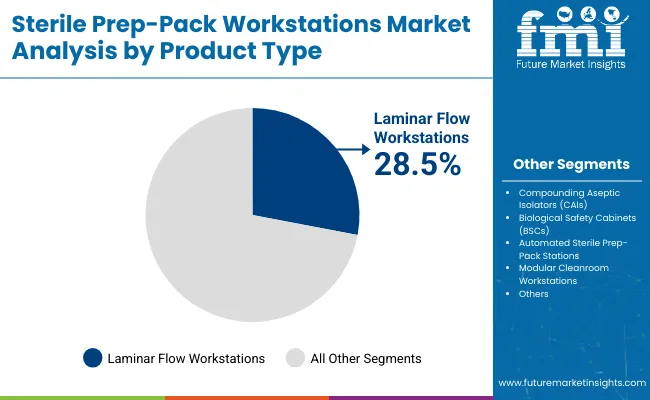
Laminar flow workstations are expected to retain a dominant position and is expected to contribute 28.5% in 2025 owing to their ability to ensure ISO-classified clean air environments. Their adoption has been driven by the rising global emphasis on contamination control and aseptic workflows in sterile processing departments.

Preference has been increasingly shown for these units due to their ability to direct airflow uniformly, minimizing particulate spread during packaging and labeling. Product installations have also been incentivized by regulatory agencies recommending controlled environments for surgical instrument prep and packaging. These factors have collectively contributed to the sustained demand for laminar flow models over conventional worktables in high-throughput hospital and central sterile supply settings.

Product Market Share (%)
Laminar Flow Workstations 28.5%
Compounding Aseptic Isolators (CAIs) 24.0%
Biological Safety Cabinets (BSCs) 22.5%
Automated Sterile Prep-Pack Stations 15.0%
Modular Cleanroom Workstations 10.0%

Insights into the Application Segment with Hospital Sterile Compounding Dominating the Demand

Sterile Prep Pack Workstations Market Analysis By Application

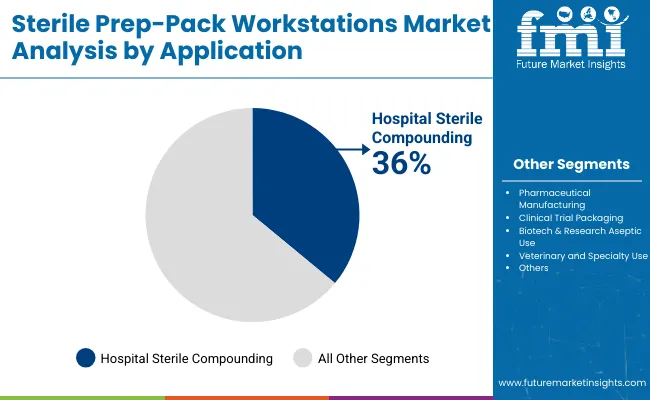
Hospital sterile compounding has emerged as the leading application area and is projected to hold around 36.0% in 2025 due to increased regulatory oversight and the rising complexity of parenteral drug preparations. Regulatory bodies such as USP and FDA have mandated stricter environmental controls and quality assurance in compounding spaces.

As a result, sterile prep-pack workstations tailored for compounding tasks especially in chemotherapy, TPN, and IV admixture preparations have been more widely installed. Additionally, the growth in personalized medicine and biologics has increased the volume of high-risk compounded medications, necessitating dedicated sterile workspaces that comply with cleanroom-grade standards.

Application Market Share (%)
Hospital Sterile Compounding 36.0%
Pharmaceutical Manufacturing 30.0%
Clinical Trial Packaging 10.0%
Biotech & Research Aseptic Use 12.0%
Veterinary and Specialty Use 7.0%
Others 5.0%

Insights into the End User Segment with Highest Installed Base Among Hospitals

Sterile Prep Pack Workstations Market Analysis By End User

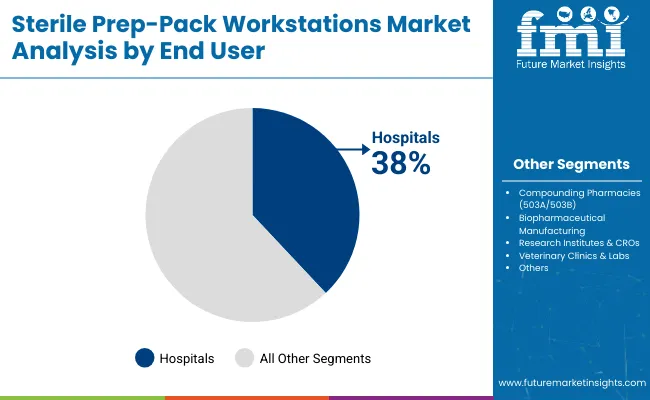
Hospitals are expected to remain the largest end user segment contributing around 38.0% in 2025 due to their need for streamlined, scalable, and regulation-compliant sterile processing units. Most of the surgical interventions and high-risk medical procedures are performed in hospital settings, necessitating advanced sterile packaging infrastructure. Demand has been reinforced by mandates for infection control and standardized reprocessing workflows.

Investments in hospital infrastructure modernization, especially in surgical departments and CSSDs (Central Sterile Supply Departments) have resulted in widespread adoption of high-efficiency, modular prep-pack workstations. Procurement has also been influenced by favorable health policy frameworks supporting capital equipment upgrades and operational efficiency in large tertiary and academic hospitals.

End User Market Share (%)
Hospitals 38.0%
Compounding Pharmacies (503A/503B) 26.0%
Biopharmaceutical Manufacturing 20.0%
Research Institutes & CROs 10.0%
Veterinary Clinics & Labs 6.0%

What are the Drivers, Restraints, and Key Trends of the Sterile Prep‑Pack Workstations?

Growing surgical volumes and increased audits are reinforcing demand. However, high capital costs, infrastructure dependencies, and retrofitting challenges hinder adoption, especially in budget-constrained or rural facilities. A key trend is the integration of these workstations into modular CSSD infrastructures, with vendors offering them as part of end-to-end sterile reprocessing solutions. Customizable designs for lean layouts and sterile zone separation are shaping procurement strategies in hospital modernization and sterile processing upgrades.

Regulatory Push for Sterile Workflow Standardization

The most significant growth driver in the Sterile Prep-Pack Workstations market is the tightening of regulatory compliance standards, particularly USP <797> and <800>, which mandate stringent environmental controls and ergonomic conditions for sterile compounding and reprocessing. Hospitals and ambulatory surgical centers are compelled to invest in cleanroom-compatible prep-pack tables with built-in HEPA filtration, stainless-steel surfaces and ergonomic adjustability.

Accreditation bodies such as The Joint Commission have intensified audits of sterile processing departments (SPDs), further encouraging adoption. As surgical case volumes increase, the need for repeatable, contamination-free instrument handling workflows is reinforcing procurement of advanced workstations.

High Capital Cost and Infrastructure Dependencies

Despite increasing awareness, the high capital expenditure associated with advanced sterile prep-pack systems, especially laminar flow-integrated or smart sensor-equipped units continues to be a major barrier. Facilities with limited budgets, particularly in mid-tier or rural healthcare settings, often delay upgrades due to infrastructure limitations, such as HVAC compatibility and cleanroom zoning. Retrofitting existing SPDs to meet new standards adds to implementation hurdles.

Convergence of Sterile Prep-Pack Workstations with Modular CSSD Infrastructure

An alternative but rapidly accelerating trend is the integration of sterile prep-pack workstations into modular Central Sterile Supply Department (CSSD) design frameworks. Rather than sourcing prep-pack tables as standalone units, large hospitals and health systems are now bundling them as part of comprehensive CSSD modernization projects.

Vendors like STERIS and Belimed are aligning their workstation offerings with end-to-end sterile reprocessing solutions, which include automated washers, pass-through sterilizers, and digital workflow software. This convergence is driving procurement decisions based on system-level interoperability, not just workstation features.

Additionally, modular CSSDs designed for lean layouts and zone separation require customizable prep-pack workstations. As new hospitals facilities undergo sterile zone retrofits, prep-pack workstations are being co-designed alongside HVAC, lighting, and sterile storage systems positioning them as strategic components within a broader sterile processing ecosystem.
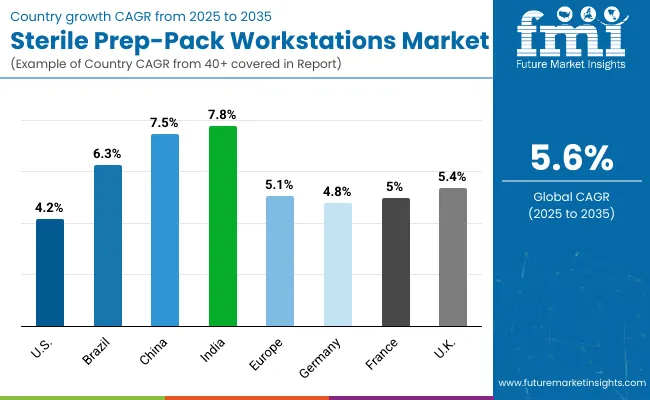
Analysis of Sterile Pre-Pack Workstation Market By Key Countries

Sterile Prep Pack Workstations Market Country Wise Analysis

Country CAGR
USA 4.2%
Brazil 6.3%
China 7.5%
India 7.8%
Europe 5.1%
Germany 4.8%
France 5.0%
UK. 5.4%

Asia Pacific is emerging as the fastest-growing region in the Sterile Prep-Pack Workstations market, projected to grow at a CAGR of 7.2% between 2025 and 2030. Among its key markets, India is forecast to expand at a CAGR of 7.8%, driven by the aggressive expansion of tertiary hospitals and increased adherence to NABH-accredited CSSD protocols.

Simultaneously, China is projected to grow at 7.5% CAGR, supported by large-scale investments in surgical infrastructure, rising procedural volumes, and public sector procurement of advanced sterilization technologies.

The region’s dominance stems from a surge in healthcare infrastructure development across Tier 1 and Tier 2 cities, as well as regulatory shifts emphasizing infection control post-COVID. Furthermore, government-funded hospital modernization programsespecially in India and Southeast Asiaare prioritizing compliant sterile processing departments (SPDs), where sterile prep-pack workstations are a core capital component.

Europe is expected to grow steadily at 5.1% CAGR through 2035. Germany is projected to grow at 4.8% CAGR, benefiting from automation initiatives in SPD layouts. France is estimated at 5.0% CAGR, backed by public hospital investments under the “Ségur de la santé” reform.

The UK. will see growth of 5.4% CAGR, largely driven by NHS modernization projects targeting surgical site infection (SSI) reduction. The European market is supported by harmonized infection control standards, continuous staff training programs, and a growing shift from manual to ergonomic and compliant sterile reprocessing stations.

North America remains a mature but innovation-led market, with the USA projected to grow at a CAGR of 4.2% between 2025 to 2035. Growth in the USA is driven by the replacement of legacy sterile workstations with smart, modular systems aligned with USP <800> compliance.

The rising demand for closed-loop sterilization documentation, coupled with increasing surgical volume in outpatient and ASC settings, is fueling adoption. Additionally, federal funding for hospital infrastructure upgrades and the focus on staff safety in sterile reprocessing environments are accelerating investment in prep-pack workstation modernization.

Sales Outlook for Sterile Prep-Pack Workstation in the United States

The sterile prep-pack workstation market in the USA is forecasted to grow at a 4.2% CAGR, primarily driven by increasing federal and state mandates for compliance with USP <797>/<800> regulations in sterile compounding and instrument reprocessing workflows.

Hospitals and ambulatory surgical centers (ASCs) are upgrading legacy prep stations with HEPA-filtered, laminar flow units equipped with digital traceability systems, enabling real-time logging and audit readiness. Demand is being further fueled by SPD capacity constraints and initiatives to optimize throughput and reduce hospital-acquired infections-a trend underscored in USA-specific data on sterilization service expansions.

  • Hospital sterile processing departments are upgrading to ergonomic, airflow-equipped prep tables to reduce cross-contamination and staff fatigue.
  • Sterile compounding pharmacies are adopting USP-compliant stations to meet particulate control requirements in chemotherapy and IV prep.
  • Ambulatory surgical centers (ASCs) are installing compact prep-pack units to support sterile workflows amid rising outpatient procedure volumes

Growth and Expansion Outlook for Sterile Prep-Pack Workstation Market in the United Kingdom

The Sterile Prep-Pack Workstation market in the United Kingdom is projected to grow at a CAGR of 5.4% through 2035, supported by NHS England’s ongoing investment in infection control and surgical infrastructure upgrades. The “New Hospital Programme” and increased funding under Health Infrastructure Plans (HIPs) are catalyzing the modernization of sterile reprocessing zones.

Adoption is also being driven by the rising volume of elective surgical procedures and pressure to reduce surgical site infections (SSIs). Trusts are prioritizing procurement of prep-pack tables that offer space optimization, built-in task lighting, and manual handling safety features. There is a clear shift toward modular sterile zones in new-build hospitals, where prep-pack units are designed into the CSSD blueprint from the outset.

  • NHS Trust hospitals are standardizing sterile workstations across multi-hospital systems for cost-efficient procurement.
  • Day surgery centers are investing in space-efficient prep-pack tables to meet same-day sterilization demands.
  • Clinical commissioning groups (CCGs) are influencing procurement with sustainability metrics favoring stainless-steel modular designs

In-depth Analysis of Sterile Prep-Pack Workstation in Germany

The Sterile Prep-Pack Workstation market in Germany is forecast to grow at a CAGR of 4.8%, led by increased automation in hospital sterile supply workflows. Under Germany’s Krankenhauszukunftsgesetz (Hospital Future Act), federal funding has been allocated for digital and physical upgrades, including CSSDs.

German hospitals are known for high procedural volume and stringent hygiene protocols, which are accelerating the transition from static stainless-steel tables to height-adjustable, laminar flow-integrated prep stations with real-time monitoring. Additionally, Germany’s labor laws emphasize ergonomic safety standards, prompting demand for prep stations with reduced physical strain on sterile processing staff.

  • University hospitals and large private chains are implementing fully digital sterile processing workflows integrated with IoT-enabled workstations.
  • Independent sterilization service providers are customizing prep-pack areas for industrial-scale reprocessing contracts.
  • Hospital engineering firms are bundling prep-pack units in CSSD retrofits aligned with DIN EN ISO 14644 cleanroom classification.

Europe Sterile Prep-Pack Workstation Market Value Analysis By Country

Europe Country 2025
Germany 22.50%
UK 18.20%
France 16.70%
Italy 10.40%
Spain 9.50%
Benelux 7.10%
Nordics 8.40%
Rest of Europe 7.20%
Europe Country 2035
Germany 20.70%
UK 19.10%
France 17.20%
Italy 9.10%
Spain 10.90%
Benelux 8.20%
Nordics 9.20%
Rest of Europe 5.60%

Market Expansion Outlook for Sterile Prep-Pack Workstation Market in India

The Sterile Prep-Pack Workstation market in India is expected to grow at a CAGR of 7.8%, making it one of the fastest-growing markets globally. Growth is fueled by massive expansion in tertiary hospitals, medical colleges, and private surgical centers across Tier 1 and Tier 2 cities. Rising incidence of hospital-acquired infections (HAIs), along with NABH accreditation standards, has led to increased adoption of sterile prep infrastructure in newly built hospitals.

Indian hospital groups are increasingly integrating modular CSSDs, with sterile prep-pack tables positioned as critical components. Additionally, local OEMs and international suppliers are offering cost-effective, customizable solutions suited for Indian layouts and budgets.

  • Private multi-specialty hospitals are installing airflow-controlled prep tables to meet quality and safety benchmarks.
  • Medical teaching hospitals are integrating modular prep-pack systems to train students under NABH-standard layouts.
  • Chain hospitals in Tier 2 cities are prioritizing compact, mobile prep units to scale sterile capacity with limited space.

Sales Outlook for Sterile Prep-Pack Workstation Market in China

The Sterile Prep-Pack Workstation market in China is projected to grow at a CAGR of 7.5% through 2035, supported by aggressive hospital infrastructure investments under the Healthy China 2030 policy. China's Ministry of Health has issued stricter regulations for surgical instrument sterilization, accelerating deployment of laminar airflow prep systems and digitally tracked sterile workspaces in Class A hospitals.

Urban hospitals are moving toward fully modular CSSDs, while district hospitals are adopting prep-pack stations that support high-throughput, multi-shift operations. Domestic medical equipment manufacturers are scaling production to meet surging demand and are increasingly integrating workflow management software into prep environments.

  • Tertiary hospitals in urban regions are adopting HEPA-filtered prep stations with built-in tray tracking for compliance audits.
  • County-level hospitals are investing in standalone ergonomic tables to standardize sterile workflows.
  • Joint venture hospitals are importing European and USA workstations as part of global hospital network alignment.

Growth Outlook of Sterile Prep-Pack Workstations Market in Japan

The Sterile Prep-Pack Workstations market in Japan is projected to reach USD 125.5 million in 2025, with Laminar Flow Workstations accounting for 22.0% of installations, reflecting Japan’s dual focus on precision and worker safety. The near-equal distribution stems from Japan’s high labor standards and compliance with JSHP (Japan Society of Healthcare Policy) sterilization protocols, where ergonomic efficiency is prioritized alongside airflow controls in hospital CSSDs.

Japan’s push for automation in hospital infrastructure, especially under aging workforce scenarios, is a major driver. The Ministry of Health, Labour and Welfare has also mandated infection control upgrades in long-term care hospitals and surgical centers, reinforcing demand for traceable, customizable prep-pack stations. Additionally, local manufacturers are enhancing domestic supply chains by offering integrated workstation modules for smart sterile zones.

  • Market in Japan holds 8.2% revenue share of the global market in 2025
  • Laminar Flow Workstations slightly dominates other equipment due to high installation rate.
  • Growth driven by infection control mandates and automation to offset labor shortages.

Opportunity Analysis of South Korea in Sterile Prep-Pack Workstations Market

The Sterile Prep-Pack Workstations market in South Korea is estimated at USD 57.3 million in 2025, with Sterile Drug Compounding accounting for the largest revenue share at 30.0%. This dominance is driven by government-enforced upgrades under MOHW (Ministry of Health and Welfare) mandates that require enhanced contamination control during sterile preparations in both public and private hospitals. Hospitals are investing in HEPA-filtered, ISO-classified prep zones to comply with standards outlined in the Korean Pharmacopoeia.

Chemotherapy Drug Preparation follows with 22.0%, supported by Korea’s nationwide cancer care programs and centralized oncology compounding centers. These facilities are deploying closed-system workstations to ensure operator safety during cytotoxic drug handling.

  • Market size for South Korea in 2025 is USD 57.3 million
  • South Korea holds 3.4% of the Global Market.
  • Sterile Drug Compounding leads to 30.0% due to strict aseptic compounding compliance.

Competition Landscape

The Sterile Prep-Pack Workstations market is moderately fragmented, with global leaders, established mid-sized firms, and emerging players competing across sterile reprocessing and pharmacy compounding applications. Industry leaders such as Getinge AB and STERIS plc hold substantial market share, driven by their end-to-end sterile processing ecosystems.

These companies are expanding through strategic acquisitions (e.g., Healthmark by Getinge, and surgical container systems by STERIS) and offer bundled solutions that integrate prep-pack workstations with T-DOC traceability software, HEPA-filtered airflow controls, and modular CSSD infrastructure. Their strategies increasingly focus on infection control compliance, ergonomic safety, and full-suite integration with sterilization and reprocessing workflows.

Established mid-sized manufacturers like Belimed Inc. (Steelco S.p.A), Skytron LLC, and MAC Medical Inc. cater to facilities seeking scalable and modular workstation setups. These players are innovating through digital planning tools, ergonomic customization, and enhanced storage solutions, making them highly relevant for hospitals undergoing phased sterile department upgrades.

Emerging players such as Pure Processing LLC, Coulmed Products, BOSTONtec, and Reos Medical focus on niche applications like outpatient centers, compact CSSDs, and education-focused sterile setups. Their strength lies in product customization, competitive pricing, and value-added services such as technician training, workflow optimization, and mobile configurations.

As the market matures, competitive differentiation is shifting from basic stainless-steel fabrication toward modular connectivity, IoT-enabled workflow tracking, and integration with sterilization analytics platforms.

Key Developments:

  • In 2024, RAD Technology Medical Systems and Belimed Announce Completion of the FlexSPD Portable Sterile Processing Department Solution.
  • In 2024, Adaptaid was pleased to take part in the AQRDM Congress held at the Saint-Hyacinthe Convention Center which supported best practices in reprocessing as well as showcasing their Prep and Pack Workstations.

Scope of the Report

Item Value
Quantitative Units USD 1533.1 million
Product type Laminar Flow Workstations, Compounding Aseptic Isolators (CAIs), Biological Safety Cabinets (BSCs), Automated Sterile Prep-Pack Stations, Modular Cleanroom Workstations
Application Hospital Sterile Compounding , Pharmaceutical Manufacturing, Clinical Trial Packaging, Biotech & Research Aseptic Use, Veterinary and Specialty Use and Others
End User Hospitals, Compounding Pharmacies (503A/503B), Biopharmaceutical Manufacturing, Research Institutes & CROs and Veterinary Clinics & Labs
Regions Covered North America, Latin America, Western & Eastern Europe, East Asia, South Asia & Pacific, Middle East & Africa
Countries Covered USA, Brazil, China, India, Germany, France, UK. etc.
Key Companies Profiled Getinge AB, STERIS, Skytron , LLC, MAC MEDICAL INC, Coulmed Products, Belimed INC. (Steelco S.p.A), Pure Processing LLC, BOSTONtec and Reos Medical
Additional Attributes Dollar sales by application and regions, adoption trends of Automated Sterile Prep-Pack Stations, Rising demand in Biotech & Research Aseptic Use, Growing demand across Compounding Pharmacies and Biopharmaceutical Manufacturing

Key Segments

By Product:

  • Laminar Flow Workstations
  • Compounding Aseptic Isolators (CAIs)
  • Biological Safety Cabinets (BSCs)
  • Automated Sterile Prep-Pack Stations
  • Modular Cleanroom Workstations

By Application:

  • Hospital Sterile Compounding
  • Pharmaceutical Manufacturing
  • Clinical Trial Packaging
  • Biotech & Research Aseptic Use
  • Veterinary and Specialty Use

By End User:

  • Hospitals
  • Compounding Pharmacies (503A/503B)
  • Biopharmaceutical Manufacturing
  • Research Institutes & CROs
  • Veterinary Clinics & Labs

By Region:

  • North America
  • Latin America
  • Western Europe
  • Eastern Europe
  • East Asia
  • South Asia & Pacific
  • Middle East & Africa

Table of Content

  1. Executive Summary
    • Global Market Outlook
    • Demand-side Trends
    • Supply-side Trends
    • Technology Roadmap Analysis
    • Analysis and Recommendations
  2. Market Overview
    • Market Coverage / Taxonomy
    • Market Definition / Scope / Limitations
  3. Market Background
    • Market Dynamics
      • Drivers
      • Restraints
      • Opportunity
      • Trends
    • Scenario Forecast
      • Demand in Optimistic Scenario
      • Demand in Likely Scenario
      • Demand in Conservative Scenario
    • Installed Base Scenario
    • Regulatory Landscape
    • Technology Assessment
    • PESTLE and Porter’s Analysis
  4. Global Market Analysis 2020 to 2024 and Forecast, 2025 to 2035
    • Historical Market Size Value (USD Million) & Volume (Units) Analysis, 2020 to 2024
    • Current and Future Market Size Value (USD Million) & Volume (Units) Projections, 2025 to 2035
      • Y-o-Y Growth Trend Analysis
      • Absolute $ Opportunity Analysis
  5. Global Market Analysis 2020 to 2024 and Forecast 2025 to 2035, By Product
    • Introduction / Key Findings
    • Historical Market Size Value (USD Million) & Volume (Units) Analysis By Product, 2020 to 2024
    • Current and Future Market Size Value (USD Million) & Volume (Units) Analysis and Forecast By Product, 2025 to 2035
      • Laminar Flow Workstations
      • Compounding Aseptic Isolators (CAIs)
      • Biological Safety Cabinets (BSCs)
      • Automated Sterile Prep-Pack Stations
      • Modular Cleanroom Workstations
    • Y-o-Y Growth Trend Analysis By Product, 2020 to 2024
    • Absolute $ Opportunity Analysis By Product, 2025 to 2035
  6. Global Market Analysis 2020 to 2024 and Forecast 2025 to 2035, By Application
    • Introduction / Key Findings
    • Historical Market Size Value (USD Million) & Volume (Units) Analysis By Application, 2020 to 2024
    • Current and Future Market Size Value (USD Million) & Volume (Units) Analysis and Forecast By Application, 2025 to 2035
      • Hospital Sterile Compounding
      • Pharmaceutical Manufacturing
      • Clinical Trial Packaging
      • Biotech & Research Aseptic Use
      • Veterinary and Specialty Use
    • Y-o-Y Growth Trend Analysis By Application, 2020 to 2024
    • Absolute $ Opportunity Analysis By Application, 2025 to 2035
  7. Global Market Analysis 2020 to 2024 and Forecast 2025 to 2035, By End User
    • Introduction / Key Findings
    • Historical Market Size Value (USD Million) & Volume (Units) Analysis By End User, 2020 to 2024
    • Current and Future Market Size Value (USD Million) & Volume (Units) Analysis and Forecast By End User, 2025 to 2035
      • Hospitals
      • Compounding Pharmacies (503A/503B)
      • Biopharmaceutical Manufacturing
      • Research Institutes & CROs
      • Veterinary Clinics & Labs
    • Y-o-Y Growth Trend Analysis By End User, 2020 to 2024
    • Absolute $ Opportunity Analysis By End User, 2025 to 2035
  8. Global Market Analysis 2020 to 2024 and Forecast 2025 to 2035, By Region
    • Introduction
    • Historical Market Size Value (USD Million) & Volume (Units) Analysis By Region, 2020 to 2024
    • Current Market Size Value (USD Million) & Volume (Units) Analysis and Forecast By Region, 2025 to 2035
      • North America
      • Latin America
      • Western Europe
      • Eastern Europe
      • East Asia
      • South Asia & Pacific
      • Middle East & Africa
    • Market Attractiveness Analysis By Region
  9. North America Market Analysis 2020 to 2024 and Forecast 2025 to 2035, By Country
    • Historical Market Size Value (USD Million) & Volume (Units) Trend Analysis By Market Taxonomy, 2020 to 2024
    • Market Size Value (USD Million) & Volume (Units) Forecast By Market Taxonomy, 2025 to 2035
      • By Country
        • USA
        • Canada
        • Mexico
      • By Product
      • By Application
      • By End User
    • Market Attractiveness Analysis
      • By Country
      • By Product
      • By Application
      • By End User
    • Key Takeaways
  10. Latin America Market Analysis 2020 to 2024 and Forecast 2025 to 2035, By Country
    • Historical Market Size Value (USD Million) & Volume (Units) Trend Analysis By Market Taxonomy, 2020 to 2024
    • Market Size Value (USD Million) & Volume (Units) Forecast By Market Taxonomy, 2025 to 2035
      • By Country
        • Brazil
        • Argentina
        • Rest of Latin America
      • By Product
      • By Application
      • By End User
    • Market Attractiveness Analysis
      • By Country
      • By Product
      • By Application
      • By End User
    • Key Takeaways
  11. Western Europe Market Analysis 2020 to 2024 and Forecast 2025 to 2035, By Country
    • Historical Market Size Value (USD Million) & Volume (Units) Trend Analysis By Market Taxonomy, 2020 to 2024
    • Market Size Value (USD Million) & Volume (Units) Forecast By Market Taxonomy, 2025 to 2035
      • By Country
        • Germany
        • Italy
        • France
        • UK
        • Spain
        • Nordic Countries
        • BENELUX
        • Rest of Western Europe
      • By Product
      • By Application
      • By End User
    • Market Attractiveness Analysis
      • By Country
      • By Product
      • By Application
      • By End User
    • Key Takeaways
  12. Eastern Europe Market Analysis 2020 to 2024 and Forecast 2025 to 2035, By Country
    • Historical Market Size Value (USD Million) & Volume (Units) Trend Analysis By Market Taxonomy, 2020 to 2024
    • Market Size Value (USD Million) & Volume (Units) Forecast By Market Taxonomy, 2025 to 2035
      • By Country
        • Russia
        • Poland
        • Rest of Eastern Europe
      • By Product
      • By Application
      • By End User
    • Market Attractiveness Analysis
      • By Country
      • By Product
      • By Application
      • By End User
    • Key Takeaways
  13. East Asia Market Analysis 2020 to 2024 and Forecast 2025 to 2035, By Country
    • Historical Market Size Value (USD Million) & Volume (Units) Trend Analysis By Market Taxonomy, 2020 to 2024
    • Market Size Value (USD Million) & Volume (Units) Forecast By Market Taxonomy, 2025 to 2035
      • By Country
        • China
        • Japan
        • South Korea
      • By Product
      • By Application
      • By End User
    • Market Attractiveness Analysis
      • By Country
      • By Product
      • By Application
      • By End User
    • Key Takeaways
  14. South Asia & Pacific Market Analysis 2020 to 2024 and Forecast 2025 to 2035, By Country
    • Historical Market Size Value (USD Million) & Volume (Units) Trend Analysis By Market Taxonomy, 2020 to 2024
    • Market Size Value (USD Million) & Volume (Units) Forecast By Market Taxonomy, 2025 to 2035
      • By Country
        • India
        • Australia & New Zealand
        • ASEAN Countries
        • Rest of South Asia & Pacific
      • By Product
      • By Application
      • By End User
    • Market Attractiveness Analysis
      • By Country
      • By Product
      • By Application
      • By End User
    • Key Takeaways
  15. Middle East & Africa Market Analysis 2020 to 2024 and Forecast 2025 to 2035, By Country
    • Historical Market Size Value (USD Million) & Volume (Units) Trend Analysis By Market Taxonomy, 2020 to 2024
    • Market Size Value (USD Million) & Volume (Units) Forecast By Market Taxonomy, 2025 to 2035
      • By Country
        • Saudi Arabia
        • Rest of GCC Countries
        • South Africa
        • Rest of African union
      • By Product
      • By Application
      • By End User
    • Market Attractiveness Analysis
      • By Country
      • By Product
      • By Application
      • By End User
    • Key Takeaways
  16. Key Countries Market Analysis
    • USA
      • Pricing Analysis
      • Market Share Analysis, 2024
        • By Product
        • By Application
        • By End User
    • Canada
      • Pricing Analysis
      • Market Share Analysis, 2024
        • By Product
        • By Application
        • By End User
    • Mexico
      • Pricing Analysis
      • Market Share Analysis, 2024
        • By Product
        • By Application
        • By End User
    • Brazil
      • Pricing Analysis
      • Market Share Analysis, 2024
        • By Product
        • By Application
        • By End User
    • Argentina
      • Pricing Analysis
      • Market Share Analysis, 2024
        • By Product
        • By Application
        • By End User
    • Rest of Latin America
      • Pricing Analysis
      • Market Share Analysis, 2024
        • By Product
        • By Application
        • By End User
    • Germany
      • Pricing Analysis
      • Market Share Analysis, 2024
        • By Product
        • By Application
        • By End User
    • Italy
      • Pricing Analysis
      • Market Share Analysis, 2024
        • By Product
        • By Application
        • By End User
    • France
      • Pricing Analysis
      • Market Share Analysis, 2024
        • By Product
        • By Application
        • By End User
    • UK
      • Pricing Analysis
      • Market Share Analysis, 2024
        • By Product
        • By Application
        • By End User
    • Spain
      • Pricing Analysis
      • Market Share Analysis, 2024
        • By Product
        • By Application
        • By End User
    • Nordic Countries
      • Pricing Analysis
      • Market Share Analysis, 2024
        • By Product
        • By Application
        • By End User
    • BENELUX
      • Pricing Analysis
      • Market Share Analysis, 2024
        • By Product
        • By Application
        • By End User
    • Rest of Western Europe
      • Pricing Analysis
      • Market Share Analysis, 2024
        • By Product
        • By Application
        • By End User
    • Russia
      • Pricing Analysis
      • Market Share Analysis, 2024
        • By Product
        • By Application
        • By End User
    • Poland
      • Pricing Analysis
      • Market Share Analysis, 2024
        • By Product
        • By Application
        • By End User
    • Rest of Eastern Europe
      • Pricing Analysis
      • Market Share Analysis, 2024
        • By Product
        • By Application
        • By End User
    • China
      • Pricing Analysis
      • Market Share Analysis, 2024
        • By Product
        • By Application
        • By End User
    • Japan
      • Pricing Analysis
      • Market Share Analysis, 2024
        • By Product
        • By Application
        • By End User
    • South Korea
      • Pricing Analysis
      • Market Share Analysis, 2024
        • By Product
        • By Application
        • By End User
    • India
      • Pricing Analysis
      • Market Share Analysis, 2024
        • By Product
        • By Application
        • By End User
    • Australia & New Zealand
      • Pricing Analysis
      • Market Share Analysis, 2024
        • By Product
        • By Application
        • By End User
    • ASEAN Countries
      • Pricing Analysis
      • Market Share Analysis, 2024
        • By Product
        • By Application
        • By End User
    • Rest of South Asia & Pacific
      • Pricing Analysis
      • Market Share Analysis, 2024
        • By Product
        • By Application
        • By End User
    • Saudi Arabia
      • Pricing Analysis
      • Market Share Analysis, 2024
        • By Product
        • By Application
        • By End User
    • Rest of GCC Countries
      • Pricing Analysis
      • Market Share Analysis, 2024
        • By Product
        • By Application
        • By End User
    • South Africa
      • Pricing Analysis
      • Market Share Analysis, 2024
        • By Product
        • By Application
        • By End User
    • Rest of African union
      • Pricing Analysis
      • Market Share Analysis, 2024
        • By Product
        • By Application
        • By End User
  17. Market Structure Analysis
    • Competition Dashboard
    • Competition Benchmarking
    • Market Share Analysis of Top Players
      • By Regional
      • By Product
      • By Application
      • By End User
  18. Competition Analysis
    • Competition Deep Dive
      • Getinge AB
        • Overview
        • Product Portfolio
        • Profitability by Market Segments (Product/Age /Sales Channel/Region)
        • Sales Footprint
        • Strategy Overview
          • Marketing Strategy
          • Product Strategy
          • Channel Strategy
      • STERIS
        • Overview
        • Product Portfolio
        • Profitability by Market Segments (Product/Age /Sales Channel/Region)
        • Sales Footprint
        • Strategy Overview
          • Marketing Strategy
          • Product Strategy
          • Channel Strategy
      • Skytron, LLC
        • Overview
        • Product Portfolio
        • Profitability by Market Segments (Product/Age /Sales Channel/Region)
        • Sales Footprint
        • Strategy Overview
          • Marketing Strategy
          • Product Strategy
          • Channel Strategy
      • MAC MEDICAL INC
        • Overview
        • Product Portfolio
        • Profitability by Market Segments (Product/Age /Sales Channel/Region)
        • Sales Footprint
        • Strategy Overview
          • Marketing Strategy
          • Product Strategy
          • Channel Strategy
      • Coulmed Products
        • Overview
        • Product Portfolio
        • Profitability by Market Segments (Product/Age /Sales Channel/Region)
        • Sales Footprint
        • Strategy Overview
          • Marketing Strategy
          • Product Strategy
          • Channel Strategy
      • Belimed INC. (Steelco S.p.A)
        • Overview
        • Product Portfolio
        • Profitability by Market Segments (Product/Age /Sales Channel/Region)
        • Sales Footprint
        • Strategy Overview
          • Marketing Strategy
          • Product Strategy
          • Channel Strategy
      • Pure Processing LLC
        • Overview
        • Product Portfolio
        • Profitability by Market Segments (Product/Age /Sales Channel/Region)
        • Sales Footprint
        • Strategy Overview
          • Marketing Strategy
          • Product Strategy
          • Channel Strategy
      • BOSTONtec
        • Overview
        • Product Portfolio
        • Profitability by Market Segments (Product/Age /Sales Channel/Region)
        • Sales Footprint
        • Strategy Overview
          • Marketing Strategy
          • Product Strategy
          • Channel Strategy
      • Reos Medical
        • Overview
        • Product Portfolio
        • Profitability by Market Segments (Product/Age /Sales Channel/Region)
        • Sales Footprint
        • Strategy Overview
          • Marketing Strategy
          • Product Strategy
          • Channel Strategy
      • Adaptaid Inc.
        • Overview
        • Product Portfolio
        • Profitability by Market Segments (Product/Age /Sales Channel/Region)
        • Sales Footprint
        • Strategy Overview
          • Marketing Strategy
          • Product Strategy
          • Channel Strategy
  19. Assumptions & Acronyms Used
  20. Research Methodology

List of Tables

  • Table 1: Global Market Value (USD Million) Forecast by Region, 2020-2035
  • Table 2: Global Market Volume (Units) Forecast by Region, 2020-2035
  • Table 3: Global Market Value (USD Million) Forecast by Product, 2020-2035
  • Table 4: Global Market Volume (Units) Forecast by Product, 2020-2035
  • Table 5: Global Market Value (USD Million) Forecast by Application, 2020-2035
  • Table 6: Global Market Volume (Units) Forecast by Application, 2020-2035
  • Table 7: Global Market Value (USD Million) Forecast by End User, 2020-2035
  • Table 8: Global Market Volume (Units) Forecast by End User, 2020-2035
  • Table 9: North America Market Value (USD Million) Forecast by Country, 2020-2035
  • Table 10: North America Market Volume (Units) Forecast by Country, 2020-2035
  • Table 11: North America Market Value (USD Million) Forecast by Product, 2020-2035
  • Table 12: North America Market Volume (Units) Forecast by Product, 2020-2035
  • Table 13: North America Market Value (USD Million) Forecast by Application, 2020-2035
  • Table 14: North America Market Volume (Units) Forecast by Application, 2020-2035
  • Table 15: North America Market Value (USD Million) Forecast by End User, 2020-2035
  • Table 16: North America Market Volume (Units) Forecast by End User, 2020-2035
  • Table 17: Latin America Market Value (USD Million) Forecast by Country, 2020-2035
  • Table 18: Latin America Market Volume (Units) Forecast by Country, 2020-2035
  • Table 19: Latin America Market Value (USD Million) Forecast by Product, 2020-2035
  • Table 20: Latin America Market Volume (Units) Forecast by Product, 2020-2035
  • Table 21: Latin America Market Value (USD Million) Forecast by Application, 2020-2035
  • Table 22: Latin America Market Volume (Units) Forecast by Application, 2020-2035
  • Table 23: Latin America Market Value (USD Million) Forecast by End User, 2020-2035
  • Table 24: Latin America Market Volume (Units) Forecast by End User, 2020-2035
  • Table 25: Western Europe Market Value (USD Million) Forecast by Country, 2020-2035
  • Table 26: Western Europe Market Volume (Units) Forecast by Country, 2020-2035
  • Table 27: Western Europe Market Value (USD Million) Forecast by Product, 2020-2035
  • Table 28: Western Europe Market Volume (Units) Forecast by Product, 2020-2035
  • Table 29: Western Europe Market Value (USD Million) Forecast by Application, 2020-2035
  • Table 30: Western Europe Market Volume (Units) Forecast by Application, 2020-2035
  • Table 31: Western Europe Market Value (USD Million) Forecast by End User, 2020-2035
  • Table 32: Western Europe Market Volume (Units) Forecast by End User, 2020-2035
  • Table 33: Eastern Europe Market Value (USD Million) Forecast by Country, 2020-2035
  • Table 34: Eastern Europe Market Volume (Units) Forecast by Country, 2020-2035
  • Table 35: Eastern Europe Market Value (USD Million) Forecast by Product, 2020-2035
  • Table 36: Eastern Europe Market Volume (Units) Forecast by Product, 2020-2035
  • Table 37: Eastern Europe Market Value (USD Million) Forecast by Application, 2020-2035
  • Table 38: Eastern Europe Market Volume (Units) Forecast by Application, 2020-2035
  • Table 39: Eastern Europe Market Value (USD Million) Forecast by End User, 2020-2035
  • Table 40: Eastern Europe Market Volume (Units) Forecast by End User, 2020-2035
  • Table 41: East Asia Market Value (USD Million) Forecast by Country, 2020-2035
  • Table 42: East Asia Market Volume (Units) Forecast by Country, 2020-2035
  • Table 43: East Asia Market Value (USD Million) Forecast by Product, 2020-2035
  • Table 44: East Asia Market Volume (Units) Forecast by Product, 2020-2035
  • Table 45: East Asia Market Value (USD Million) Forecast by Application, 2020-2035
  • Table 46: East Asia Market Volume (Units) Forecast by Application, 2020-2035
  • Table 47: East Asia Market Value (USD Million) Forecast by End User, 2020-2035
  • Table 48: East Asia Market Volume (Units) Forecast by End User, 2020-2035
  • Table 49: South Asia & Pacific Market Value (USD Million) Forecast by Country, 2020-2035
  • Table 50: South Asia & Pacific Market Volume (Units) Forecast by Country, 2020-2035
  • Table 51: South Asia & Pacific Market Value (USD Million) Forecast by Product, 2020-2035
  • Table 52: South Asia & Pacific Market Volume (Units) Forecast by Product, 2020-2035
  • Table 53: South Asia & Pacific Market Value (USD Million) Forecast by Application, 2020-2035
  • Table 54: South Asia & Pacific Market Volume (Units) Forecast by Application, 2020-2035
  • Table 55: South Asia & Pacific Market Value (USD Million) Forecast by End User, 2020-2035
  • Table 56: South Asia & Pacific Market Volume (Units) Forecast by End User, 2020-2035
  • Table 57: Middle East & Africa Market Value (USD Million) Forecast by Country, 2020-2035
  • Table 58: Middle East & Africa Market Volume (Units) Forecast by Country, 2020-2035
  • Table 59: Middle East & Africa Market Value (USD Million) Forecast by Product, 2020-2035
  • Table 60: Middle East & Africa Market Volume (Units) Forecast by Product, 2020-2035
  • Table 61: Middle East & Africa Market Value (USD Million) Forecast by Application, 2020-2035
  • Table 62: Middle East & Africa Market Volume (Units) Forecast by Application, 2020-2035
  • Table 63: Middle East & Africa Market Value (USD Million) Forecast by End User, 2020-2035
  • Table 64: Middle East & Africa Market Volume (Units) Forecast by End User, 2020-2035

List of Figures

  • Figure 1: Global Market Value (USD Million) by Product, 2025-2035
  • Figure 2: Global Market Value (USD Million) by Application, 2025-2035
  • Figure 3: Global Market Value (USD Million) by End User, 2025-2035
  • Figure 4: Global Market Value (USD Million) by Region, 2025-2035
  • Figure 5: Global Market Value (USD Million) Analysis by Region, 2020-2035
  • Figure 6: Global Market Volume (Units) Analysis by Region, 2020-2035
  • Figure 7: Global Market Value Share (%) and BPS Analysis by Region, 2025-2035
  • Figure 8: Global Market Y-o-Y Growth (%) Projections by Region, 2025-2035
  • Figure 9: Global Market Value (USD Million) Analysis by Product, 2020-2035
  • Figure 10: Global Market Volume (Units) Analysis by Product, 2020-2035
  • Figure 11: Global Market Value Share (%) and BPS Analysis by Product, 2025-2035
  • Figure 12: Global Market Y-o-Y Growth (%) Projections by Product, 2025-2035
  • Figure 13: Global Market Value (USD Million) Analysis by Application, 2020-2035
  • Figure 14: Global Market Volume (Units) Analysis by Application, 2020-2035
  • Figure 15: Global Market Value Share (%) and BPS Analysis by Application, 2025-2035
  • Figure 16: Global Market Y-o-Y Growth (%) Projections by Application, 2025-2035
  • Figure 17: Global Market Value (USD Million) Analysis by End User, 2020-2035
  • Figure 18: Global Market Volume (Units) Analysis by End User, 2020-2035
  • Figure 19: Global Market Value Share (%) and BPS Analysis by End User, 2025-2035
  • Figure 20: Global Market Y-o-Y Growth (%) Projections by End User, 2025-2035
  • Figure 21: Global Market Attractiveness by Product, 2025-2035
  • Figure 22: Global Market Attractiveness by Application, 2025-2035
  • Figure 23: Global Market Attractiveness by End User, 2025-2035
  • Figure 24: Global Market Attractiveness by Region, 2025-2035
  • Figure 25: North America Market Value (USD Million) by Product, 2025-2035
  • Figure 26: North America Market Value (USD Million) by Application, 2025-2035
  • Figure 27: North America Market Value (USD Million) by End User, 2025-2035
  • Figure 28: North America Market Value (USD Million) by Country, 2025-2035
  • Figure 29: North America Market Value (USD Million) Analysis by Country, 2020-2035
  • Figure 30: North America Market Volume (Units) Analysis by Country, 2020-2035
  • Figure 31: North America Market Value Share (%) and BPS Analysis by Country, 2025-2035
  • Figure 32: North America Market Y-o-Y Growth (%) Projections by Country, 2025-2035
  • Figure 33: North America Market Value (USD Million) Analysis by Product, 2020-2035
  • Figure 34: North America Market Volume (Units) Analysis by Product, 2020-2035
  • Figure 35: North America Market Value Share (%) and BPS Analysis by Product, 2025-2035
  • Figure 36: North America Market Y-o-Y Growth (%) Projections by Product, 2025-2035
  • Figure 37: North America Market Value (USD Million) Analysis by Application, 2020-2035
  • Figure 38: North America Market Volume (Units) Analysis by Application, 2020-2035
  • Figure 39: North America Market Value Share (%) and BPS Analysis by Application, 2025-2035
  • Figure 40: North America Market Y-o-Y Growth (%) Projections by Application, 2025-2035
  • Figure 41: North America Market Value (USD Million) Analysis by End User, 2020-2035
  • Figure 42: North America Market Volume (Units) Analysis by End User, 2020-2035
  • Figure 43: North America Market Value Share (%) and BPS Analysis by End User, 2025-2035
  • Figure 44: North America Market Y-o-Y Growth (%) Projections by End User, 2025-2035
  • Figure 45: North America Market Attractiveness by Product, 2025-2035
  • Figure 46: North America Market Attractiveness by Application, 2025-2035
  • Figure 47: North America Market Attractiveness by End User, 2025-2035
  • Figure 48: North America Market Attractiveness by Country, 2025-2035
  • Figure 49: Latin America Market Value (USD Million) by Product, 2025-2035
  • Figure 50: Latin America Market Value (USD Million) by Application, 2025-2035
  • Figure 51: Latin America Market Value (USD Million) by End User, 2025-2035
  • Figure 52: Latin America Market Value (USD Million) by Country, 2025-2035
  • Figure 53: Latin America Market Value (USD Million) Analysis by Country, 2020-2035
  • Figure 54: Latin America Market Volume (Units) Analysis by Country, 2020-2035
  • Figure 55: Latin America Market Value Share (%) and BPS Analysis by Country, 2025-2035
  • Figure 56: Latin America Market Y-o-Y Growth (%) Projections by Country, 2025-2035
  • Figure 57: Latin America Market Value (USD Million) Analysis by Product, 2020-2035
  • Figure 58: Latin America Market Volume (Units) Analysis by Product, 2020-2035
  • Figure 59: Latin America Market Value Share (%) and BPS Analysis by Product, 2025-2035
  • Figure 60: Latin America Market Y-o-Y Growth (%) Projections by Product, 2025-2035
  • Figure 61: Latin America Market Value (USD Million) Analysis by Application, 2020-2035
  • Figure 62: Latin America Market Volume (Units) Analysis by Application, 2020-2035
  • Figure 63: Latin America Market Value Share (%) and BPS Analysis by Application, 2025-2035
  • Figure 64: Latin America Market Y-o-Y Growth (%) Projections by Application, 2025-2035
  • Figure 65: Latin America Market Value (USD Million) Analysis by End User, 2020-2035
  • Figure 66: Latin America Market Volume (Units) Analysis by End User, 2020-2035
  • Figure 67: Latin America Market Value Share (%) and BPS Analysis by End User, 2025-2035
  • Figure 68: Latin America Market Y-o-Y Growth (%) Projections by End User, 2025-2035
  • Figure 69: Latin America Market Attractiveness by Product, 2025-2035
  • Figure 70: Latin America Market Attractiveness by Application, 2025-2035
  • Figure 71: Latin America Market Attractiveness by End User, 2025-2035
  • Figure 72: Latin America Market Attractiveness by Country, 2025-2035
  • Figure 73: Western Europe Market Value (USD Million) by Product, 2025-2035
  • Figure 74: Western Europe Market Value (USD Million) by Application, 2025-2035
  • Figure 75: Western Europe Market Value (USD Million) by End User, 2025-2035
  • Figure 76: Western Europe Market Value (USD Million) by Country, 2025-2035
  • Figure 77: Western Europe Market Value (USD Million) Analysis by Country, 2020-2035
  • Figure 78: Western Europe Market Volume (Units) Analysis by Country, 2020-2035
  • Figure 79: Western Europe Market Value Share (%) and BPS Analysis by Country, 2025-2035
  • Figure 80: Western Europe Market Y-o-Y Growth (%) Projections by Country, 2025-2035
  • Figure 81: Western Europe Market Value (USD Million) Analysis by Product, 2020-2035
  • Figure 82: Western Europe Market Volume (Units) Analysis by Product, 2020-2035
  • Figure 83: Western Europe Market Value Share (%) and BPS Analysis by Product, 2025-2035
  • Figure 84: Western Europe Market Y-o-Y Growth (%) Projections by Product, 2025-2035
  • Figure 85: Western Europe Market Value (USD Million) Analysis by Application, 2020-2035
  • Figure 86: Western Europe Market Volume (Units) Analysis by Application, 2020-2035
  • Figure 87: Western Europe Market Value Share (%) and BPS Analysis by Application, 2025-2035
  • Figure 88: Western Europe Market Y-o-Y Growth (%) Projections by Application, 2025-2035
  • Figure 89: Western Europe Market Value (USD Million) Analysis by End User, 2020-2035
  • Figure 90: Western Europe Market Volume (Units) Analysis by End User, 2020-2035
  • Figure 91: Western Europe Market Value Share (%) and BPS Analysis by End User, 2025-2035
  • Figure 92: Western Europe Market Y-o-Y Growth (%) Projections by End User, 2025-2035
  • Figure 93: Western Europe Market Attractiveness by Product, 2025-2035
  • Figure 94: Western Europe Market Attractiveness by Application, 2025-2035
  • Figure 95: Western Europe Market Attractiveness by End User, 2025-2035
  • Figure 96: Western Europe Market Attractiveness by Country, 2025-2035
  • Figure 97: Eastern Europe Market Value (USD Million) by Product, 2025-2035
  • Figure 98: Eastern Europe Market Value (USD Million) by Application, 2025-2035
  • Figure 99: Eastern Europe Market Value (USD Million) by End User, 2025-2035
  • Figure 100: Eastern Europe Market Value (USD Million) by Country, 2025-2035
  • Figure 101: Eastern Europe Market Value (USD Million) Analysis by Country, 2020-2035
  • Figure 102: Eastern Europe Market Volume (Units) Analysis by Country, 2020-2035
  • Figure 103: Eastern Europe Market Value Share (%) and BPS Analysis by Country, 2025-2035
  • Figure 104: Eastern Europe Market Y-o-Y Growth (%) Projections by Country, 2025-2035
  • Figure 105: Eastern Europe Market Value (USD Million) Analysis by Product, 2020-2035
  • Figure 106: Eastern Europe Market Volume (Units) Analysis by Product, 2020-2035
  • Figure 107: Eastern Europe Market Value Share (%) and BPS Analysis by Product, 2025-2035
  • Figure 108: Eastern Europe Market Y-o-Y Growth (%) Projections by Product, 2025-2035
  • Figure 109: Eastern Europe Market Value (USD Million) Analysis by Application, 2020-2035
  • Figure 110: Eastern Europe Market Volume (Units) Analysis by Application, 2020-2035
  • Figure 111: Eastern Europe Market Value Share (%) and BPS Analysis by Application, 2025-2035
  • Figure 112: Eastern Europe Market Y-o-Y Growth (%) Projections by Application, 2025-2035
  • Figure 113: Eastern Europe Market Value (USD Million) Analysis by End User, 2020-2035
  • Figure 114: Eastern Europe Market Volume (Units) Analysis by End User, 2020-2035
  • Figure 115: Eastern Europe Market Value Share (%) and BPS Analysis by End User, 2025-2035
  • Figure 116: Eastern Europe Market Y-o-Y Growth (%) Projections by End User, 2025-2035
  • Figure 117: Eastern Europe Market Attractiveness by Product, 2025-2035
  • Figure 118: Eastern Europe Market Attractiveness by Application, 2025-2035
  • Figure 119: Eastern Europe Market Attractiveness by End User, 2025-2035
  • Figure 120: Eastern Europe Market Attractiveness by Country, 2025-2035
  • Figure 121: East Asia Market Value (USD Million) by Product, 2025-2035
  • Figure 122: East Asia Market Value (USD Million) by Application, 2025-2035
  • Figure 123: East Asia Market Value (USD Million) by End User, 2025-2035
  • Figure 124: East Asia Market Value (USD Million) by Country, 2025-2035
  • Figure 125: East Asia Market Value (USD Million) Analysis by Country, 2020-2035
  • Figure 126: East Asia Market Volume (Units) Analysis by Country, 2020-2035
  • Figure 127: East Asia Market Value Share (%) and BPS Analysis by Country, 2025-2035
  • Figure 128: East Asia Market Y-o-Y Growth (%) Projections by Country, 2025-2035
  • Figure 129: East Asia Market Value (USD Million) Analysis by Product, 2020-2035
  • Figure 130: East Asia Market Volume (Units) Analysis by Product, 2020-2035
  • Figure 131: East Asia Market Value Share (%) and BPS Analysis by Product, 2025-2035
  • Figure 132: East Asia Market Y-o-Y Growth (%) Projections by Product, 2025-2035
  • Figure 133: East Asia Market Value (USD Million) Analysis by Application, 2020-2035
  • Figure 134: East Asia Market Volume (Units) Analysis by Application, 2020-2035
  • Figure 135: East Asia Market Value Share (%) and BPS Analysis by Application, 2025-2035
  • Figure 136: East Asia Market Y-o-Y Growth (%) Projections by Application, 2025-2035
  • Figure 137: East Asia Market Value (USD Million) Analysis by End User, 2020-2035
  • Figure 138: East Asia Market Volume (Units) Analysis by End User, 2020-2035
  • Figure 139: East Asia Market Value Share (%) and BPS Analysis by End User, 2025-2035
  • Figure 140: East Asia Market Y-o-Y Growth (%) Projections by End User, 2025-2035
  • Figure 141: East Asia Market Attractiveness by Product, 2025-2035
  • Figure 142: East Asia Market Attractiveness by Application, 2025-2035
  • Figure 143: East Asia Market Attractiveness by End User, 2025-2035
  • Figure 144: East Asia Market Attractiveness by Country, 2025-2035
  • Figure 145: South Asia & Pacific Market Value (USD Million) by Product, 2025-2035
  • Figure 146: South Asia & Pacific Market Value (USD Million) by Application, 2025-2035
  • Figure 147: South Asia & Pacific Market Value (USD Million) by End User, 2025-2035
  • Figure 148: South Asia & Pacific Market Value (USD Million) by Country, 2025-2035
  • Figure 149: South Asia & Pacific Market Value (USD Million) Analysis by Country, 2020-2035
  • Figure 150: South Asia & Pacific Market Volume (Units) Analysis by Country, 2020-2035
  • Figure 151: South Asia & Pacific Market Value Share (%) and BPS Analysis by Country, 2025-2035
  • Figure 152: South Asia & Pacific Market Y-o-Y Growth (%) Projections by Country, 2025-2035
  • Figure 153: South Asia & Pacific Market Value (USD Million) Analysis by Product, 2020-2035
  • Figure 154: South Asia & Pacific Market Volume (Units) Analysis by Product, 2020-2035
  • Figure 155: South Asia & Pacific Market Value Share (%) and BPS Analysis by Product, 2025-2035
  • Figure 156: South Asia & Pacific Market Y-o-Y Growth (%) Projections by Product, 2025-2035
  • Figure 157: South Asia & Pacific Market Value (USD Million) Analysis by Application, 2020-2035
  • Figure 158: South Asia & Pacific Market Volume (Units) Analysis by Application, 2020-2035
  • Figure 159: South Asia & Pacific Market Value Share (%) and BPS Analysis by Application, 2025-2035
  • Figure 160: South Asia & Pacific Market Y-o-Y Growth (%) Projections by Application, 2025-2035
  • Figure 161: South Asia & Pacific Market Value (USD Million) Analysis by End User, 2020-2035
  • Figure 162: South Asia & Pacific Market Volume (Units) Analysis by End User, 2020-2035
  • Figure 163: South Asia & Pacific Market Value Share (%) and BPS Analysis by End User, 2025-2035
  • Figure 164: South Asia & Pacific Market Y-o-Y Growth (%) Projections by End User, 2025-2035
  • Figure 165: South Asia & Pacific Market Attractiveness by Product, 2025-2035
  • Figure 166: South Asia & Pacific Market Attractiveness by Application, 2025-2035
  • Figure 167: South Asia & Pacific Market Attractiveness by End User, 2025-2035
  • Figure 168: South Asia & Pacific Market Attractiveness by Country, 2025-2035
  • Figure 169: Middle East & Africa Market Value (USD Million) by Product, 2025-2035
  • Figure 170: Middle East & Africa Market Value (USD Million) by Application, 2025-2035
  • Figure 171: Middle East & Africa Market Value (USD Million) by End User, 2025-2035
  • Figure 172: Middle East & Africa Market Value (USD Million) by Country, 2025-2035
  • Figure 173: Middle East & Africa Market Value (USD Million) Analysis by Country, 2020-2035
  • Figure 174: Middle East & Africa Market Volume (Units) Analysis by Country, 2020-2035
  • Figure 175: Middle East & Africa Market Value Share (%) and BPS Analysis by Country, 2025-2035
  • Figure 176: Middle East & Africa Market Y-o-Y Growth (%) Projections by Country, 2025-2035
  • Figure 177: Middle East & Africa Market Value (USD Million) Analysis by Product, 2020-2035
  • Figure 178: Middle East & Africa Market Volume (Units) Analysis by Product, 2020-2035
  • Figure 179: Middle East & Africa Market Value Share (%) and BPS Analysis by Product, 2025-2035
  • Figure 180: Middle East & Africa Market Y-o-Y Growth (%) Projections by Product, 2025-2035
  • Figure 181: Middle East & Africa Market Value (USD Million) Analysis by Application, 2020-2035
  • Figure 182: Middle East & Africa Market Volume (Units) Analysis by Application, 2020-2035
  • Figure 183: Middle East & Africa Market Value Share (%) and BPS Analysis by Application, 2025-2035
  • Figure 184: Middle East & Africa Market Y-o-Y Growth (%) Projections by Application, 2025-2035
  • Figure 185: Middle East & Africa Market Value (USD Million) Analysis by End User, 2020-2035
  • Figure 186: Middle East & Africa Market Volume (Units) Analysis by End User, 2020-2035
  • Figure 187: Middle East & Africa Market Value Share (%) and BPS Analysis by End User, 2025-2035
  • Figure 188: Middle East & Africa Market Y-o-Y Growth (%) Projections by End User, 2025-2035
  • Figure 189: Middle East & Africa Market Attractiveness by Product, 2025-2035
  • Figure 190: Middle East & Africa Market Attractiveness by Application, 2025-2035
  • Figure 191: Middle East & Africa Market Attractiveness by End User, 2025-2035
  • Figure 192: Middle East & Africa Market Attractiveness by Country, 2025-2035

Frequently Asked Questions

How big is the Sterile Pre-Pack Workstation market in 2025?

The global Sterile Pre-Pack Workstation market is estimated to be valued at USD 1533.1 billion in 2025.

What will be the size of the Sterile Pre-Pack Workstation market in 2035?

The market size for Sterile Pre-Pack Workstation is projected to reach USD 2652.4 billion by 2035.

How much will the Sterile Pre-Pack Workstation market grow between 2025 and 2035?

The Sterile Pre-Pack Workstation market is expected to grow at a CAGR of 5.6% during this period.

What are the key product types in the Sterile Pre-Pack Workstation market?

Key product types include Laminar Flow Workstations, Compounding Aseptic Isolators (CAIs), Biological Safety Cabinets (BSCs), Automated Sterile Prep-Pack Stations and Modular Cleanroom Workstations.

Which application segment will contribute a significant share in the Sterile Pre-Pack Workstation market in 2025?

The Hospital Sterile Compounding segment is projected to command 36.0% of the market in 2025.

Explore Similar Insights

Future Market Insights

Sterile Prep-Pack Workstations Market