Pre-Made Cups Market Size and Share Forecast Outlook 2025 to 2035

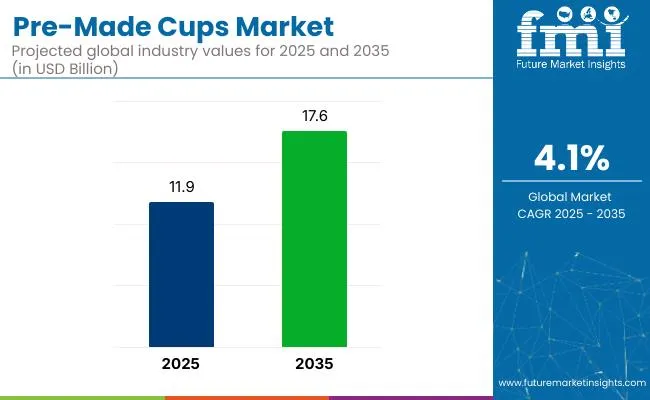
The global pre-made cups market is projected to grow from USD 11.9 billion in 2025 to USD 17.6 billion by 2035, registering a CAGR of 4.1% during the forecast period. Sales in 2024 were recorded at USD 12.94 billion.
Quick Stats of Pre-Made Cups Market

  • Market Value (2025): USD 11.9 billion
  • Forecast Value (2035): USD 17.6 billion
  • Forecast CAGR: 4.1%
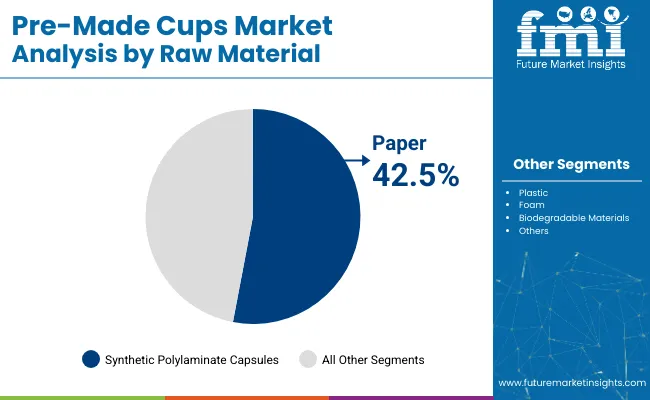
  • Raw Material Type Leader in 2025: Paper (42.5% market share)
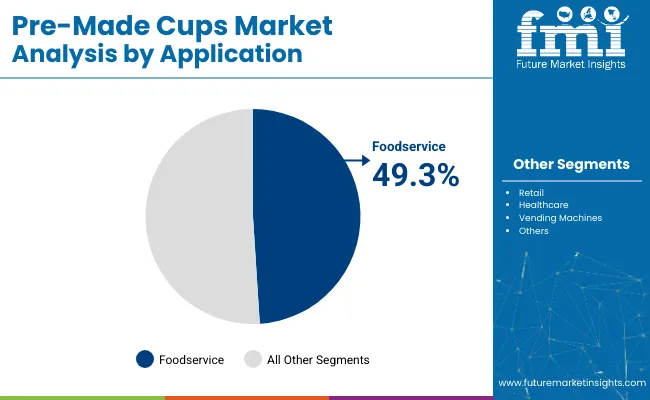
  • Top Application: Foodservice (49.3% share)
  • Key Growth Country: Asia Pacific (China to record maximum CAGR of 5.3%)

Pre Made Cups Market

This growth is primarily attributed to the increasing demand for convenient, disposable packaging solutions, the expansion of the foodservice and beverage industries, and the rising popularity of on-the-go consumption. Pre-made cups, known for their consistent quality and compatibility with high-speed filling machines, have become a preferred choice for manufacturers and consumers alike.

In April 2024, Starbucks announced the introduction of new disposable cold beverage cups containing up to 20% less plastic, aiming to reduce plastic waste and environmental impact. The redesigned cups are part of Starbucks' broader sustainability efforts to make all packaging reusable, recyclable, compostable.

Recent innovations in the pre-made cups market have significantly transformed the landscape of single-use packaging, with a clear shift toward sustainability, performance enhancement, and consumer engagement. Manufacturers are actively investing in the development of biodegradable and compostable materials, including polylactic acid (PLA), polyhydroxyalkanoates (PHA), bagasse, and molded fiber, to align with regulatory mandates and meet evolving consumer preferences.

These materials are not only plant-based but also industrially compostable, offering a promising alternative to traditional petroleum-based plastic cups.

Advances in coating technologies are enabling enhanced moisture and heat resistance without compromising recyclability. Brands are increasingly integrating aqueous and bio-resin coatings to eliminate polyethylene linings, thereby improving end-of-life processing for paper-based cups. Digital integration is another key trend shaping the innovation curve. Coupled with cloud-based data systems, these innovations facilitate smart tracking, reducing wastage and improving stock efficiency.

The global pre-made cups market is poised for dynamic expansion in the coming decade, particularly across emerging economies, driven by macroeconomic growth, rapid urbanization, and a growing culture of convenience-based consumption. Asia-Pacific is expected to dominate demand, with China, India, Indonesia, and Vietnam witnessing exponential increases in the use of pre-made disposable cups for hot and cold beverages, instant food servings, and desserts.

This uptick is directly tied to the expansion of quick-service restaurants (QSRs), coffee shop chains, and street food vendors, which increasingly rely on lightweight and cost-effective packaging formats to serve high volumes efficiently.

In parallel, rising disposable incomes, youth-driven foodservice consumption, and the adoption of Western dining formats are contributing to the market’s evolution in developing regions. Government regulations aimed at banning single-use plastics are further accelerating the transition toward paper-based and bio-resin cups, creating fertile ground for local and multinational manufacturers to expand capacity and innovate in material sourcing.

Analyzing Pre-Made Cups Market by Top Investment Segment

The market has been segmented based on raw material, capacity, usage outlook, design, application, and region. By raw material, paper, plastic, foam, and biodegradable materials are used to meet varying requirements of durability, insulation, and environmental compliance. Capacity segments include small (less than 8oz), medium (8oz - 16oz), and large (16oz or more), supporting portion-controlled packaging across multiple beverage categories.

Usage outlook includes hot beverages, cold beverages, and specialty drinks, reflecting diversification in café and QSR service models. Design segmentation covers plain, printed, textured, and insulated cups, enabling product differentiation, brand visibility, and performance in high-temperature or chilled environments.

Applications include foodservice, retail, healthcare, and vending machines, addressing institutional, commercial, and automated dispensing needs. Regional segmentation spans North America, Europe, South America, Asia Pacific, and the Middle East and Africa to capture local manufacturing capabilities, sustainability mandates, and beverage consumption trends.
Paper Segment to Lead Due to Eco-Friendly Appeal and Regulatory Backing

Pre Made Cups Market Analysis By Raw Material

The paper segment is projected to command the highest share of 42.5% in the pre-made cups market by 2025, driven by escalating global demand for sustainable, compostable, and recyclable alternatives to plastic-based food packaging. With increasing bans and levies on single-use plastics across regions such as the EU, North America, and parts of Asia Pacific, paper has emerged as the most viable substrate for hot and cold beverage cups, particularly in the QSR and café segments.

Paper cups are typically lined with a thin layer of bioplastic (PLA) or water-based barrier coatings, which make them liquid-resistant while maintaining their composability under industrial conditions. Their lightweight, stackable design and superior printability allow brands to enhance both functionality and aesthetic appeal. Additionally, the use of FSC-certified paperboard and carbon-neutral production techniques has made paper cups a centerpiece in corporate ESG strategies.

Major beverage chains and foodservice companies are transitioning to paper-based formats not just for regulatory compliance but also to align with consumer preferences for visibly sustainable packaging. With ongoing innovations in double-walled insulation, spill-proof lids, and biodegradable linings, the paper segment is expected to remain the backbone of the pre-made cups market for the foreseeable future.
Foodservice Segment to Lead Application Category with 49.3% Share Amid Rising Out-of-Home Consumption

Pre Made Cups Market Analysis By Application

The foodservice segment is expected to account for the largest share of 49.3% in the pre-made cups market by 2025, fueled by the exponential growth of cafés, quick-service restaurants (QSRs), and takeaway beverage formats across both developed and emerging markets. This includes usage across coffee chains, fast-food outlets, bakeries, smoothie bars, and tea kiosks that require scalable, hygienic, and brand able cup formats for high-volume daily operations.

Foodservice operators rely on pre-made cups for their ready-to-use convenience, consistent quality, and compatibility with high-speed filling lines. With increasing consumer preference for takeaway and delivery services, particularly post-COVID-19, the demand for leak-proof, temperature-retaining cup designs has grown substantially.

Ecofriendly packaging has become a key brand differentiator in the foodservice sector. Operators are increasingly sourcing paper-based, PLA-lined, or compostable pre-made cups that satisfy both environmental regulations and consumer expectations. Customization through digital and flexographic printing technologies allows for seasonal branding, QR code integration, and promotional messaging, adding value to every cup.

Challenges and Opportunities

Challenges

Supply Chain Disruptions, Environmental Concerns, and Rising Raw Material Costs

Due to the availability of raw material, increase cost of transportation, and disturbances in global manufacturing, the pre-made cups market experiences some challenges. Moreover, regulatory pressure on disposable premade cup manufacturers is further ramping up on the back of environmental concerns such as plastic waste, ban on single use packaging and carbon emissions.

A second issue is the increasing cost of raw materials such as paperboard, bioplastics, and aluminum coatings which presents challenges to manufacturers in maintaining profit margins while also meeting sustainability standards.

Opportunities

Growth in Sustainable Packaging, AI-Optimized Manufacturing, and Customization Trends

However, the pre-made cups market still holds immense growth opportunities due to the introduction of sustainable packaging innovations, AI-based manufacturing efficiency, and growing need for personalized packaging solutions. This movement focuses on eco-friendlier materials like biodegradable plastics, recyclable paper cups and a plant-based coating and is starting to gain ground with green shoppers and foodservice brands.

AI is also revolutionizing the supply chain used in cup manufacturing through better supply chain optimization and waste reduction. Market growth is also being driven by increased demand for customized branding and specialty cup designs, including heat-sensitive graphics, QR code-enabled cups and interactive packaging.
Country Wise Outlook

Pre Made Cups Market Cagr Analysis By Country

United States

The USA pre-made cups market is characterized by growing demand and is expected to continue to exhibit a high growth rate over the forecast period. Booming demand for QSRs, coffee chains, and RTD beverages are boosting demand in the market. Moreover, the continuous development of recyclable and compostable cup materials is expected to aid the industry growth.

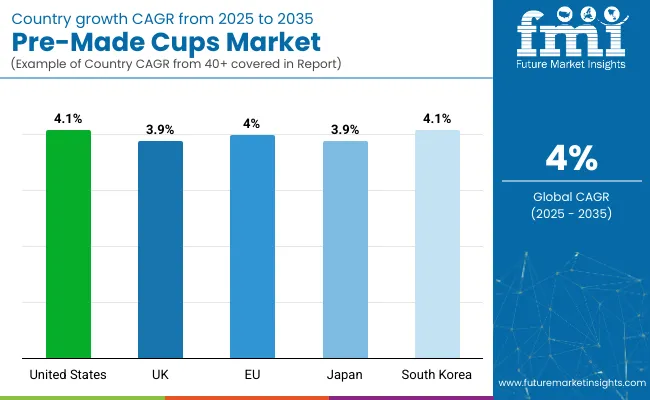
Country CAGR (2025 to 2035)
USA 4.1%

United Kingdom

The pre-made cups market in the United Kingdom is driven by increasing awareness and availability of sustainable packaging, and growing restrictions and bans on single-use plastics, as well as growing demand for paper-based and biodegradable cups. Market demand is being driven by the growth of the takeaway culture and innovations in insulated and reusable cup designs.

Country CAGR (2025 to 2035)
UK 3.9%

European Union

The pre-made cups market in the European Union is on the rise, underpinned by tough sustainability policies, a growing uptake of compostable cups in food and beverage outlets, and greater investments in circular economy packaging solutions. EU directives regulating plastic trash and promoting fiber products as alternatives these days are also expanding the market.

Region CAGR (2025 to 2035)
European Union (EU) 4.0%

Japan

Japan Pre-made cups market has moderate growth owing to growing demand for quality takeaway beverage packing, increased utilization of technical advance cups integrated with heat retention property, and strengthening effort to minimization of plastic. Market trends are being influenced by a shift toward recyclable and reusable packaging materials.

Country CAGR (2025 to 2035)
Japan 3.9%

South Korea

Demand for aesthetic and customized beverage packaging, improvement of coffee shop culture, and growing regulation on plastic waste are supporting the growth of the Pre-made cups market in South Korea. Market growth is fueled by high demand for products such as cold brew coffee, bubble tea, and specialty drinks. Also, the growing demand for biodegradable and good technology packaging is driving this industry demand.

Country CAGR (2025 to 2035)
South Korea 4.1%

Competitive Outlook

The pre-made cups market is driven by the rising demand for ready-to-use, environmentally safe, and customizable packaging solutions across industries including food & beverage, dairy, personal care and pharmaceuticals.

Growth powered by sustainable material innovations, AI-driven Manufacturing Automation and growing consumer preference for single use convenience packaging. To improve sustainability Without compromising cost efficiency and appealing to branding, businesses are concentrating on biodegradable cup manufacturing, AI-enhanced quality control, and lightweight, durable cup designs.
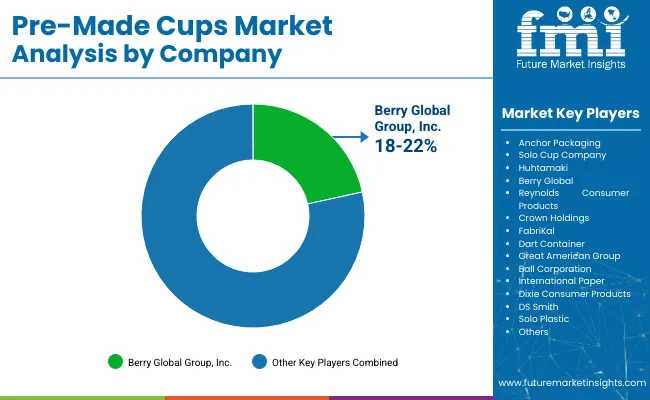
Key Companies

Pre Made Cups Market Analysis By Company

  • Berry Global
  • Anchor Packaging
  • Solo Cup Company
  • Huhtamaki
  • Reynolds Consumer Products
  • Crown Holdings
  • FabriKal
  • Dart Container
  • Great American Group
  • Ball Corporation
  • International Paper
  • Dixie Consumer Products
  • DS Smith
  • Solo Plastic

Key Segments

By Raw Material:

  • Paper
  • Plastic
  • Foam
  • Biodegradable Materials

By Capacity:

  • Small (Less than 8oz)
  • Medium (8oz - 16oz)
  • Large (16oz or more)

By Usage:

  • Hot Beverages
  • Cold Beverages
  • Specialty Drinks

By Design:

  • Plain
  • Printed
  • Textured
  • Insulated

By Application:

  • Foodservice
  • Retail
  • Healthcare
  • Vending Machines

By Region:

  • North America
  • Europe
  • South America
  • Asia Pacific
  • Middle East and Africa

Table of Content

  1. Executive Summary
    • Global Market Outlook
    • Demand-side Trends
    • Supply-side Trends
    • Technology Roadmap Analysis
    • Analysis and Recommendations
  2. Market Overview
    • Market Coverage / Taxonomy
    • Market Definition / Scope / Limitations
  3. Market Background
    • Market Dynamics
      • Drivers
      • Restraints
      • Opportunity
      • Trends
    • Scenario Forecast
      • Demand in Optimistic Scenario
      • Demand in Likely Scenario
      • Demand in Conservative Scenario
    • Opportunity Map Analysis
    • Product Life Cycle Analysis
    • Supply Chain Analysis
      • Supply Side Participants and their Roles
        • Producers
        • Mid-Level Participants (Traders/ Agents/ Brokers)
        • Wholesalers and Distributors
      • Value Added and Value Created at Node in the Supply Chain
      • List of Raw Material Suppliers
      • List of Existing and Potential Buyer’s
    • Investment Feasibility Matrix
    • Value Chain Analysis
      • Profit Margin Analysis
      • Wholesalers and Distributors
      • Retailers
    • PESTLE and Porter’s Analysis
    • Regulatory Landscape
      • By Key Regions
      • By Key Countries
    • Regional Parent Market Outlook
    • Production and Consumption Statistics
    • Import and Export Statistics
  4. Global Market Analysis 2020 to 2024 and Forecast, 2025 to 2035
    • Historical Market Size Value (USD Million) & Volume (Units) Analysis, 2020 to 2024
    • Current and Future Market Size Value (USD Million) & Volume (Units) Projections, 2025 to 2035
      • Y-o-Y Growth Trend Analysis
      • Absolute $ Opportunity Analysis
  5. Global Market Pricing Analysis 2020 to 2024 and Forecast 2025 to 2035
  6. Global Market Analysis 2020 to 2024 and Forecast 2025 to 2035, By Raw Material
    • Introduction / Key Findings
    • Historical Market Size Value (USD Million) & Volume (Units) Analysis By Raw Material, 2020 to 2024
    • Current and Future Market Size Value (USD Million) & Volume (Units) Analysis and Forecast By Raw Material, 2025 to 2035
      • Paper
      • Plastic
      • Foam
      • Biodegradable Materials
    • Y-o-Y Growth Trend Analysis By Raw Material, 2020 to 2024
    • Absolute $ Opportunity Analysis By Raw Material, 2025 to 2035
  7. Global Market Analysis 2020 to 2024 and Forecast 2025 to 2035, By Capacity
    • Introduction / Key Findings
    • Historical Market Size Value (USD Million) & Volume (Units) Analysis By Capacity, 2020 to 2024
    • Current and Future Market Size Value (USD Million) & Volume (Units) Analysis and Forecast By Capacity, 2025 to 2035
      • Small (Less than 8oz)
      • Medium (8oz - 16oz)
      • Large (16oz or more)
    • Y-o-Y Growth Trend Analysis By Capacity, 2020 to 2024
    • Absolute $ Opportunity Analysis By Capacity, 2025 to 2035
  8. Global Market Analysis 2020 to 2024 and Forecast 2025 to 2035, By Usage
    • Introduction / Key Findings
    • Historical Market Size Value (USD Million) & Volume (Units) Analysis By Usage , 2020 to 2024
    • Current and Future Market Size Value (USD Million) & Volume (Units) Analysis and Forecast By Usage , 2025 to 2035
      • Hot Beverages
      • Cold Beverages
      • Specialty Drinks
    • Y-o-Y Growth Trend Analysis By Usage , 2020 to 2024
    • Absolute $ Opportunity Analysis By Usage , 2025 to 2035
  9. Global Market Analysis 2020 to 2024 and Forecast 2025 to 2035, By Design
    • Introduction / Key Findings
    • Historical Market Size Value (USD Million) & Volume (Units) Analysis By Design, 2020 to 2024
    • Current and Future Market Size Value (USD Million) & Volume (Units) Analysis and Forecast By Design, 2025 to 2035
      • Plain
      • Printed
      • Textured
      • Insulated
    • Y-o-Y Growth Trend Analysis By Design, 2020 to 2024
    • Absolute $ Opportunity Analysis By Design, 2025 to 2035
  10. Global Market Analysis 2020 to 2024 and Forecast 2025 to 2035, By Application
    • Introduction / Key Findings
    • Historical Market Size Value (USD Million) & Volume (Units) Analysis By Application, 2020 to 2024
    • Current and Future Market Size Value (USD Million) & Volume (Units) Analysis and Forecast By Application, 2025 to 2035
      • Foodservice
      • Retail
      • Healthcare
      • Vending Machines
    • Y-o-Y Growth Trend Analysis By Application, 2020 to 2024
    • Absolute $ Opportunity Analysis By Application, 2025 to 2035
  11. Global Market Analysis 2020 to 2024 and Forecast 2025 to 2035, By Region
    • Introduction
    • Historical Market Size Value (USD Million) & Volume (Units) Analysis By Region, 2020 to 2024
    • Current Market Size Value (USD Million) & Volume (Units) Analysis and Forecast By Region, 2025 to 2035
      • North America
      • Latin America
      • Europe
      • East Asia
      • South Asia
      • Oceania
      • MEA
    • Market Attractiveness Analysis By Region
  12. North America Market Analysis 2020 to 2024 and Forecast 2025 to 2035, By Country
    • Historical Market Size Value (USD Million) & Volume (Units) Trend Analysis By Market Taxonomy, 2020 to 2024
    • Market Size Value (USD Million) & Volume (Units) Forecast By Market Taxonomy, 2025 to 2035
      • By Country
        • USA
        • Canada
      • By Raw Material
      • By Capacity
      • By Usage
      • By Design
      • By Application
    • Market Attractiveness Analysis
      • By Country
      • By Raw Material
      • By Capacity
      • By Usage
      • By Design
      • By Application
    • Key Takeaways
  13. Latin America Market Analysis 2020 to 2024 and Forecast 2025 to 2035, By Country
    • Historical Market Size Value (USD Million) & Volume (Units) Trend Analysis By Market Taxonomy, 2020 to 2024
    • Market Size Value (USD Million) & Volume (Units) Forecast By Market Taxonomy, 2025 to 2035
      • By Country
        • Brazil
        • Mexico
        • Argentina
        • Chile
        • Peru
        • Rest of Latin America
      • By Raw Material
      • By Capacity
      • By Usage
      • By Design
      • By Application
    • Market Attractiveness Analysis
      • By Country
      • By Raw Material
      • By Capacity
      • By Usage
      • By Design
      • By Application
    • Key Takeaways
  14. Europe Market Analysis 2020 to 2024 and Forecast 2025 to 2035, By Country
    • Historical Market Size Value (USD Million) & Volume (Units) Trend Analysis By Market Taxonomy, 2020 to 2024
    • Market Size Value (USD Million) & Volume (Units) Forecast By Market Taxonomy, 2025 to 2035
      • By Country
        • Germany
        • Italy
        • France
        • UK
        • Spain
        • Russia
        • BENELUX
        • Rest of Europe
      • By Raw Material
      • By Capacity
      • By Usage
      • By Design
      • By Application
    • Market Attractiveness Analysis
      • By Country
      • By Raw Material
      • By Capacity
      • By Usage
      • By Design
      • By Application
    • Key Takeaways
  15. East Asia Market Analysis 2020 to 2024 and Forecast 2025 to 2035, By Country
    • Historical Market Size Value (USD Million) & Volume (Units) Trend Analysis By Market Taxonomy, 2020 to 2024
    • Market Size Value (USD Million) & Volume (Units) Forecast By Market Taxonomy, 2025 to 2035
      • By Country
        • China
        • Japan
        • South Korea
      • By Raw Material
      • By Capacity
      • By Usage
      • By Design
      • By Application
    • Market Attractiveness Analysis
      • By Country
      • By Raw Material
      • By Capacity
      • By Usage
      • By Design
      • By Application
    • Key Takeaways
  16. South Asia Market Analysis 2020 to 2024 and Forecast 2025 to 2035, By Country
    • Historical Market Size Value (USD Million) & Volume (Units) Trend Analysis By Market Taxonomy, 2020 to 2024
    • Market Size Value (USD Million) & Volume (Units) Forecast By Market Taxonomy, 2025 to 2035
      • By Country
        • India
        • Thailand
        • Malaysia
        • Indonesia
        • Rest of South Asia
      • By Raw Material
      • By Capacity
      • By Usage
      • By Design
      • By Application
    • Market Attractiveness Analysis
      • By Country
      • By Raw Material
      • By Capacity
      • By Usage
      • By Design
      • By Application
    • Key Takeaways
  17. Oceania Market Analysis 2020 to 2024 and Forecast 2025 to 2035, By Country
    • Historical Market Size Value (USD Million) & Volume (Units) Trend Analysis By Market Taxonomy, 2020 to 2024
    • Market Size Value (USD Million) & Volume (Units) Forecast By Market Taxonomy, 2025 to 2035
      • By Country
        • Australia
        • New Zealand
      • By Raw Material
      • By Capacity
      • By Usage
      • By Design
      • By Application
    • Market Attractiveness Analysis
      • By Country
      • By Raw Material
      • By Capacity
      • By Usage
      • By Design
      • By Application
    • Key Takeaways
  18. MEA Market Analysis 2020 to 2024 and Forecast 2025 to 2035, By Country
    • Historical Market Size Value (USD Million) & Volume (Units) Trend Analysis By Market Taxonomy, 2020 to 2024
    • Market Size Value (USD Million) & Volume (Units) Forecast By Market Taxonomy, 2025 to 2035
      • By Country
        • GCC
        • Rest of MEA
      • By Raw Material
      • By Capacity
      • By Usage
      • By Design
      • By Application
    • Market Attractiveness Analysis
      • By Country
      • By Raw Material
      • By Capacity
      • By Usage
      • By Design
      • By Application
    • Key Takeaways
  19. Key Countries Market Analysis
    • USA
      • Pricing Analysis
      • Market Share Analysis, 2024
        • By Raw Material
        • By Capacity
        • By Usage
        • By Design
        • By Application
    • Canada
      • Pricing Analysis
      • Market Share Analysis, 2024
        • By Raw Material
        • By Capacity
        • By Usage
        • By Design
        • By Application
    • Brazil
      • Pricing Analysis
      • Market Share Analysis, 2024
        • By Raw Material
        • By Capacity
        • By Usage
        • By Design
        • By Application
    • Mexico
      • Pricing Analysis
      • Market Share Analysis, 2024
        • By Raw Material
        • By Capacity
        • By Usage
        • By Design
        • By Application
    • Argentina
      • Pricing Analysis
      • Market Share Analysis, 2024
        • By Raw Material
        • By Capacity
        • By Usage
        • By Design
        • By Application
  20. Market Structure Analysis
    • Competition Dashboard
    • Competition Benchmarking
    • Market Share Analysis of Top Players
      • By Regional
      • By Raw Material
      • By Capacity
      • By Usage
      • By Design
      • By Application
  21. Competition Analysis
    • Competition Deep Dive
      • Anchor Packaging
        • Overview
        • Product Portfolio
        • Profitability by Market Segments (Product/Age /Sales Channel/Region)
        • Sales Footprint
        • Strategy Overview
          • Marketing Strategy
          • Product Strategy
          • Channel Strategy
      • Solo Cup Company
        • Overview
        • Product Portfolio
        • Profitability by Market Segments (Product/Age /Sales Channel/Region)
        • Sales Footprint
        • Strategy Overview
          • Marketing Strategy
          • Product Strategy
          • Channel Strategy
      • Huhtamaki
        • Overview
        • Product Portfolio
        • Profitability by Market Segments (Product/Age /Sales Channel/Region)
        • Sales Footprint
        • Strategy Overview
          • Marketing Strategy
          • Product Strategy
          • Channel Strategy
      • Berry Global
        • Overview
        • Product Portfolio
        • Profitability by Market Segments (Product/Age /Sales Channel/Region)
        • Sales Footprint
        • Strategy Overview
          • Marketing Strategy
          • Product Strategy
          • Channel Strategy
      • Reynolds Consumer Products
        • Overview
        • Product Portfolio
        • Profitability by Market Segments (Product/Age /Sales Channel/Region)
        • Sales Footprint
        • Strategy Overview
          • Marketing Strategy
          • Product Strategy
          • Channel Strategy
      • Crown Holdings
        • Overview
        • Product Portfolio
        • Profitability by Market Segments (Product/Age /Sales Channel/Region)
        • Sales Footprint
        • Strategy Overview
          • Marketing Strategy
          • Product Strategy
          • Channel Strategy
      • FabriKal
        • Overview
        • Product Portfolio
        • Profitability by Market Segments (Product/Age /Sales Channel/Region)
        • Sales Footprint
        • Strategy Overview
          • Marketing Strategy
          • Product Strategy
          • Channel Strategy
      • Dart Container
        • Overview
        • Product Portfolio
        • Profitability by Market Segments (Product/Age /Sales Channel/Region)
        • Sales Footprint
        • Strategy Overview
          • Marketing Strategy
          • Product Strategy
          • Channel Strategy
      • Great American Group
        • Overview
        • Product Portfolio
        • Profitability by Market Segments (Product/Age /Sales Channel/Region)
        • Sales Footprint
        • Strategy Overview
          • Marketing Strategy
          • Product Strategy
          • Channel Strategy
      • Ball Corporation
        • Overview
        • Product Portfolio
        • Profitability by Market Segments (Product/Age /Sales Channel/Region)
        • Sales Footprint
        • Strategy Overview
          • Marketing Strategy
          • Product Strategy
          • Channel Strategy
  22. Assumptions & Acronyms Used
  23. Research Methodology

List of Tables

  • Table 1: Global Market Value (USD Million) Forecast by Region, 2020 to 2035
  • Table 2: Global Market Volume (Units) Forecast by Region, 2020 to 2035
  • Table 3: Global Market Value (USD Million) Forecast by Raw Material, 2020 to 2035
  • Table 4: Global Market Volume (Units) Forecast by Raw Material, 2020 to 2035
  • Table 5: Global Market Value (USD Million) Forecast by Capacity, 2020 to 2035
  • Table 6: Global Market Volume (Units) Forecast by Capacity, 2020 to 2035
  • Table 7: Global Market Value (USD Million) Forecast by Usage , 2020 to 2035
  • Table 8: Global Market Volume (Units) Forecast by Usage , 2020 to 2035
  • Table 9: Global Market Value (USD Million) Forecast by Design, 2020 to 2035
  • Table 10: Global Market Volume (Units) Forecast by Design, 2020 to 2035
  • Table 11: Global Market Value (USD Million) Forecast by Application, 2020 to 2035
  • Table 12: Global Market Volume (Units) Forecast by Application, 2020 to 2035
  • Table 13: North America Market Value (USD Million) Forecast by Country, 2020 to 2035
  • Table 14: North America Market Volume (Units) Forecast by Country, 2020 to 2035
  • Table 15: North America Market Value (USD Million) Forecast by Raw Material, 2020 to 2035
  • Table 16: North America Market Volume (Units) Forecast by Raw Material, 2020 to 2035
  • Table 17: North America Market Value (USD Million) Forecast by Capacity, 2020 to 2035
  • Table 18: North America Market Volume (Units) Forecast by Capacity, 2020 to 2035
  • Table 19: North America Market Value (USD Million) Forecast by Usage , 2020 to 2035
  • Table 20: North America Market Volume (Units) Forecast by Usage , 2020 to 2035
  • Table 21: North America Market Value (USD Million) Forecast by Design, 2020 to 2035
  • Table 22: North America Market Volume (Units) Forecast by Design, 2020 to 2035
  • Table 23: North America Market Value (USD Million) Forecast by Application, 2020 to 2035
  • Table 24: North America Market Volume (Units) Forecast by Application, 2020 to 2035
  • Table 25: Latin America Market Value (USD Million) Forecast by Country, 2020 to 2035
  • Table 26: Latin America Market Volume (Units) Forecast by Country, 2020 to 2035
  • Table 27: Latin America Market Value (USD Million) Forecast by Raw Material, 2020 to 2035
  • Table 28: Latin America Market Volume (Units) Forecast by Raw Material, 2020 to 2035
  • Table 29: Latin America Market Value (USD Million) Forecast by Capacity, 2020 to 2035
  • Table 30: Latin America Market Volume (Units) Forecast by Capacity, 2020 to 2035
  • Table 31: Latin America Market Value (USD Million) Forecast by Usage , 2020 to 2035
  • Table 32: Latin America Market Volume (Units) Forecast by Usage , 2020 to 2035
  • Table 33: Latin America Market Value (USD Million) Forecast by Design, 2020 to 2035
  • Table 34: Latin America Market Volume (Units) Forecast by Design, 2020 to 2035
  • Table 35: Latin America Market Value (USD Million) Forecast by Application, 2020 to 2035
  • Table 36: Latin America Market Volume (Units) Forecast by Application, 2020 to 2035
  • Table 37: Europe Market Value (USD Million) Forecast by Country, 2020 to 2035
  • Table 38: Europe Market Volume (Units) Forecast by Country, 2020 to 2035
  • Table 39: Europe Market Value (USD Million) Forecast by Raw Material, 2020 to 2035
  • Table 40: Europe Market Volume (Units) Forecast by Raw Material, 2020 to 2035
  • Table 41: Europe Market Value (USD Million) Forecast by Capacity, 2020 to 2035
  • Table 42: Europe Market Volume (Units) Forecast by Capacity, 2020 to 2035
  • Table 43: Europe Market Value (USD Million) Forecast by Usage , 2020 to 2035
  • Table 44: Europe Market Volume (Units) Forecast by Usage , 2020 to 2035
  • Table 45: Europe Market Value (USD Million) Forecast by Design, 2020 to 2035
  • Table 46: Europe Market Volume (Units) Forecast by Design, 2020 to 2035
  • Table 47: Europe Market Value (USD Million) Forecast by Application, 2020 to 2035
  • Table 48: Europe Market Volume (Units) Forecast by Application, 2020 to 2035
  • Table 49: East Asia Market Value (USD Million) Forecast by Country, 2020 to 2035
  • Table 50: East Asia Market Volume (Units) Forecast by Country, 2020 to 2035
  • Table 51: East Asia Market Value (USD Million) Forecast by Raw Material, 2020 to 2035
  • Table 52: East Asia Market Volume (Units) Forecast by Raw Material, 2020 to 2035
  • Table 53: East Asia Market Value (USD Million) Forecast by Capacity, 2020 to 2035
  • Table 54: East Asia Market Volume (Units) Forecast by Capacity, 2020 to 2035
  • Table 55: East Asia Market Value (USD Million) Forecast by Usage , 2020 to 2035
  • Table 56: East Asia Market Volume (Units) Forecast by Usage , 2020 to 2035
  • Table 57: East Asia Market Value (USD Million) Forecast by Design, 2020 to 2035
  • Table 58: East Asia Market Volume (Units) Forecast by Design, 2020 to 2035
  • Table 59: East Asia Market Value (USD Million) Forecast by Application, 2020 to 2035
  • Table 60: East Asia Market Volume (Units) Forecast by Application, 2020 to 2035
  • Table 61: South Asia Market Value (USD Million) Forecast by Country, 2020 to 2035
  • Table 62: South Asia Market Volume (Units) Forecast by Country, 2020 to 2035
  • Table 63: South Asia Market Value (USD Million) Forecast by Raw Material, 2020 to 2035
  • Table 64: South Asia Market Volume (Units) Forecast by Raw Material, 2020 to 2035
  • Table 65: South Asia Market Value (USD Million) Forecast by Capacity, 2020 to 2035
  • Table 66: South Asia Market Volume (Units) Forecast by Capacity, 2020 to 2035
  • Table 67: South Asia Market Value (USD Million) Forecast by Usage , 2020 to 2035
  • Table 68: South Asia Market Volume (Units) Forecast by Usage , 2020 to 2035
  • Table 69: South Asia Market Value (USD Million) Forecast by Design, 2020 to 2035
  • Table 70: South Asia Market Volume (Units) Forecast by Design, 2020 to 2035
  • Table 71: South Asia Market Value (USD Million) Forecast by Application, 2020 to 2035
  • Table 72: South Asia Market Volume (Units) Forecast by Application, 2020 to 2035
  • Table 73: Oceania Market Value (USD Million) Forecast by Country, 2020 to 2035
  • Table 74: Oceania Market Volume (Units) Forecast by Country, 2020 to 2035
  • Table 75: Oceania Market Value (USD Million) Forecast by Raw Material, 2020 to 2035
  • Table 76: Oceania Market Volume (Units) Forecast by Raw Material, 2020 to 2035
  • Table 77: Oceania Market Value (USD Million) Forecast by Capacity, 2020 to 2035
  • Table 78: Oceania Market Volume (Units) Forecast by Capacity, 2020 to 2035
  • Table 79: Oceania Market Value (USD Million) Forecast by Usage , 2020 to 2035
  • Table 80: Oceania Market Volume (Units) Forecast by Usage , 2020 to 2035
  • Table 81: Oceania Market Value (USD Million) Forecast by Design, 2020 to 2035
  • Table 82: Oceania Market Volume (Units) Forecast by Design, 2020 to 2035
  • Table 83: Oceania Market Value (USD Million) Forecast by Application, 2020 to 2035
  • Table 84: Oceania Market Volume (Units) Forecast by Application, 2020 to 2035
  • Table 85: MEA Market Value (USD Million) Forecast by Country, 2020 to 2035
  • Table 86: MEA Market Volume (Units) Forecast by Country, 2020 to 2035
  • Table 87: MEA Market Value (USD Million) Forecast by Raw Material, 2020 to 2035
  • Table 88: MEA Market Volume (Units) Forecast by Raw Material, 2020 to 2035
  • Table 89: MEA Market Value (USD Million) Forecast by Capacity, 2020 to 2035
  • Table 90: MEA Market Volume (Units) Forecast by Capacity, 2020 to 2035
  • Table 91: MEA Market Value (USD Million) Forecast by Usage , 2020 to 2035
  • Table 92: MEA Market Volume (Units) Forecast by Usage , 2020 to 2035
  • Table 93: MEA Market Value (USD Million) Forecast by Design, 2020 to 2035
  • Table 94: MEA Market Volume (Units) Forecast by Design, 2020 to 2035
  • Table 95: MEA Market Value (USD Million) Forecast by Application, 2020 to 2035
  • Table 96: MEA Market Volume (Units) Forecast by Application, 2020 to 2035

List of Figures

  • Figure 1: Global Market Volume (Units) Forecast 2020 to 2035
  • Figure 2: Global Market Pricing Analysis
  • Figure 3: Global Market Value (USD Million) Forecast 2020 to 2035
  • Figure 4: Global Market Value Share and BPS Analysis by Raw Material, 2025 and 2035
  • Figure 5: Global Market Y-o-Y Growth Comparison by Raw Material, 2025 to 2035
  • Figure 6: Global Market Attractiveness Analysis by Raw Material
  • Figure 7: Global Market Value Share and BPS Analysis by Capacity, 2025 and 2035
  • Figure 8: Global Market Y-o-Y Growth Comparison by Capacity, 2025 to 2035
  • Figure 9: Global Market Attractiveness Analysis by Capacity
  • Figure 10: Global Market Value Share and BPS Analysis by Usage , 2025 and 2035
  • Figure 11: Global Market Y-o-Y Growth Comparison by Usage , 2025 to 2035
  • Figure 12: Global Market Attractiveness Analysis by Usage
  • Figure 13: Global Market Value Share and BPS Analysis by Design, 2025 and 2035
  • Figure 14: Global Market Y-o-Y Growth Comparison by Design, 2025 to 2035
  • Figure 15: Global Market Attractiveness Analysis by Design
  • Figure 16: Global Market Value Share and BPS Analysis by Application, 2025 and 2035
  • Figure 17: Global Market Y-o-Y Growth Comparison by Application, 2025 to 2035
  • Figure 18: Global Market Attractiveness Analysis by Application
  • Figure 19: Global Market Value (USD Million) Share and BPS Analysis by Region, 2025 and 2035
  • Figure 20: Global Market Y-o-Y Growth Comparison by Region, 2025 to 2035
  • Figure 21: Global Market Attractiveness Analysis by Region
  • Figure 22: North America Market Incremental $ Opportunity, 2025 to 2035
  • Figure 23: Latin America Market Incremental $ Opportunity, 2025 to 2035
  • Figure 24: Europe Market Incremental $ Opportunity, 2025 to 2035
  • Figure 25: East Asia Market Incremental $ Opportunity, 2025 to 2035
  • Figure 26: South Asia Market Incremental $ Opportunity, 2025 to 2035
  • Figure 27: Oceania Market Incremental $ Opportunity, 2025 to 2035
  • Figure 28: MEA Market Incremental $ Opportunity, 2025 to 2035
  • Figure 29: North America Market Value Share and BPS Analysis by Country, 2025 and 2035
  • Figure 30: North America Market Value Share and BPS Analysis by Raw Material, 2025 and 2035
  • Figure 31: North America Market Y-o-Y Growth Comparison by Raw Material, 2025 to 2035
  • Figure 32: North America Market Attractiveness Analysis by Raw Material
  • Figure 33: North America Market Value Share and BPS Analysis by Capacity, 2025 and 2035
  • Figure 34: North America Market Y-o-Y Growth Comparison by Capacity, 2025 to 2035
  • Figure 35: North America Market Attractiveness Analysis by Capacity
  • Figure 36: North America Market Value Share and BPS Analysis by Usage , 2025 and 2035
  • Figure 37: North America Market Y-o-Y Growth Comparison by Usage , 2025 to 2035
  • Figure 38: North America Market Attractiveness Analysis by Usage
  • Figure 39: North America Market Value Share and BPS Analysis by Design, 2025 and 2035
  • Figure 40: North America Market Y-o-Y Growth Comparison by Design, 2025 to 2035
  • Figure 41: North America Market Attractiveness Analysis by Design
  • Figure 42: North America Market Value Share and BPS Analysis by Application, 2025 and 2035
  • Figure 43: North America Market Y-o-Y Growth Comparison by Application, 2025 to 2035
  • Figure 44: North America Market Attractiveness Analysis by Application
  • Figure 45: Latin America Market Value Share and BPS Analysis by Country, 2025 and 2035
  • Figure 46: Latin America Market Value Share and BPS Analysis by Raw Material, 2025 and 2035
  • Figure 47: Latin America Market Y-o-Y Growth Comparison by Raw Material, 2025 to 2035
  • Figure 48: Latin America Market Attractiveness Analysis by Raw Material
  • Figure 49: Latin America Market Value Share and BPS Analysis by Capacity, 2025 and 2035
  • Figure 50: Latin America Market Y-o-Y Growth Comparison by Capacity, 2025 to 2035
  • Figure 51: Latin America Market Attractiveness Analysis by Capacity
  • Figure 52: Latin America Market Value Share and BPS Analysis by Usage , 2025 and 2035
  • Figure 53: Latin America Market Y-o-Y Growth Comparison by Usage , 2025 to 2035
  • Figure 54: Latin America Market Attractiveness Analysis by Usage
  • Figure 55: Latin America Market Value Share and BPS Analysis by Design, 2025 and 2035
  • Figure 56: Latin America Market Y-o-Y Growth Comparison by Design, 2025 to 2035
  • Figure 57: Latin America Market Attractiveness Analysis by Design
  • Figure 58: Latin America Market Value Share and BPS Analysis by Application, 2025 and 2035
  • Figure 59: Latin America Market Y-o-Y Growth Comparison by Application, 2025 to 2035
  • Figure 60: Latin America Market Attractiveness Analysis by Application
  • Figure 61: Europe Market Value Share and BPS Analysis by Country, 2025 and 2035
  • Figure 62: Europe Market Value Share and BPS Analysis by Raw Material, 2025 and 2035
  • Figure 63: Europe Market Y-o-Y Growth Comparison by Raw Material, 2025 to 2035
  • Figure 64: Europe Market Attractiveness Analysis by Raw Material
  • Figure 65: Europe Market Value Share and BPS Analysis by Capacity, 2025 and 2035
  • Figure 66: Europe Market Y-o-Y Growth Comparison by Capacity, 2025 to 2035
  • Figure 67: Europe Market Attractiveness Analysis by Capacity
  • Figure 68: Europe Market Value Share and BPS Analysis by Usage , 2025 and 2035
  • Figure 69: Europe Market Y-o-Y Growth Comparison by Usage , 2025 to 2035
  • Figure 70: Europe Market Attractiveness Analysis by Usage
  • Figure 71: Europe Market Value Share and BPS Analysis by Design, 2025 and 2035
  • Figure 72: Europe Market Y-o-Y Growth Comparison by Design, 2025 to 2035
  • Figure 73: Europe Market Attractiveness Analysis by Design
  • Figure 74: Europe Market Value Share and BPS Analysis by Application, 2025 and 2035
  • Figure 75: Europe Market Y-o-Y Growth Comparison by Application, 2025 to 2035
  • Figure 76: Europe Market Attractiveness Analysis by Application
  • Figure 77: East Asia Market Value Share and BPS Analysis by Country, 2025 and 2035
  • Figure 78: East Asia Market Value Share and BPS Analysis by Raw Material, 2025 and 2035
  • Figure 79: East Asia Market Y-o-Y Growth Comparison by Raw Material, 2025 to 2035
  • Figure 80: East Asia Market Attractiveness Analysis by Raw Material
  • Figure 81: East Asia Market Value Share and BPS Analysis by Capacity, 2025 and 2035
  • Figure 82: East Asia Market Y-o-Y Growth Comparison by Capacity, 2025 to 2035
  • Figure 83: East Asia Market Attractiveness Analysis by Capacity
  • Figure 84: East Asia Market Value Share and BPS Analysis by Usage , 2025 and 2035
  • Figure 85: East Asia Market Y-o-Y Growth Comparison by Usage , 2025 to 2035
  • Figure 86: East Asia Market Attractiveness Analysis by Usage
  • Figure 87: East Asia Market Value Share and BPS Analysis by Design, 2025 and 2035
  • Figure 88: East Asia Market Y-o-Y Growth Comparison by Design, 2025 to 2035
  • Figure 89: East Asia Market Attractiveness Analysis by Design
  • Figure 90: East Asia Market Value Share and BPS Analysis by Application, 2025 and 2035
  • Figure 91: East Asia Market Y-o-Y Growth Comparison by Application, 2025 to 2035
  • Figure 92: East Asia Market Attractiveness Analysis by Application
  • Figure 93: South Asia Market Value Share and BPS Analysis by Country, 2025 and 2035
  • Figure 94: South Asia Market Value Share and BPS Analysis by Raw Material, 2025 and 2035
  • Figure 95: South Asia Market Y-o-Y Growth Comparison by Raw Material, 2025 to 2035
  • Figure 96: South Asia Market Attractiveness Analysis by Raw Material
  • Figure 97: South Asia Market Value Share and BPS Analysis by Capacity, 2025 and 2035
  • Figure 98: South Asia Market Y-o-Y Growth Comparison by Capacity, 2025 to 2035
  • Figure 99: South Asia Market Attractiveness Analysis by Capacity
  • Figure 100: South Asia Market Value Share and BPS Analysis by Usage , 2025 and 2035
  • Figure 101: South Asia Market Y-o-Y Growth Comparison by Usage , 2025 to 2035
  • Figure 102: South Asia Market Attractiveness Analysis by Usage
  • Figure 103: South Asia Market Value Share and BPS Analysis by Design, 2025 and 2035
  • Figure 104: South Asia Market Y-o-Y Growth Comparison by Design, 2025 to 2035
  • Figure 105: South Asia Market Attractiveness Analysis by Design
  • Figure 106: South Asia Market Value Share and BPS Analysis by Application, 2025 and 2035
  • Figure 107: South Asia Market Y-o-Y Growth Comparison by Application, 2025 to 2035
  • Figure 108: South Asia Market Attractiveness Analysis by Application
  • Figure 109: Oceania Market Value Share and BPS Analysis by Country, 2025 and 2035
  • Figure 110: Oceania Market Value Share and BPS Analysis by Raw Material, 2025 and 2035
  • Figure 111: Oceania Market Y-o-Y Growth Comparison by Raw Material, 2025 to 2035
  • Figure 112: Oceania Market Attractiveness Analysis by Raw Material
  • Figure 113: Oceania Market Value Share and BPS Analysis by Capacity, 2025 and 2035
  • Figure 114: Oceania Market Y-o-Y Growth Comparison by Capacity, 2025 to 2035
  • Figure 115: Oceania Market Attractiveness Analysis by Capacity
  • Figure 116: Oceania Market Value Share and BPS Analysis by Usage , 2025 and 2035
  • Figure 117: Oceania Market Y-o-Y Growth Comparison by Usage , 2025 to 2035
  • Figure 118: Oceania Market Attractiveness Analysis by Usage
  • Figure 119: Oceania Market Value Share and BPS Analysis by Design, 2025 and 2035
  • Figure 120: Oceania Market Y-o-Y Growth Comparison by Design, 2025 to 2035
  • Figure 121: Oceania Market Attractiveness Analysis by Design
  • Figure 122: Oceania Market Value Share and BPS Analysis by Application, 2025 and 2035
  • Figure 123: Oceania Market Y-o-Y Growth Comparison by Application, 2025 to 2035
  • Figure 124: Oceania Market Attractiveness Analysis by Application
  • Figure 125: MEA Market Value Share and BPS Analysis by Country, 2025 and 2035
  • Figure 126: MEA Market Value Share and BPS Analysis by Raw Material, 2025 and 2035
  • Figure 127: MEA Market Y-o-Y Growth Comparison by Raw Material, 2025 to 2035
  • Figure 128: MEA Market Attractiveness Analysis by Raw Material
  • Figure 129: MEA Market Value Share and BPS Analysis by Capacity, 2025 and 2035
  • Figure 130: MEA Market Y-o-Y Growth Comparison by Capacity, 2025 to 2035
  • Figure 131: MEA Market Attractiveness Analysis by Capacity
  • Figure 132: MEA Market Value Share and BPS Analysis by Usage , 2025 and 2035
  • Figure 133: MEA Market Y-o-Y Growth Comparison by Usage , 2025 to 2035
  • Figure 134: MEA Market Attractiveness Analysis by Usage
  • Figure 135: MEA Market Value Share and BPS Analysis by Design, 2025 and 2035
  • Figure 136: MEA Market Y-o-Y Growth Comparison by Design, 2025 to 2035
  • Figure 137: MEA Market Attractiveness Analysis by Design
  • Figure 138: MEA Market Value Share and BPS Analysis by Application, 2025 and 2035
  • Figure 139: MEA Market Y-o-Y Growth Comparison by Application, 2025 to 2035
  • Figure 140: MEA Market Attractiveness Analysis by Application
  • Figure 141: Global Market - Tier Structure Analysis
  • Figure 142: Global Market - Company Share Analysis

Frequently Asked Questions

What was the overall size of the pre-made cups market in 2025?

The overall market size for the pre-made cups market was USD 11.9 billion in 2025.

How big is the pre-made cups market expected to be in 2035?

The pre-made cups market is expected to reach USD 17.6 billion in 2035.

What will drive the demand for the pre-made cups market during the forecast period?

Growth is driven by the rising demand for convenient and sustainable packaging solutions, increasing consumption of ready-to-eat and on-the-go beverages, advancements in biodegradable and recyclable cup materials, and expanding applications in foodservice and retail sectors.

List the top 5 countries contributing to the pre-made cups market.

The top 5 countries driving the development of the pre-made cups market are the USA, China, Germany, India, and Japan.

Which segment in type is expected to lead in the pre-made cups market?

Plastic-Based Cups and the Food Industry are expected to command a significant share over the assessment period.

Explore Similar Insights

Future Market Insights

Pre-Made Cups Market