Silage Tube Market Size and Share Forecast Outlook 2025 to 2035

The Silage Tube Market is estimated to be valued at USD 644.2 million in 2025 and is projected to reach USD 1039.4 million by 2035, registering a compound annual growth rate (CAGR) of 4.9% over the forecast period.
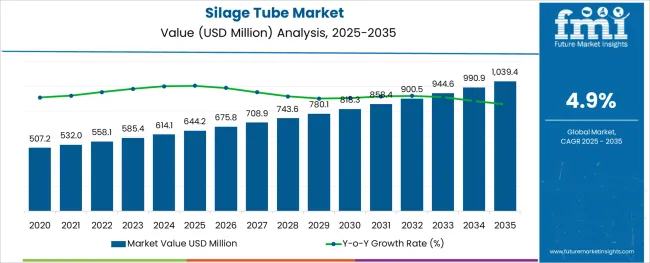
Quick Stats for Silage Tube Market

  • Industry Value (2025): USD 644.2 million
  • Forecast Value (2035): USD 1039.4 million
  • Forecast CAGR: 4.9%
  • Leading Segment in 2025: Above 3000 Kg (37.6%)
  • Key Growth Region: North America, Asia-Pacific, Europe
  • Top Key Players: HELLAGRO S.A., Flex-Pack, Canadian Hay & Silage Ltd., Panama Group, Ipesa - Rio Chico S.A., Georgia Twine, Inc., Donaghys Crop, RPC BPI Agriculture, Plastitech, Berry Global Inc., Up North Plastics, Inc., Qingdao King Top Geo Material Co., Ltd

Silage Tube Market Market Value Analysis

Rationale for Segmental Growth in the Silage Tube Market

Market Overview

The silage tube market is witnessing steady expansion driven by increasing adoption of efficient storage solutions in livestock and dairy farming. The need for preserving forage, wet grains, and other feed inputs in variable climatic conditions has prompted the demand for advanced silage tubes with enhanced strength, UV resistance, and barrier properties.

Agricultural producers are focusing on minimizing post-harvest losses and ensuring feed consistency, particularly in regions with growing dependence on mechanized silage storage. Manufacturers are responding with multilayer polymer films, oxygen-limiting technologies, and custom sizes to meet the evolving requirements of large-scale farms and contract silage producers.

Additionally, the rise of precision farming and feed quality monitoring is influencing the integration of silage tubes that align with animal nutrition planning. As input costs rise and farm margins tighten, silage tube adoption is expected to accelerate further, particularly in developing regions where investment in livestock productivity is increasing.

Segmental Analysis

The market is segmented by Capacity, Thickness, and Application and region. By Capacity, the market is divided into Above 3000 Kg, Up to 1000 Kg, and 1001-3000 Kg. In terms of Thickness, the market is classified into 201-250 Microns, Above 250 Microns, and Up to 200 Microns.

Based on Application, the market is segmented into Wet Grains, Crushed Grains, Dried Grains, and Dry Grains. Regionally, the market is classified into North America, Latin America, Western Europe, Eastern Europe, Balkan & Baltic Countries, Russia & Belarus, Central Asia, East Asia, South Asia & Pacific, and the Middle East & Africa.
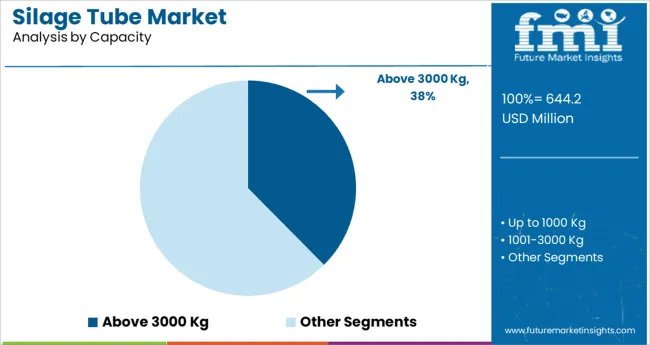
Insights into the Above 3000 Kg Capacity Segment

Silage Tube Market Analysis By Capacity

The above 3000 kg capacity segment is projected to account for 37.6% of the total revenue in 2025, marking it as the leading capacity range in the silage tube market. This dominance is attributed to the growing preference among commercial dairy and livestock operations for large-volume storage solutions that minimize handling frequency and reduce operational downtime.

The segment benefits from cost efficiencies gained through bulk storage while supporting extended fermentation and nutrient retention over long periods. Larger capacity tubes are also being favored in regions with high forage production and large herd sizes, where the economics of scale significantly influence packaging decisions.

Manufacturers are offering heavy-duty options within this category, ensuring mechanical resistance and puncture protection during both filling and storage. These functional advantages have reinforced the leadership of the above 3000 kg capacity segment.
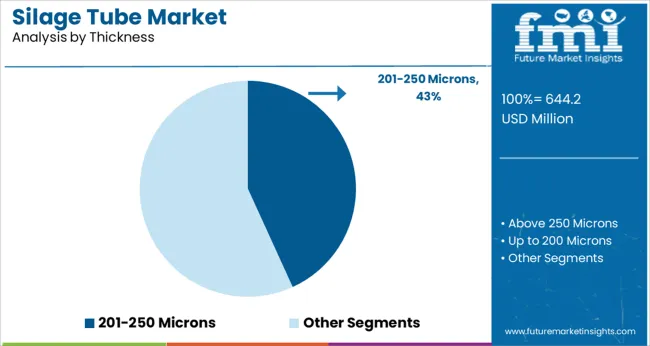
Insights into the 201–250 Microns Thickness Segment

Silage Tube Market Analysis By Thickness

The 201–250 microns segment is anticipated to hold 43.2% of market revenue in 2025 within the thickness category, establishing it as the dominant range. This position is supported by its ability to balance durability, flexibility, and cost-effectiveness across varied climatic and storage conditions.

Silage tubes in this thickness range offer reliable protection against punctures, UV degradation, and microbial infiltration, which are essential for preserving feed quality. The segment also addresses handling efficiency by offering ease of sealing, transport, and deployment in both automated and manual filling systems.

Farmers and feed contractors are selecting this thickness range for its proven performance during long-term storage, especially for high-moisture crops. With technological advancements in co-extrusion and multilayer film development, this category continues to serve as the industry standard for reliable and scalable silage storage.
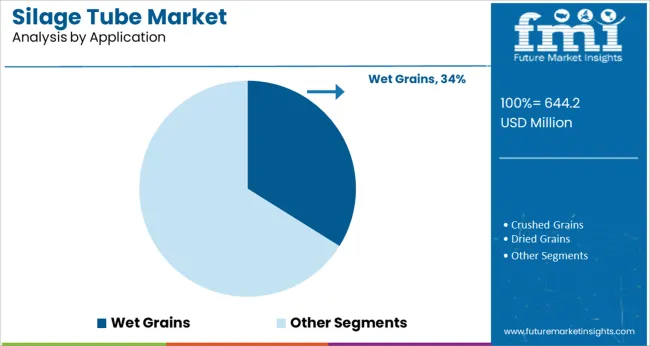
Insights into the Wet Grains Application Segment

Silage Tube Market Analysis By Application

Wet grains are expected to contribute 33.9% of the silage tube market’s revenue in 2025, making it the leading application segment. This leadership is driven by increasing grain moisture variability at harvest and the rising use of whole crop preservation techniques in ruminant feeding systems.

Silage tubes offer a controlled anaerobic environment that reduces spoilage and mycotoxin development in high-moisture grains. Their use enables extended storage without compromising nutritional quality, which is particularly valuable during supply chain disruptions or seasonal feed planning. The wet grains application segment has gained traction among producers looking to enhance feed digestibility and reduce drying costs.

As input efficiency and animal nutrition outcomes become key priorities, the utility of silage tubes in preserving wet grains has been widely recognized across large commercial farms and contract silage operations, thereby securing its dominant position in this segment.

What are the Key Drivers to the Silage Tube Market Share?

Sales of silage tubes are effectively rising while making their way in the agricultural industry as it ensures the protection of fodder and silage against adverse climatic conditions.

Acceptance of silage tubes among farmers all across the globe is expected to drive the demand for silage tubes and the growth of the silage tube market share during the forecast period. Also, the silage tube can be sealable so that once the required quantity of fodder is taken, the bag can be sealed again. Sealing also allows the preservation of humidity at the desired level, which is one of the primary factors driving the sales of silage tubes.

The demand for silage tubes is anticipated to rise as it is effective when used with a vast range of crops, including high moisture grains, dry grains, and chopped dry forage, which are meant to feed cattle.

These factors are expected to drive the sales of silage tubes and aid the growth of the global silage tube market share during the forecast period. Silage tube is available in various thicknesses and sizes depending on the requirement of the farmer.

Small farmers who cannot invest in large silo systems are preferring to silage tubes as their short-term requirement, which is anticipated to boost the demand for silage tubes. This factor further boosts the sales of silage tubes as well as the growth of the silage tube market share during the next decade.

However, the availability of different alternatives, including containers, ditches, and bunkers, can hamper the growth prospects of the silage tube market during the forecast period.
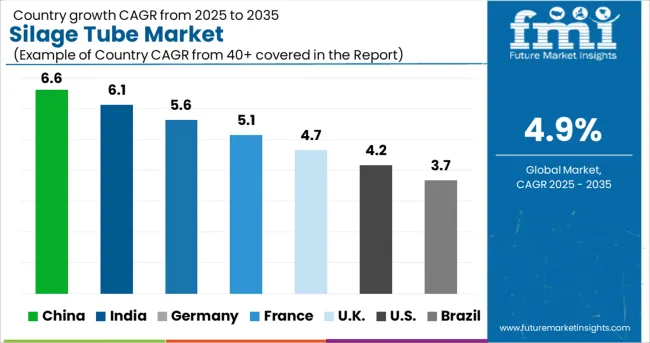
Which Region holds the Highest Growth Potential in the Silage Tube Market?

Silage Tube Market Cagr Analysis By Country

Countries such as Australia, India, and other parts of the Asia Pacific region are expected to witness high demand for silage tubes nowadays owing to changing climatic conditions.

In the Middle East and Africa region, African countries used silage tubes to keep fodder and silage to feed cattle. It is due to low rainfall in various parts of the region. African countries with low rainfall are opting for silage tubes on a mass basis. European countries such as Germany, the UK, Italy, and others are expected to witness slower growth in the silage tube market share owing to the availability of various alternatives in the regions, including bunkers, containers, and others.

Similar trends are followed in the USA and Canada. The silage tube market is expected to witness stagnant growth in the North American region. However, Brazil and Mexico are expected to witness average growth in the silage tube market during the forecast period.
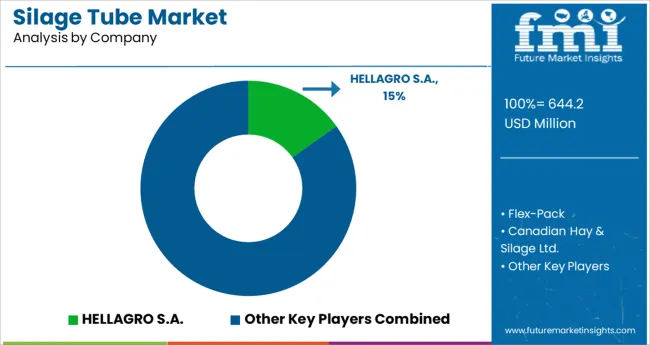
How Strong is the Competition in the Silage Tube Market?

Silage Tube Market Analysis By Company

The key players in the silage bags market are Silo Bags India (India), Flex Pack (Holland), RKW groups (Germany), Silo Bags International limited (China), Silo bag grain (Australia), Grain Bags Canada (Canada), The Panama Group (India), Ipesa - Rio Chico S.A. (Argentina), etc.

Recent Developments in Silage Tube Market

  • Donaghys debuted SEVEN-7, a silage wrap with three times the mechanical resistance to impact and perforations, in New Zealand through its silage tubes in September 2020.
  • BASF introduced Lupro-Cid® NA, a low-irritant and low-corrosive organic acid composed of buffered formic acid and propionic acid.

Scope of Report

Report Attribute Details
Growth rate CAGR of 4.9% from 2025 to 2035
The base year for estimation 2024
Historical data 2020 to 2024
Forecast period 2025 to 2035
Quantitative units Revenue in million and CAGR from 2025 to 2035
Report Coverage Revenue forecast, volume forecast, company ranking, competitive landscape, growth factors, and trends, Pricing Analysis,
Segments Covered capacity, grain types, region
Regional scope North America; Western Europe; Eastern Europe; Middle East Africa; ASEAN; South Asia; Rest of Asia; Australia and New Zealand
Country scope USA, Canada, Mexico, Germany, UK, France, Italy, Spain, Russia, Belgium, Poland, Czech Republic, China, India, Japan, Australia, Brazil, Argentina, Colombia, Saudi Arabia, UAE, Iran, South Africa
Key companies profiled Silo Bags India (India); Flex Pack (Holland); RKW groups (Germany); Silo Bags International Limited (China); Silo bag grain (Australia); Grain Bags Canada (Canada); The Panama Group (India); Ipesa - Rio Chico S.A. (Argentina)
Customization scope Free report customization (equivalent to up to 8 analysts' working days) with purchase. Addition or alteration to country, regional & segment scope.
Pricing and purchase options Avail customized purchase options to meet your exact research needs.

Key Segments

By Capacity:

  • Above 3000 Kg
  • Up to 1000 Kg
  • 1001-3000 Kg

By Thickness:

  • 201-250 Microns
  • Above 250 Microns
  • Up to 200 Microns

By Application:

  • Wet Grains
  • Crushed Grains
  • Dried Grains
  • Dry Grains

By Region:

  • North America
  • Latin America
  • Western Europe
  • Eastern Europe
  • East Asia
  • South Asia and Pacific
  • Middle East & Africa

Table of Content

  1. Executive Summary
    • Global Market Outlook
    • Demand-side Trends
    • Supply-side Trends
    • Technology Roadmap Analysis
    • Analysis and Recommendations
  2. Market Overview
    • Market Coverage / Taxonomy
    • Market Definition / Scope / Limitations
  3. Market Background
    • Market Dynamics
      • Drivers
      • Restraints
      • Opportunity
      • Trends
    • Scenario Forecast
      • Demand in Optimistic Scenario
      • Demand in Likely Scenario
      • Demand in Conservative Scenario
    • Opportunity Map Analysis
    • Product Life Cycle Analysis
    • Supply Chain Analysis
    • Investment Feasibility Matrix
    • Value Chain Analysis
    • PESTLE and Porter’s Analysis
    • Regulatory Landscape
    • Regional Parent Market Outlook
    • Production and Consumption Statistics
    • Import and Export Statistics
  4. Global Market Analysis 2020 to 2024 and Forecast, 2025 to 2035
    • Historical Market Size Value (USD Million) Analysis, 2020 to 2024
    • Current and Future Market Size Value (USD Million) Projections, 2025 to 2035
      • Y-o-Y Growth Trend Analysis
      • Absolute $ Opportunity Analysis
  5. Global Market Pricing Analysis 2020 to 2024 and Forecast 2025 to 2035
  6. Global Market Analysis 2020 to 2024 and Forecast 2025 to 2035, By Capacity
    • Introduction / Key Findings
    • Historical Market Size Value (USD Million) Analysis By Capacity , 2020 to 2024
    • Current and Future Market Size Value (USD Million) Analysis and Forecast By Capacity , 2025 to 2035
      • Above 3000 Kg
      • Up to 1000 Kg
      • 1001-3000 Kg
    • Y-o-Y Growth Trend Analysis By Capacity , 2020 to 2024
    • Absolute $ Opportunity Analysis By Capacity , 2025 to 2035
  7. Global Market Analysis 2020 to 2024 and Forecast 2025 to 2035, By Thickness
    • Introduction / Key Findings
    • Historical Market Size Value (USD Million) Analysis By Thickness, 2020 to 2024
    • Current and Future Market Size Value (USD Million) Analysis and Forecast By Thickness, 2025 to 2035
      • 201-250 Microns
      • Above 250 Microns
      • Up to 200 Microns
    • Y-o-Y Growth Trend Analysis By Thickness, 2020 to 2024
    • Absolute $ Opportunity Analysis By Thickness, 2025 to 2035
  8. Global Market Analysis 2020 to 2024 and Forecast 2025 to 2035, By Application
    • Introduction / Key Findings
    • Historical Market Size Value (USD Million) Analysis By Application, 2020 to 2024
    • Current and Future Market Size Value (USD Million) Analysis and Forecast By Application, 2025 to 2035
      • Wet Grains
      • Crushed Grains
      • Dried Grains
      • Dry Grains
    • Y-o-Y Growth Trend Analysis By Application, 2020 to 2024
    • Absolute $ Opportunity Analysis By Application, 2025 to 2035
  9. Global Market Analysis 2020 to 2024 and Forecast 2025 to 2035, By Region
    • Introduction
    • Historical Market Size Value (USD Million) Analysis By Region, 2020 to 2024
    • Current Market Size Value (USD Million) Analysis and Forecast By Region, 2025 to 2035
      • North America
      • Latin America
      • Western Europe
      • Eastern Europe
      • East Asia
      • South Asia and Pacific
      • Middle East & Africa
    • Market Attractiveness Analysis By Region
  10. North America Market Analysis 2020 to 2024 and Forecast 2025 to 2035, By Country
    • Historical Market Size Value (USD Million) Trend Analysis By Market Taxonomy, 2020 to 2024
    • Market Size Value (USD Million) Forecast By Market Taxonomy, 2025 to 2035
      • By Country
        • USA
        • Canada
        • Mexico
      • By Capacity
      • By Thickness
      • By Application
    • Market Attractiveness Analysis
      • By Country
      • By Capacity
      • By Thickness
      • By Application
    • Key Takeaways
  11. Latin America Market Analysis 2020 to 2024 and Forecast 2025 to 2035, By Country
    • Historical Market Size Value (USD Million) Trend Analysis By Market Taxonomy, 2020 to 2024
    • Market Size Value (USD Million) Forecast By Market Taxonomy, 2025 to 2035
      • By Country
        • Brazil
        • Chile
        • Rest of Latin America
      • By Capacity
      • By Thickness
      • By Application
    • Market Attractiveness Analysis
      • By Country
      • By Capacity
      • By Thickness
      • By Application
    • Key Takeaways
  12. Western Europe Market Analysis 2020 to 2024 and Forecast 2025 to 2035, By Country
    • Historical Market Size Value (USD Million) Trend Analysis By Market Taxonomy, 2020 to 2024
    • Market Size Value (USD Million) Forecast By Market Taxonomy, 2025 to 2035
      • By Country
        • Germany
        • UK
        • Italy
        • Spain
        • France
        • Nordic
        • BENELUX
        • Rest of Western Europe
      • By Capacity
      • By Thickness
      • By Application
    • Market Attractiveness Analysis
      • By Country
      • By Capacity
      • By Thickness
      • By Application
    • Key Takeaways
  13. Eastern Europe Market Analysis 2020 to 2024 and Forecast 2025 to 2035, By Country
    • Historical Market Size Value (USD Million) Trend Analysis By Market Taxonomy, 2020 to 2024
    • Market Size Value (USD Million) Forecast By Market Taxonomy, 2025 to 2035
      • By Country
        • Russia
        • Poland
        • Hungary
        • Balkan & Baltic
        • Rest of Eastern Europe
      • By Capacity
      • By Thickness
      • By Application
    • Market Attractiveness Analysis
      • By Country
      • By Capacity
      • By Thickness
      • By Application
    • Key Takeaways
  14. East Asia Market Analysis 2020 to 2024 and Forecast 2025 to 2035, By Country
    • Historical Market Size Value (USD Million) Trend Analysis By Market Taxonomy, 2020 to 2024
    • Market Size Value (USD Million) Forecast By Market Taxonomy, 2025 to 2035
      • By Country
        • China
        • Japan
        • South Korea
      • By Capacity
      • By Thickness
      • By Application
    • Market Attractiveness Analysis
      • By Country
      • By Capacity
      • By Thickness
      • By Application
    • Key Takeaways
  15. South Asia and Pacific Market Analysis 2020 to 2024 and Forecast 2025 to 2035, By Country
    • Historical Market Size Value (USD Million) Trend Analysis By Market Taxonomy, 2020 to 2024
    • Market Size Value (USD Million) Forecast By Market Taxonomy, 2025 to 2035
      • By Country
        • India
        • ASEAN
        • Australia & New Zealand
        • Rest of South Asia and Pacific
      • By Capacity
      • By Thickness
      • By Application
    • Market Attractiveness Analysis
      • By Country
      • By Capacity
      • By Thickness
      • By Application
    • Key Takeaways
  16. Middle East & Africa Market Analysis 2020 to 2024 and Forecast 2025 to 2035, By Country
    • Historical Market Size Value (USD Million) Trend Analysis By Market Taxonomy, 2020 to 2024
    • Market Size Value (USD Million) Forecast By Market Taxonomy, 2025 to 2035
      • By Country
        • Kingdom of Saudi Arabia
        • Other GCC Countries
        • Turkiye
        • South Africa
        • Other African Union
        • Rest of Middle East & Africa
      • By Capacity
      • By Thickness
      • By Application
    • Market Attractiveness Analysis
      • By Country
      • By Capacity
      • By Thickness
      • By Application
    • Key Takeaways
  17. Key Countries Market Analysis
    • USA
      • Pricing Analysis
      • Market Share Analysis, 2024
        • By Capacity
        • By Thickness
        • By Application
    • Canada
      • Pricing Analysis
      • Market Share Analysis, 2024
        • By Capacity
        • By Thickness
        • By Application
    • Mexico
      • Pricing Analysis
      • Market Share Analysis, 2024
        • By Capacity
        • By Thickness
        • By Application
    • Brazil
      • Pricing Analysis
      • Market Share Analysis, 2024
        • By Capacity
        • By Thickness
        • By Application
    • Chile
      • Pricing Analysis
      • Market Share Analysis, 2024
        • By Capacity
        • By Thickness
        • By Application
    • Germany
      • Pricing Analysis
      • Market Share Analysis, 2024
        • By Capacity
        • By Thickness
        • By Application
    • UK
      • Pricing Analysis
      • Market Share Analysis, 2024
        • By Capacity
        • By Thickness
        • By Application
    • Italy
      • Pricing Analysis
      • Market Share Analysis, 2024
        • By Capacity
        • By Thickness
        • By Application
    • Spain
      • Pricing Analysis
      • Market Share Analysis, 2024
        • By Capacity
        • By Thickness
        • By Application
    • France
      • Pricing Analysis
      • Market Share Analysis, 2024
        • By Capacity
        • By Thickness
        • By Application
    • India
      • Pricing Analysis
      • Market Share Analysis, 2024
        • By Capacity
        • By Thickness
        • By Application
    • ASEAN
      • Pricing Analysis
      • Market Share Analysis, 2024
        • By Capacity
        • By Thickness
        • By Application
    • Australia & New Zealand
      • Pricing Analysis
      • Market Share Analysis, 2024
        • By Capacity
        • By Thickness
        • By Application
    • China
      • Pricing Analysis
      • Market Share Analysis, 2024
        • By Capacity
        • By Thickness
        • By Application
    • Japan
      • Pricing Analysis
      • Market Share Analysis, 2024
        • By Capacity
        • By Thickness
        • By Application
    • South Korea
      • Pricing Analysis
      • Market Share Analysis, 2024
        • By Capacity
        • By Thickness
        • By Application
    • Russia
      • Pricing Analysis
      • Market Share Analysis, 2024
        • By Capacity
        • By Thickness
        • By Application
    • Poland
      • Pricing Analysis
      • Market Share Analysis, 2024
        • By Capacity
        • By Thickness
        • By Application
    • Hungary
      • Pricing Analysis
      • Market Share Analysis, 2024
        • By Capacity
        • By Thickness
        • By Application
    • Kingdom of Saudi Arabia
      • Pricing Analysis
      • Market Share Analysis, 2024
        • By Capacity
        • By Thickness
        • By Application
    • Turkiye
      • Pricing Analysis
      • Market Share Analysis, 2024
        • By Capacity
        • By Thickness
        • By Application
    • South Africa
      • Pricing Analysis
      • Market Share Analysis, 2024
        • By Capacity
        • By Thickness
        • By Application
  18. Market Structure Analysis
    • Competition Dashboard
    • Competition Benchmarking
    • Market Share Analysis of Top Players
      • By Regional
      • By Capacity
      • By Thickness
      • By Application
  19. Competition Analysis
    • Competition Deep Dive
      • HELLAGRO S.A.
        • Overview
        • Product Portfolio
        • Profitability by Market Segments (Product/Age /Sales Channel/Region)
        • Sales Footprint
        • Strategy Overview
          • Marketing Strategy
          • Product Strategy
          • Channel Strategy
      • Flex-Pack
      • Canadian Hay & Silage Ltd.
      • Panama Group
      • Ipesa - Rio Chico S.A.
      • Georgia Twine, Inc.
      • Donaghys Crop
      • RPC BPI Agriculture
      • Plastitech
      • Berry Global Inc.
      • Up North Plastics, Inc.
      • Qingdao King Top Geo Material Co., Ltd
  20. Assumptions & Acronyms Used
  21. Research Methodology

List of Tables

  • Table 1: Global Market Value (USD Million) Forecast by Region, 2020-2035
  • Table 2: North America Market Value (USD Million) Forecast by Country, 2020-2035
  • Table 3: Latin America Market Value (USD Million) Forecast by Country, 2020-2035
  • Table 4: Western Europe Market Value (USD Million) Forecast by Country, 2020-2035
  • Table 5: Eastern Europe Market Value (USD Million) Forecast by Country, 2020-2035
  • Table 6: East Asia Market Value (USD Million) Forecast by Country, 2020-2035
  • Table 7: South Asia and Pacific Market Value (USD Million) Forecast by Country, 2020-2035
  • Table 8: Middle East & Africa Market Value (USD Million) Forecast by Country, 2020-2035

List of Figures

  • Figure 1: Global Market Pricing Analysis
  • Figure 2: Global Market Value (USD Million) Forecast 2020-2035
  • Figure 3: Global Market Value (USD Million) Share and BPS Analysis by Region, 2025 and 2035
  • Figure 4: Global Market Y-o-Y Growth Comparison by Region, 2025-2035
  • Figure 5: Global Market Attractiveness Analysis by Region
  • Figure 6: North America Market Incremental $ Opportunity, 2025-2035
  • Figure 7: Latin America Market Incremental $ Opportunity, 2025-2035
  • Figure 8: Western Europe Market Incremental $ Opportunity, 2025-2035
  • Figure 9: Eastern Europe Market Incremental $ Opportunity, 2025-2035
  • Figure 10: East Asia Market Incremental $ Opportunity, 2025-2035
  • Figure 11: South Asia and Pacific Market Incremental $ Opportunity, 2025-2035
  • Figure 12: Middle East & Africa Market Incremental $ Opportunity, 2025-2035
  • Figure 13: North America Market Value Share and BPS Analysis by Country, 2025 and 2035
  • Figure 14: Latin America Market Value Share and BPS Analysis by Country, 2025 and 2035
  • Figure 15: Western Europe Market Value Share and BPS Analysis by Country, 2025 and 2035
  • Figure 16: Eastern Europe Market Value Share and BPS Analysis by Country, 2025 and 2035
  • Figure 17: East Asia Market Value Share and BPS Analysis by Country, 2025 and 2035
  • Figure 18: South Asia and Pacific Market Value Share and BPS Analysis by Country, 2025 and 2035
  • Figure 19: Middle East & Africa Market Value Share and BPS Analysis by Country, 2025 and 2035
  • Figure 20: Global Market - Tier Structure Analysis
  • Figure 21: Global Market - Company Share Analysis

Frequently Asked Questions

How big is the silage tube market in 2025?

The global silage tube market is estimated to be valued at USD 644.2 million in 2025.

What will be the market size for the silage tube market in 2035?

It is projected to reach USD 1,039.4 million by 2035.

How much will be the CAGR of the silage tube market between 2025 and 2035?

The market is expected to grow at a 4.9% CAGR between 2025 and 2035.

What are the key product types in the silage tube market?

The key product types are above 3000 kg, up to 1000 kg and 1001-3000 kg.

Which 201-250 microns segment is expected to dominate the silage tube market in 2025?

201-250 microns segment is expected to dominate with a 43.2% industry share in 2025.

Explore Similar Insights

Future Market Insights

Silage Tube Market