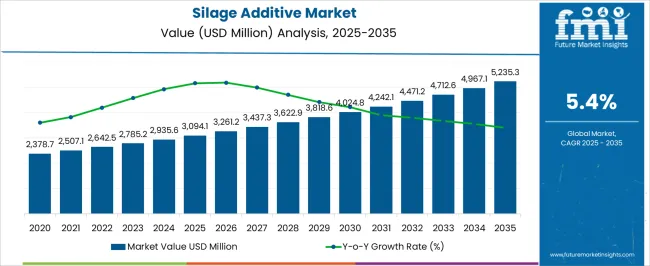
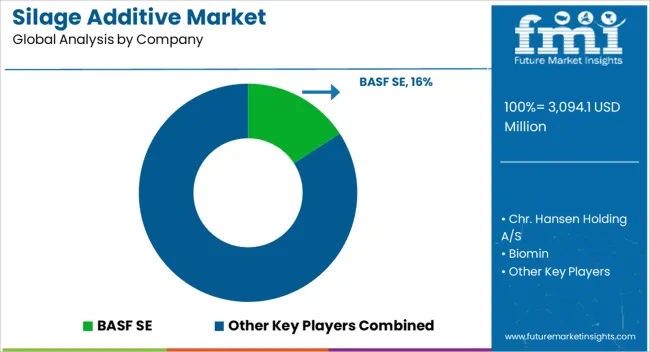
The global silage additive market is estimated to be worth USD 4,902.9 million by 2034. According to the estimates, the market is projected to clock a 5.4% CAGR until 2034. In 2024, the silage additive market size is valued at USD 2,935.6 million.
Attributes | Details |
---|---|
Global Silage Additive Market Size (2024E) | USD 2,935.6 million |
Projected Silage Additive Market Value (2034F) | USD 4,902.9 million |
Value-based CAGR (2024 to 2034) | 5.4% |
Market Statistics | Details |
---|---|
Jul to Dec (H2), 2022 (A) | 6.8% |
Jan to Jun (H1), 2022 (A) | 6.2% |
Jan to Jun (H1), 2023 Projected (P) | 7.3% |
Jan to Jun (H1), 2023 Outlook (O) | 6.9% |
Jan to Jun (H1), 2024 Projected (P) | 9.2% |
Jul to Dec (H2), 2023 Outlook (O) | 6.9% |
Jul to Dec (H2), 2023 Projected (P) | 7.9% |
Global sales of silage additives increased at a 4.1% CAGR from 2019 to 2023. Over the next ten years, the global market for silage additives is expected to thrive at a CAGR of 5.4%.
Global silage additives sales are predicted to increase significantly between 2024 and 2034. The formation of significant organizations, such as the European Feed Additives Manufacturers Association (FEFANA) and the British Association of Feed Supplement & Additive Manufacturers (BAFSAM), is crucial in promoting a community amongst cattle and ruminant owners.
This community-building initiative has increased members' awareness regarding optimal practices for the betterment of the dairy industry. By diligently studying various animal feed additives, specialty ingredients, and feed ingredients, these associations aim to boost productivity collectively. Additionally, they facilitate cross-border communication, fostering a more efficient exchange of ideas and innovation.
As exemplified by Lallemand Animal Nutrition, manufacturers are actively working to enhance knowledge about properly cutting and storing silage. Companies are instituting expert panels and support teams to streamline the application of silage additives, ensuring a hassle-free experience for users. Notably, Ecosyl, a subsidiary of Volac International Limited, has strategically deployed regional experts to provide continuous assistance for optimal outcomes.
To further encourage the adoption of silage additives, manufacturers are offering free consultation services, a move expected to positively influence consumer perceptions and drive increased consumption of Silage Additives. This proactive approach by industry associations and manufacturers signals a concerted effort to advance knowledge, streamline application processes, and ultimately contribute to the overall improvement of the global dairy industry.
Regions | North America |
---|---|
Countries | United States |
Value CAGR (2024 to 2034) | 4.4% |
Regions | Europe |
---|---|
Countries | United Kingdom |
Value CAGR (2024 to 2034) | 7.5% |
Regions | Europe |
---|---|
Countries | Germany |
Value CAGR (2024 to 2034) | 4.5% |
Regions | Asia Pacific |
---|---|
Countries | India |
Value CAGR (2024 to 2034) | 6.2% |
Regions | Asia Pacific |
---|---|
Countries | Japan |
Value CAGR (2024 to 2034) | 6.0% |
The silage additives industry in the United States is expected to exhibit a 4.4% CAGR through 2034.
The silage additive market growth in the United Kingdom is estimated at a 7.5% CAGR through 2034.
The sales of silage additives in Germany are anticipated to surge at a 4.5% CAGR through 2034.
The demand for silage additives in India is expected to rise at a CAGR of 6.2% and hold a dominant market share of 40.0% in the South Asia region.
The demand for silage additives in Japan is anticipated to rise at a 6.0% CAGR through 2034.
Segment | Heterofermentative Inoculants (Product Type) |
---|---|
Value (2024) | USD 875.0 million |
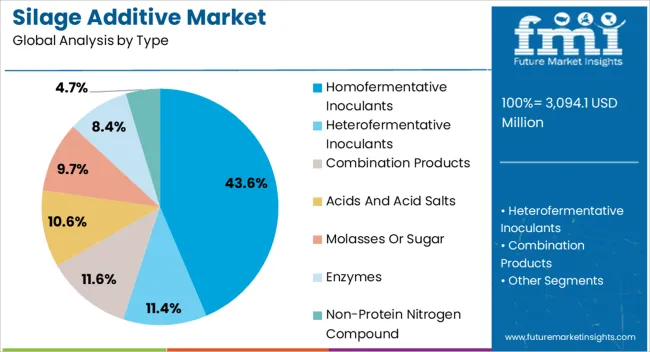
Based on product type, the heterofermentative inoculants segment garnered USD 875.0 million in 2024.
Segment | Liquid (Form) |
---|---|
Value (2024) | USD 2,550.0 million |
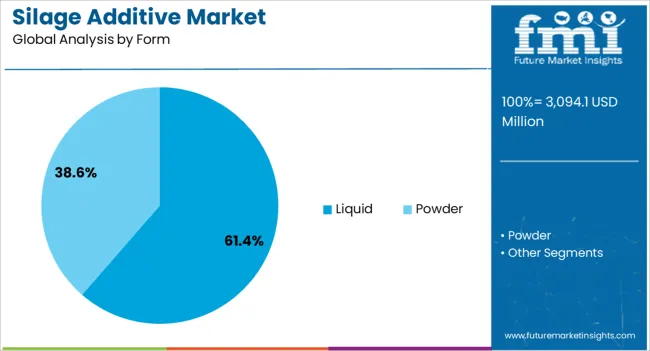
Based on form, the liquid form segment generated USD 2,550.0 million in 2024.
The silage additive market has a diverse and dynamic competitive landscape. Leading companies specializing in various fields focus on research and development, sustainable sourcing, and new formulations. These companies emphasize environmentally friendly practices, product certifications, and satisfying the increased demand for natural and sustainable ingredients.
Additionally, it attempts to preserve its market position and benefit from the growing demand by focusing on innovation, quality, and matching customer preferences.
Recent Developments
Attribute | Details |
---|---|
Market Size Value in 2024 | USD 2,935.6 million |
Market Forecast Value in 2034 | USD 4,902.9 million |
Global Growth Rate | 5.4% CAGR |
Forecast Period | 2024 to 2034 |
Historical Data Available for | 2019 to 2023 |
Market Analysis | Volume (MT) and Value (US$ million) |
Key Regions Covered | Latin America, Europe, North America, South Asia, East Asia, Oceania, and MEA |
Key Countries Covered | the United States, Brazil, Mexico, Chile, Argentina, Peru, Italy, Spain, Germany, France, Canada, the United Kingdom, the Belgium, Russia, Netherlands, the Nordic region, Poland, Japan, South Korea, China, India, Thailand, Singapore, Australia, Indonesia, Malaysia, Gulf Cooperation Council countries, New Zealand, Central Africa, and South Africa |
Key Market Segments Covered | Product Type, Form, Function, Silage Crop, and Region |
Pricing | Available upon Request |
Table 1: Global Market Value (US$ billion) Forecast by Region, 2019 to 2034
Table 2: Global Market Volume (MT) Forecast by Region, 2019 to 2034
Table 3: Global Market Value (US$ billion) Forecast by Product Type, 2019 to 2034
Table 4: Global Market Volume (MT) Forecast by Product Type, 2019 to 2034
Table 5: Global Market Value (US$ billion) Forecast by Form, 2019 to 2034
Table 6: Global Market Volume (MT) Forecast by Form, 2019 to 2034
Table 7: Global Market Value (US$ billion) Forecast by Function, 2019 to 2034
Table 8: Global Market Volume (MT) Forecast by Function, 2019 to 2034
Table 9: Global Market Value (US$ billion) Forecast by Silage Crop, 2019 to 2034
Table 10: Global Market Volume (MT) Forecast by Silage Crop, 2019 to 2034
Table 11: North America Market Value (US$ billion) Forecast by Country, 2019 to 2034
Table 12: North America Market Volume (MT) Forecast by Country, 2019 to 2034
Table 13: North America Market Value (US$ billion) Forecast by Product Type, 2019 to 2034
Table 14: North America Market Volume (MT) Forecast by Product Type, 2019 to 2034
Table 15: North America Market Value (US$ billion) Forecast by Form, 2019 to 2034
Table 16: North America Market Volume (MT) Forecast by Form, 2019 to 2034
Table 17: North America Market Value (US$ billion) Forecast by Function, 2019 to 2034
Table 18: North America Market Volume (MT) Forecast by Function, 2019 to 2034
Table 19: North America Market Value (US$ billion) Forecast by Silage Crop, 2019 to 2034
Table 20: North America Market Volume (MT) Forecast by Silage Crop, 2019 to 2034
Table 21: Latin America Market Value (US$ billion) Forecast by Country, 2019 to 2034
Table 22: Latin America Market Volume (MT) Forecast by Country, 2019 to 2034
Table 23: Latin America Market Value (US$ billion) Forecast by Product Type, 2019 to 2034
Table 24: Latin America Market Volume (MT) Forecast by Product Type, 2019 to 2034
Table 25: Latin America Market Value (US$ billion) Forecast by Form, 2019 to 2034
Table 26: Latin America Market Volume (MT) Forecast by Form, 2019 to 2034
Table 27: Latin America Market Value (US$ billion) Forecast by Function, 2019 to 2034
Table 28: Latin America Market Volume (MT) Forecast by Function, 2019 to 2034
Table 29: Latin America Market Value (US$ billion) Forecast by Silage Crop, 2019 to 2034
Table 30: Latin America Market Volume (MT) Forecast by Silage Crop, 2019 to 2034
Table 31: Europe Market Value (US$ billion) Forecast by Country, 2019 to 2034
Table 32: Europe Market Volume (MT) Forecast by Country, 2019 to 2034
Table 33: Europe Market Value (US$ billion) Forecast by Product Type, 2019 to 2034
Table 34: Europe Market Volume (MT) Forecast by Product Type, 2019 to 2034
Table 35: Europe Market Value (US$ billion) Forecast by Form, 2019 to 2034
Table 36: Europe Market Volume (MT) Forecast by Form, 2019 to 2034
Table 37: Europe Market Value (US$ billion) Forecast by Function, 2019 to 2034
Table 38: Europe Market Volume (MT) Forecast by Function, 2019 to 2034
Table 39: Europe Market Value (US$ billion) Forecast by Silage Crop, 2019 to 2034
Table 40: Europe Market Volume (MT) Forecast by Silage Crop, 2019 to 2034
Table 41: East Asia Market Value (US$ billion) Forecast by Country, 2019 to 2034
Table 42: East Asia Market Volume (MT) Forecast by Country, 2019 to 2034
Table 43: East Asia Market Value (US$ billion) Forecast by Product Type, 2019 to 2034
Table 44: East Asia Market Volume (MT) Forecast by Product Type, 2019 to 2034
Table 45: East Asia Market Value (US$ billion) Forecast by Form, 2019 to 2034
Table 46: East Asia Market Volume (MT) Forecast by Form, 2019 to 2034
Table 47: East Asia Market Value (US$ billion) Forecast by Function, 2019 to 2034
Table 48: East Asia Market Volume (MT) Forecast by Function, 2019 to 2034
Table 49: East Asia Market Value (US$ billion) Forecast by Silage Crop, 2019 to 2034
Table 50: East Asia Market Volume (MT) Forecast by Silage Crop, 2019 to 2034
Table 51: South Asia Market Value (US$ billion) Forecast by Country, 2019 to 2034
Table 52: South Asia Market Volume (MT) Forecast by Country, 2019 to 2034
Table 53: South Asia Market Value (US$ billion) Forecast by Product Type, 2019 to 2034
Table 54: South Asia Market Volume (MT) Forecast by Product Type, 2019 to 2034
Table 55: South Asia Market Value (US$ billion) Forecast by Form, 2019 to 2034
Table 56: South Asia Market Volume (MT) Forecast by Form, 2019 to 2034
Table 57: South Asia Market Value (US$ billion) Forecast by Function, 2019 to 2034
Table 58: South Asia Market Volume (MT) Forecast by Function, 2019 to 2034
Table 59: South Asia Market Value (US$ billion) Forecast by Silage Crop, 2019 to 2034
Table 60: South Asia Market Volume (MT) Forecast by Silage Crop, 2019 to 2034
Table 61: Oceania Market Value (US$ billion) Forecast by Country, 2019 to 2034
Table 62: Oceania Market Volume (MT) Forecast by Country, 2019 to 2034
Table 63: Oceania Market Value (US$ billion) Forecast by Product Type, 2019 to 2034
Table 64: Oceania Market Volume (MT) Forecast by Product Type, 2019 to 2034
Table 65: Oceania Market Value (US$ billion) Forecast by Form, 2019 to 2034
Table 66: Oceania Market Volume (MT) Forecast by Form, 2019 to 2034
Table 67: Oceania Market Value (US$ billion) Forecast by Function, 2019 to 2034
Table 68: Oceania Market Volume (MT) Forecast by Function, 2019 to 2034
Table 69: Oceania Market Value (US$ billion) Forecast by Silage Crop, 2019 to 2034
Table 70: Oceania Market Volume (MT) Forecast by Silage Crop, 2019 to 2034
Table 71: MEA Market Value (US$ billion) Forecast by Country, 2019 to 2034
Table 72: MEA Market Volume (MT) Forecast by Country, 2019 to 2034
Table 73: MEA Market Value (US$ billion) Forecast by Product Type, 2019 to 2034
Table 74: MEA Market Volume (MT) Forecast by Product Type, 2019 to 2034
Table 75: MEA Market Value (US$ billion) Forecast by Form, 2019 to 2034
Table 76: MEA Market Volume (MT) Forecast by Form, 2019 to 2034
Table 77: MEA Market Value (US$ billion) Forecast by Function, 2019 to 2034
Table 78: MEA Market Volume (MT) Forecast by Function, 2019 to 2034
Table 79: MEA Market Value (US$ billion) Forecast by Silage Crop, 2019 to 2034
Table 80: MEA Market Volume (MT) Forecast by Silage Crop, 2019 to 2034
Figure 1: Global Market Value (US$ billion) by Product Type, 2024 to 2034
Figure 2: Global Market Value (US$ billion) by Form, 2024 to 2034
Figure 3: Global Market Value (US$ billion) by Function, 2024 to 2034
Figure 4: Global Market Value (US$ billion) by Silage Crop, 2024 to 2034
Figure 5: Global Market Value (US$ billion) by Region, 2024 to 2034
Figure 6: Global Market Value (US$ billion) Analysis by Region, 2019 to 2034
Figure 7: Global Market Volume (MT) Analysis by Region, 2019 to 2034
Figure 8: Global Market Value Share (%) and BPS Analysis by Region, 2024 to 2034
Figure 9: Global Market Y-o-Y Growth (%) Projections by Region, 2024 to 2034
Figure 10: Global Market Value (US$ billion) Analysis by Product Type, 2019 to 2034
Figure 11: Global Market Volume (MT) Analysis by Product Type, 2019 to 2034
Figure 12: Global Market Value Share (%) and BPS Analysis by Product Type, 2024 to 2034
Figure 13: Global Market Y-o-Y Growth (%) Projections by Product Type, 2024 to 2034
Figure 14: Global Market Value (US$ billion) Analysis by Form, 2019 to 2034
Figure 15: Global Market Volume (MT) Analysis by Form, 2019 to 2034
Figure 16: Global Market Value Share (%) and BPS Analysis by Form, 2024 to 2034
Figure 18: Global Market Y-o-Y Growth (%) Projections by Form, 2024 to 2034
Figure 18: Global Market Value (US$ billion) Analysis by Function, 2019 to 2034
Figure 19: Global Market Volume (MT) Analysis by Function, 2019 to 2034
Figure 20: Global Market Value Share (%) and BPS Analysis by Function, 2024 to 2034
Figure 22: Global Market Y-o-Y Growth (%) Projections by Function, 2024 to 2034
Figure 23: Global Market Value (US$ billion) Analysis by Silage Crop, 2019 to 2034
Figure 23: Global Market Volume (MT) Analysis by Silage Crop, 2019 to 2034
Figure 24: Global Market Value Share (%) and BPS Analysis by Silage Crop, 2024 to 2034
Figure 25: Global Market Y-o-Y Growth (%) Projections by Silage Crop, 2024 to 2034
Figure 26: Global Market Attractiveness by Product Type, 2024 to 2034
Figure 27: Global Market Attractiveness by Form, 2024 to 2034
Figure 28: Global Market Attractiveness by Function, 2024 to 2034
Figure 29: Global Market Attractiveness by Silage Crop, 2024 to 2034
Figure 30: Global Market Attractiveness by Region, 2024 to 2034
Figure 31: North America Market Value (US$ billion) by Product Type, 2024 to 2034
Figure 33: North America Market Value (US$ billion) by Form, 2024 to 2034
Figure 33: North America Market Value (US$ billion) by Function, 2024 to 2034
Figure 34: North America Market Value (US$ billion) by Silage Crop, 2024 to 2034
Figure 35: North America Market Value (US$ billion) by Country, 2024 to 2034
Figure 36: North America Market Value (US$ billion) Analysis by Country, 2019 to 2034
Figure 37: North America Market Volume (MT) Analysis by Country, 2019 to 2034
Figure 38: North America Market Value Share (%) and BPS Analysis by Country, 2024 to 2034
Figure 39: North America Market Y-o-Y Growth (%) Projections by Country, 2024 to 2034
Figure 40: North America Market Value (US$ billion) Analysis by Product Type, 2019 to 2034
Figure 41: North America Market Volume (MT) Analysis by Product Type, 2019 to 2034
Figure 42: North America Market Value Share (%) and BPS Analysis by Product Type, 2024 to 2034
Figure 43: North America Market Y-o-Y Growth (%) Projections by Product Type, 2024 to 2034
Figure 44: North America Market Value (US$ billion) Analysis by Form, 2019 to 2034
Figure 45: North America Market Volume (MT) Analysis by Form, 2019 to 2034
Figure 46: North America Market Value Share (%) and BPS Analysis by Form, 2024 to 2034
Figure 47: North America Market Y-o-Y Growth (%) Projections by Form, 2024 to 2034
Figure 48: North America Market Value (US$ billion) Analysis by Function, 2019 to 2034
Figure 49: North America Market Volume (MT) Analysis by Function, 2019 to 2034
Figure 50: North America Market Value Share (%) and BPS Analysis by Function, 2024 to 2034
Figure 51: North America Market Y-o-Y Growth (%) Projections by Function, 2024 to 2034
Figure 52: North America Market Value (US$ billion) Analysis by Silage Crop, 2019 to 2034
Figure 53: North America Market Volume (MT) Analysis by Silage Crop, 2019 to 2034
Figure 54: North America Market Value Share (%) and BPS Analysis by Silage Crop, 2024 to 2034
Figure 55: North America Market Y-o-Y Growth (%) Projections by Silage Crop, 2024 to 2034
Figure 56: North America Market Attractiveness by Product Type, 2024 to 2034
Figure 57: North America Market Attractiveness by Form, 2024 to 2034
Figure 58: North America Market Attractiveness by Function, 2024 to 2034
Figure 59: North America Market Attractiveness by Silage Crop, 2024 to 2034
Figure 60: North America Market Attractiveness by Country, 2024 to 2034
Figure 61: Latin America Market Value (US$ billion) by Product Type, 2024 to 2034
Figure 62: Latin America Market Value (US$ billion) by Form, 2024 to 2034
Figure 63: Latin America Market Value (US$ billion) by Function, 2024 to 2034
Figure 64: Latin America Market Value (US$ billion) by Silage Crop, 2024 to 2034
Figure 65: Latin America Market Value (US$ billion) by Country, 2024 to 2034
Figure 66: Latin America Market Value (US$ billion) Analysis by Country, 2019 to 2034
Figure 67: Latin America Market Volume (MT) Analysis by Country, 2019 to 2034
Figure 68: Latin America Market Value Share (%) and BPS Analysis by Country, 2024 to 2034
Figure 69: Latin America Market Y-o-Y Growth (%) Projections by Country, 2024 to 2034
Figure 70: Latin America Market Value (US$ billion) Analysis by Product Type, 2019 to 2034
Figure 71: Latin America Market Volume (MT) Analysis by Product Type, 2019 to 2034
Figure 72: Latin America Market Value Share (%) and BPS Analysis by Product Type, 2024 to 2034
Figure 73: Latin America Market Y-o-Y Growth (%) Projections by Product Type, 2024 to 2034
Figure 74: Latin America Market Value (US$ billion) Analysis by Form, 2019 to 2034
Figure 75: Latin America Market Volume (MT) Analysis by Form, 2019 to 2034
Figure 76: Latin America Market Value Share (%) and BPS Analysis by Form, 2024 to 2034
Figure 77: Latin America Market Y-o-Y Growth (%) Projections by Form, 2024 to 2034
Figure 78: Latin America Market Value (US$ billion) Analysis by Function, 2019 to 2034
Figure 79: Latin America Market Volume (MT) Analysis by Function, 2019 to 2034
Figure 80: Latin America Market Value Share (%) and BPS Analysis by Function, 2024 to 2034
Figure 81: Latin America Market Y-o-Y Growth (%) Projections by Function, 2024 to 2034
Figure 82: Latin America Market Value (US$ billion) Analysis by Silage Crop, 2019 to 2034
Figure 83: Latin America Market Volume (MT) Analysis by Silage Crop, 2019 to 2034
Figure 84: Latin America Market Value Share (%) and BPS Analysis by Silage Crop, 2024 to 2034
Figure 85: Latin America Market Y-o-Y Growth (%) Projections by Silage Crop, 2024 to 2034
Figure 86: Latin America Market Attractiveness by Product Type, 2024 to 2034
Figure 87: Latin America Market Attractiveness by Form, 2024 to 2034
Figure 88: Latin America Market Attractiveness by Function, 2024 to 2034
Figure 89: Latin America Market Attractiveness by Silage Crop, 2024 to 2034
Figure 90: Latin America Market Attractiveness by Country, 2024 to 2034
Figure 91: Europe Market Value (US$ billion) by Product Type, 2024 to 2034
Figure 92: Europe Market Value (US$ billion) by Form, 2024 to 2034
Figure 93: Europe Market Value (US$ billion) by Function, 2024 to 2034
Figure 94: Europe Market Value (US$ billion) by Silage Crop, 2024 to 2034
Figure 95: Europe Market Value (US$ billion) by Country, 2024 to 2034
Figure 96: Europe Market Value (US$ billion) Analysis by Country, 2019 to 2034
Figure 97: Europe Market Volume (MT) Analysis by Country, 2019 to 2034
Figure 98: Europe Market Value Share (%) and BPS Analysis by Country, 2024 to 2034
Figure 99: Europe Market Y-o-Y Growth (%) Projections by Country, 2024 to 2034
Figure 100: Europe Market Value (US$ billion) Analysis by Product Type, 2019 to 2034
Figure 101: Europe Market Volume (MT) Analysis by Product Type, 2019 to 2034
Figure 102: Europe Market Value Share (%) and BPS Analysis by Product Type, 2024 to 2034
Figure 103: Europe Market Y-o-Y Growth (%) Projections by Product Type, 2024 to 2034
Figure 104: Europe Market Value (US$ billion) Analysis by Form, 2019 to 2034
Figure 105: Europe Market Volume (MT) Analysis by Form, 2019 to 2034
Figure 106: Europe Market Value Share (%) and BPS Analysis by Form, 2024 to 2034
Figure 107: Europe Market Y-o-Y Growth (%) Projections by Form, 2024 to 2034
Figure 108: Europe Market Value (US$ billion) Analysis by Function, 2019 to 2034
Figure 109: Europe Market Volume (MT) Analysis by Function, 2019 to 2034
Figure 110: Europe Market Value Share (%) and BPS Analysis by Function, 2024 to 2034
Figure 111: Europe Market Y-o-Y Growth (%) Projections by Function, 2024 to 2034
Figure 112: Europe Market Value (US$ billion) Analysis by Silage Crop, 2019 to 2034
Figure 113: Europe Market Volume (MT) Analysis by Silage Crop, 2019 to 2034
Figure 114: Europe Market Value Share (%) and BPS Analysis by Silage Crop, 2024 to 2034
Figure 115: Europe Market Y-o-Y Growth (%) Projections by Silage Crop, 2024 to 2034
Figure 116: Europe Market Attractiveness by Product Type, 2024 to 2034
Figure 118: Europe Market Attractiveness by Form, 2024 to 2034
Figure 118: Europe Market Attractiveness by Function, 2024 to 2034
Figure 119: Europe Market Attractiveness by Silage Crop, 2024 to 2034
Figure 120: Europe Market Attractiveness by Country, 2024 to 2034
Figure 122: East Asia Market Value (US$ billion) by Product Type, 2024 to 2034
Figure 123: East Asia Market Value (US$ billion) by Form, 2024 to 2034
Figure 123: East Asia Market Value (US$ billion) by Function, 2024 to 2034
Figure 124: East Asia Market Value (US$ billion) by Silage Crop, 2024 to 2034
Figure 125: East Asia Market Value (US$ billion) by Country, 2024 to 2034
Figure 126: East Asia Market Value (US$ billion) Analysis by Country, 2019 to 2034
Figure 127: East Asia Market Volume (MT) Analysis by Country, 2019 to 2034
Figure 128: East Asia Market Value Share (%) and BPS Analysis by Country, 2024 to 2034
Figure 129: East Asia Market Y-o-Y Growth (%) Projections by Country, 2024 to 2034
Figure 130: East Asia Market Value (US$ billion) Analysis by Product Type, 2019 to 2034
Figure 131: East Asia Market Volume (MT) Analysis by Product Type, 2019 to 2034
Figure 133: East Asia Market Value Share (%) and BPS Analysis by Product Type, 2024 to 2034
Figure 133: East Asia Market Y-o-Y Growth (%) Projections by Product Type, 2024 to 2034
Figure 134: East Asia Market Value (US$ billion) Analysis by Form, 2019 to 2034
Figure 135: East Asia Market Volume (MT) Analysis by Form, 2019 to 2034
Figure 136: East Asia Market Value Share (%) and BPS Analysis by Form, 2024 to 2034
Figure 137: East Asia Market Y-o-Y Growth (%) Projections by Form, 2024 to 2034
Figure 138: East Asia Market Value (US$ billion) Analysis by Function, 2019 to 2034
Figure 139: East Asia Market Volume (MT) Analysis by Function, 2019 to 2034
Figure 140: East Asia Market Value Share (%) and BPS Analysis by Function, 2024 to 2034
Figure 141: East Asia Market Y-o-Y Growth (%) Projections by Function, 2024 to 2034
Figure 142: East Asia Market Value (US$ billion) Analysis by Silage Crop, 2019 to 2034
Figure 143: East Asia Market Volume (MT) Analysis by Silage Crop, 2019 to 2034
Figure 144: East Asia Market Value Share (%) and BPS Analysis by Silage Crop, 2024 to 2034
Figure 145: East Asia Market Y-o-Y Growth (%) Projections by Silage Crop, 2024 to 2034
Figure 146: East Asia Market Attractiveness by Product Type, 2024 to 2034
Figure 147: East Asia Market Attractiveness by Form, 2024 to 2034
Figure 148: East Asia Market Attractiveness by Function, 2024 to 2034
Figure 149: East Asia Market Attractiveness by Silage Crop, 2024 to 2034
Figure 150: East Asia Market Attractiveness by Country, 2024 to 2034
Figure 151: South Asia Market Value (US$ billion) by Product Type, 2024 to 2034
Figure 152: South Asia Market Value (US$ billion) by Form, 2024 to 2034
Figure 153: South Asia Market Value (US$ billion) by Function, 2024 to 2034
Figure 154: South Asia Market Value (US$ billion) by Silage Crop, 2024 to 2034
Figure 155: South Asia Market Value (US$ billion) by Country, 2024 to 2034
Figure 156: South Asia Market Value (US$ billion) Analysis by Country, 2019 to 2034
Figure 157: South Asia Market Volume (MT) Analysis by Country, 2019 to 2034
Figure 158: South Asia Market Value Share (%) and BPS Analysis by Country, 2024 to 2034
Figure 159: South Asia Market Y-o-Y Growth (%) Projections by Country, 2024 to 2034
Figure 160: South Asia Market Value (US$ billion) Analysis by Product Type, 2019 to 2034
Figure 161: South Asia Market Volume (MT) Analysis by Product Type, 2019 to 2034
Figure 162: South Asia Market Value Share (%) and BPS Analysis by Product Type, 2024 to 2034
Figure 163: South Asia Market Y-o-Y Growth (%) Projections by Product Type, 2024 to 2034
Figure 164: South Asia Market Value (US$ billion) Analysis by Form, 2019 to 2034
Figure 165: South Asia Market Volume (MT) Analysis by Form, 2019 to 2034
Figure 166: South Asia Market Value Share (%) and BPS Analysis by Form, 2024 to 2034
Figure 167: South Asia Market Y-o-Y Growth (%) Projections by Form, 2024 to 2034
Figure 168: South Asia Market Value (US$ billion) Analysis by Function, 2019 to 2034
Figure 169: South Asia Market Volume (MT) Analysis by Function, 2019 to 2034
Figure 180: South Asia Market Value Share (%) and BPS Analysis by Function, 2024 to 2034
Figure 181: South Asia Market Y-o-Y Growth (%) Projections by Function, 2024 to 2034
Figure 182: South Asia Market Value (US$ billion) Analysis by Silage Crop, 2019 to 2034
Figure 183: South Asia Market Volume (MT) Analysis by Silage Crop, 2019 to 2034
Figure 184: South Asia Market Value Share (%) and BPS Analysis by Silage Crop, 2024 to 2034
Figure 185: South Asia Market Y-o-Y Growth (%) Projections by Silage Crop, 2024 to 2034
Figure 186: South Asia Market Attractiveness by Product Type, 2024 to 2034
Figure 187: South Asia Market Attractiveness by Form, 2024 to 2034
Figure 188: South Asia Market Attractiveness by Function, 2024 to 2034
Figure 189: South Asia Market Attractiveness by Silage Crop, 2024 to 2034
Figure 180: South Asia Market Attractiveness by Country, 2024 to 2034
Figure 181: Oceania Market Value (US$ billion) by Product Type, 2024 to 2034
Figure 182: Oceania Market Value (US$ billion) by Form, 2024 to 2034
Figure 183: Oceania Market Value (US$ billion) by Function, 2024 to 2034
Figure 184: Oceania Market Value (US$ billion) by Silage Crop, 2024 to 2034
Figure 185: Oceania Market Value (US$ billion) by Country, 2024 to 2034
Figure 186: Oceania Market Value (US$ billion) Analysis by Country, 2019 to 2034
Figure 187: Oceania Market Volume (MT) Analysis by Country, 2019 to 2034
Figure 188: Oceania Market Value Share (%) and BPS Analysis by Country, 2024 to 2034
Figure 189: Oceania Market Y-o-Y Growth (%) Projections by Country, 2024 to 2034
Figure 190: Oceania Market Value (US$ billion) Analysis by Product Type, 2019 to 2034
Figure 191: Oceania Market Volume (MT) Analysis by Product Type, 2019 to 2034
Figure 192: Oceania Market Value Share (%) and BPS Analysis by Product Type, 2024 to 2034
Figure 193: Oceania Market Y-o-Y Growth (%) Projections by Product Type, 2024 to 2034
Figure 194: Oceania Market Value (US$ billion) Analysis by Form, 2019 to 2034
Figure 195: Oceania Market Volume (MT) Analysis by Form, 2019 to 2034
Figure 196: Oceania Market Value Share (%) and BPS Analysis by Form, 2024 to 2034
Figure 197: Oceania Market Y-o-Y Growth (%) Projections by Form, 2024 to 2034
Figure 198: Oceania Market Value (US$ billion) Analysis by Function, 2019 to 2034
Figure 199: Oceania Market Volume (MT) Analysis by Function, 2019 to 2034
Figure 200: Oceania Market Value Share (%) and BPS Analysis by Function, 2024 to 2034
Figure 201: Oceania Market Y-o-Y Growth (%) Projections by Function, 2024 to 2034
Figure 202: Oceania Market Value (US$ billion) Analysis by Silage Crop, 2019 to 2034
Figure 203: Oceania Market Volume (MT) Analysis by Silage Crop, 2019 to 2034
Figure 204: Oceania Market Value Share (%) and BPS Analysis by Silage Crop, 2024 to 2034
Figure 205: Oceania Market Y-o-Y Growth (%) Projections by Silage Crop, 2024 to 2034
Figure 206: Oceania Market Attractiveness by Product Type, 2024 to 2034
Figure 207: Oceania Market Attractiveness by Form, 2024 to 2034
Figure 208: Oceania Market Attractiveness by Function, 2024 to 2034
Figure 209: Oceania Market Attractiveness by Silage Crop, 2024 to 2034
Figure 220: Oceania Market Attractiveness by Country, 2024 to 2034
Figure 221: MEA Market Value (US$ billion) by Product Type, 2024 to 2034
Figure 222: MEA Market Value (US$ billion) by Form, 2024 to 2034
Figure 223: MEA Market Value (US$ billion) by Function, 2024 to 2034
Figure 224: MEA Market Value (US$ billion) by Silage Crop, 2024 to 2034
Figure 225: MEA Market Value (US$ billion) by Country, 2024 to 2034
Figure 226: MEA Market Value (US$ billion) Analysis by Country, 2019 to 2034
Figure 227: MEA Market Volume (MT) Analysis by Country, 2019 to 2034
Figure 228: MEA Market Value Share (%) and BPS Analysis by Country, 2024 to 2034
Figure 229: MEA Market Y-o-Y Growth (%) Projections by Country, 2024 to 2034
Figure 230: MEA Market Value (US$ billion) Analysis by Product Type, 2019 to 2034
Figure 231: MEA Market Volume (MT) Analysis by Product Type, 2019 to 2034
Figure 233: MEA Market Value Share (%) and BPS Analysis by Product Type, 2024 to 2034
Figure 233: MEA Market Y-o-Y Growth (%) Projections by Product Type, 2024 to 2034
Figure 234: MEA Market Value (US$ billion) Analysis by Form, 2019 to 2034
Figure 235: MEA Market Volume (MT) Analysis by Form, 2019 to 2034
Figure 236: MEA Market Value Share (%) and BPS Analysis by Form, 2024 to 2034
Figure 237: MEA Market Y-o-Y Growth (%) Projections by Form, 2024 to 2034
Figure 238: MEA Market Value (US$ billion) Analysis by Function, 2019 to 2034
Figure 239: MEA Market Volume (MT) Analysis by Function, 2019 to 2034
Figure 230: MEA Market Value Share (%) and BPS Analysis by Function, 2024 to 2034
Figure 231: MEA Market Y-o-Y Growth (%) Projections by Function, 2024 to 2034
Figure 233: MEA Market Value (US$ billion) Analysis by Silage Crop, 2019 to 2034
Figure 233: MEA Market Volume (MT) Analysis by Silage Crop, 2019 to 2034
Figure 234: MEA Market Value Share (%) and BPS Analysis by Silage Crop, 2024 to 2034
Figure 235: MEA Market Y-o-Y Growth (%) Projections by Silage Crop, 2024 to 2034
Figure 236: MEA Market Attractiveness by Product Type, 2024 to 2034
Figure 237: MEA Market Attractiveness by Form, 2024 to 2034
Figure 238: MEA Market Attractiveness by Function, 2024 to 2034
Figure 239: MEA Market Attractiveness by Silage Crop, 2024 to 2034
Figure 240: MEA Market Attractiveness by Country, 2024 to 2034
The silage additive market size is valued at USD 2,935.6 million in 2024.
The market is estimated to reach USD 4,902.9 million by 2034.
The market revenue is anticipated to increase at a CAGR of 5.4% from 2024 to 2034.
North America is expected to hold a leading market share of 31.8% by 2034.
BASF SE, Chr. Hansen Holding A/S, Biomin, Lallemand Inc., DuPont de Nemours, Inc., Kemin Shandong Baolai-Leela Bio-industrial Group, Schaumann Bioenergy GmbH, Micron Bio-Systems, Volac International Limited, Eastman and Chemorse are the few leading players operating in the market.
Explore Similar Insights
Thank you!
You will receive an email from our Business Development Manager. Please be sure to check your SPAM/JUNK folder too.