Image Recognition in Retail Market Size and Share Forecast Outlook 2025 to 2035

The Image Recognition in Retail Market is estimated to be valued at USD 3.5 billion in 2025 and is projected to reach USD 28.0 billion by 2035, registering a compound annual growth rate (CAGR) of 23.0% over the forecast period.
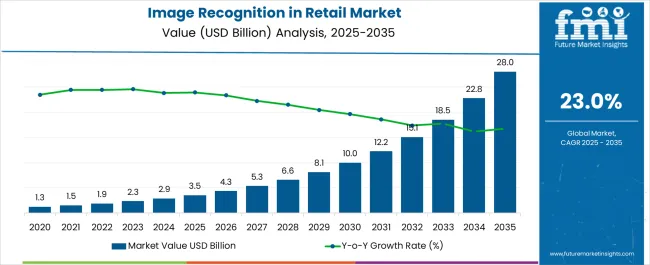
Quick Stats for Image Recognition in Retail Market

  • Image Recognition in Retail Market Industry Value (2025): USD 3.5 billion
  • Image Recognition in Retail Market Forecast Value (2035): USD 28.0 billion
  • Image Recognition in Retail Market Forecast CAGR: 23.0%
  • Leading Segment in Image Recognition in Retail Market in 2025: Hardware (47.6%)
  • Key Growth Region in Image Recognition in Retail Market: North America, Asia-Pacific, Europe
  • Top Key Players in Image Recognition in Retail Market: Qualcomm Technologies, Inc., NEC Corporation, Catchoom Technologies S.L., Hitachi, Ltd., Wikitude GmbH, Attrasoft, Inc., Trax Retail, Snap2Insight Inc., Apelsa Guadalajara

Image Recognition In Retail Market Market Value Analysis

Metric Value
Image Recognition in Retail Market Estimated Value in (2025 E) USD 3.5 billion
Image Recognition in Retail Market Forecast Value in (2035 F) USD 28.0 billion
Forecast CAGR (2025 to 2035) 23.0%

Rationale for Segmental Growth in the Image Recognition in Retail Market

The image recognition in retail market is expanding rapidly owing to the rising adoption of artificial intelligence and computer vision technologies that enhance operational efficiency and customer engagement. Retailers are increasingly deploying image recognition solutions to streamline inventory management, optimize checkout experiences, and strengthen loss prevention strategies.

Growing emphasis on personalized shopping journeys and data driven merchandising is fueling investments in hardware and software integrations. Additionally, the surge in omnichannel retailing and the need for seamless customer experiences are pushing retailers to adopt digital imaging technologies that ensure real time insights and accuracy.

The outlook remains promising as advancements in machine learning, cloud based analytics, and mobile commerce integration continue to support innovation and scalability in the retail ecosystem.

Segmental Analysis

Insights into the Hardware Component Segment

The hardware segment is projected to contribute 47.60% of overall market revenue by 2025, establishing itself as the leading component. This dominance is driven by the increasing demand for advanced cameras, sensors, and point of sale devices that support high quality image capture and processing.

Hardware enables reliable real time data collection, which is essential for applications such as automated checkout, shelf monitoring, and in store analytics. Retailers have been prioritizing hardware investments due to the need for robust infrastructure capable of handling high volumes of data with accuracy.

The ability of hardware to integrate seamlessly with AI powered platforms has further strengthened its adoption, ensuring consistent performance and cost efficiency.

Insights into the Digital Image Processing Technology Segment

Digital image processing is expected to represent 55.20% of total revenue by 2025 within the technology category, making it the dominant segment. Its leadership stems from its ability to deliver advanced image enhancement, feature extraction, and pattern recognition capabilities.

Retailers rely on this technology for accurate product identification, facial recognition based customer engagement, and security monitoring. The scalability and compatibility of digital image processing with cloud infrastructure and AI driven platforms have further accelerated its deployment.

This segment continues to gain traction as retailers emphasize accuracy, automation, and personalization in customer centric strategies.

Insights into the Scanning and Imaging Application Segment

The scanning and imaging application segment is anticipated to hold 42.90% of total market revenue by 2025, positioning it as the largest application. Growth is being propelled by the need for efficient barcode scanning, visual merchandising, and real time shelf management in retail environments.

Scanning and imaging technologies enable accurate tracking of stock keeping units, enhance inventory visibility, and support quick checkout solutions. Their contribution to reducing shrinkage, improving store operations, and creating a smoother customer experience has made them central to modern retail practices.

As digital transformation accelerates across global retail chains, this application segment is expected to retain its dominance through its operational impact and customer centric benefits.

Image Recognition in Retail Market: Drivers and Challenges

Drivers

Increasing use of image recognition applications such as scanning & imaging, security & surveillance, marketing & advertising, are fueling the growth of the image recognition in retail market. The growing need for improving the accuracy of the biometric authentication process, drives the image recognition in retail market growth.

Furthermore, the rising demand for big data analytics and the need for product brand recognition in retail sectors, are major factors expected to fuel the new growth opportunities in the market. Image recognition in retail offers different benefits such as auditing product placement, detecting trends in product placement, assessing compliance and competition, and category analysis.

The reliability of such benefits drives the Image recognition in retail market growth.

Challenges

However, the image recognition in retail market is also impacted significantly when the scanning process is not perfect due to poor lighting, blur, motion, or even physical problems.

Also, high cost of installation of image recognition systems, as well as technical issues regarding the compatibility with existing systems, are some of the factors challenging the growth of image recognition in retail market.
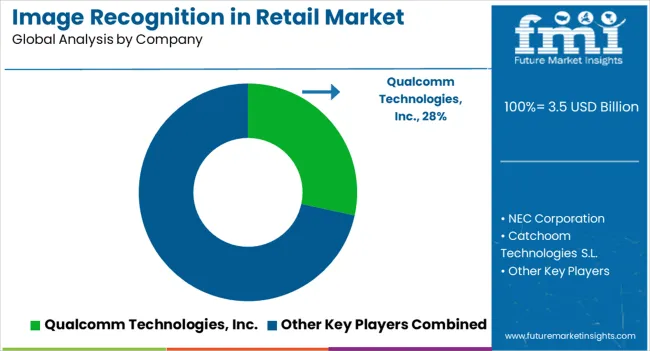
Image Recognition in Retail Market: Competition Landscape

Image Recognition In Retail Market Analysis By Company

Some of the prominent players providing image recognition solutions in retail are
  • Qualcomm Technologies, Inc.
  • NEC Corporation
  • Catchoom Technologies S.L.
  • Hitachi, Ltd.
  • Wikitude GmbH
  • Attrasoft, Inc.
  • Trax Retail
  • Snap2Insight Inc.

Image Recognition in Retail Market: Regional overview

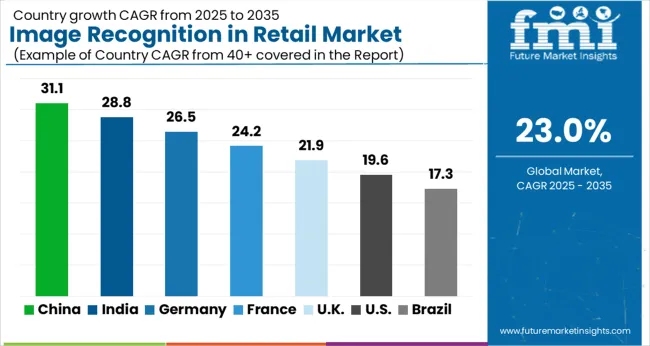
Image Recognition In Retail Market Cagr Analysis By Country

By geography, the image recognition in retail market has been segmented into North America, Europe, Latin America, East Asia, South Asia & Pacific, and Middle East & Africa. The market is currently dominated by Europe followed by North America, due to the advancements in image recognition technologies by the prominent vendors in these regions.

Moreover, Asia Pacific holds a comparatively higher market CAGR in the global image recognition in retail market, due to the growing advancements in the field of digital shopping and e-commerce, in this region.

The image recognition in retail market report is a compilation of first-hand information, qualitative and quantitative assessment by industry analysts, and inputs from industry experts and industry participants across the value chain.

The report provides in-depth analysis of parent market trends, macro-economic indicators, and governing factors, along with market attractiveness as per segment. The image recognition in retail market report also maps the qualitative impact of various market factors on market segments and geographies.

The report covers exhaustive analysis on

  • Image Recognition in Retail Market Segments
  • Image Recognition in Retail Market Dynamics
  • Image Recognition in Retail Market Size
  • Supply & Demand
  • Current Trends/Issues/Challenges
  • Competition & Companies Involved in the Market
  • Technology Landscape
  • Value Chain of the Market
  • Image Recognition in Retail Market Drivers and Restraints

Image Recognition in Retail Market: Segmentation

By Component:

  • Hardware
  • Software
  • Services

By Technology:

  • Digital Image Processing
  • Code Recognition
  • Optical Character Recognition
  • Object Recognition
  • Pattern Recognition

By Application:

  • Scanning & Imaging
  • Image Search
  • Security & Surveillance
  • Augmented Reality
  • Marketing & Advertising
  • Others

Table of Content

  1. Executive Summary
    • Global Market Outlook
    • Demand-side Trends
    • Supply-side Trends
    • Technology Roadmap Analysis
    • Analysis and Recommendations
  2. Market Overview
    • Market Coverage / Taxonomy
    • Market Definition / Scope / Limitations
  3. Market Background
    • Market Dynamics
      • Drivers
      • Restraints
      • Opportunity
      • Trends
    • Scenario Forecast
      • Demand in Optimistic Scenario
      • Demand in Likely Scenario
      • Demand in Conservative Scenario
    • Opportunity Map Analysis
    • Product Life Cycle Analysis
    • Supply Chain Analysis
    • Investment Feasibility Matrix
    • Value Chain Analysis
    • PESTLE and Porter’s Analysis
    • Regulatory Landscape
    • Regional Parent Market Outlook
    • Production and Consumption Statistics
    • Import and Export Statistics
  4. Global Market Analysis 2020 to 2024 and Forecast, 2025 to 2035
    • Historical Market Size Value (USD Million) Analysis, 2020 to 2024
    • Current and Future Market Size Value (USD Million) Projections, 2025 to 2035
      • Y-o-Y Growth Trend Analysis
      • Absolute $ Opportunity Analysis
  5. Global Market Pricing Analysis 2020 to 2024 and Forecast 2025 to 2035
  6. Global Market Analysis 2020 to 2024 and Forecast 2025 to 2035, By Component
    • Introduction / Key Findings
    • Historical Market Size Value (USD Million) Analysis By Component , 2020 to 2024
    • Current and Future Market Size Value (USD Million) Analysis and Forecast By Component , 2025 to 2035
      • Hardware
      • Software
      • Services
    • Y-o-Y Growth Trend Analysis By Component , 2020 to 2024
    • Absolute $ Opportunity Analysis By Component , 2025 to 2035
  7. Global Market Analysis 2020 to 2024 and Forecast 2025 to 2035, By Technology
    • Introduction / Key Findings
    • Historical Market Size Value (USD Million) Analysis By Technology, 2020 to 2024
    • Current and Future Market Size Value (USD Million) Analysis and Forecast By Technology, 2025 to 2035
      • Digital Image Processing
      • Code Recognition
      • Optical Character Recognition
      • Object Recognition
      • Pattern Recognition
    • Y-o-Y Growth Trend Analysis By Technology, 2020 to 2024
    • Absolute $ Opportunity Analysis By Technology, 2025 to 2035
  8. Global Market Analysis 2020 to 2024 and Forecast 2025 to 2035, By Application
    • Introduction / Key Findings
    • Historical Market Size Value (USD Million) Analysis By Application, 2020 to 2024
    • Current and Future Market Size Value (USD Million) Analysis and Forecast By Application, 2025 to 2035
      • Scanning & Imaging
      • Image Search
      • Security & Surveillance
      • Augmented Reality
      • Marketing & Advertising
      • Others
    • Y-o-Y Growth Trend Analysis By Application, 2020 to 2024
    • Absolute $ Opportunity Analysis By Application, 2025 to 2035
  9. Global Market Analysis 2020 to 2024 and Forecast 2025 to 2035, By Region
    • Introduction
    • Historical Market Size Value (USD Million) Analysis By Region, 2020 to 2024
    • Current Market Size Value (USD Million) Analysis and Forecast By Region, 2025 to 2035
      • North America
      • Latin America
      • Western Europe
      • Eastern Europe
      • East Asia
      • South Asia and Pacific
      • Middle East & Africa
    • Market Attractiveness Analysis By Region
  10. North America Market Analysis 2020 to 2024 and Forecast 2025 to 2035, By Country
    • Historical Market Size Value (USD Million) Trend Analysis By Market Taxonomy, 2020 to 2024
    • Market Size Value (USD Million) Forecast By Market Taxonomy, 2025 to 2035
      • By Country
        • USA
        • Canada
        • Mexico
      • By Component
      • By Technology
      • By Application
    • Market Attractiveness Analysis
      • By Country
      • By Component
      • By Technology
      • By Application
    • Key Takeaways
  11. Latin America Market Analysis 2020 to 2024 and Forecast 2025 to 2035, By Country
    • Historical Market Size Value (USD Million) Trend Analysis By Market Taxonomy, 2020 to 2024
    • Market Size Value (USD Million) Forecast By Market Taxonomy, 2025 to 2035
      • By Country
        • Brazil
        • Chile
        • Rest of Latin America
      • By Component
      • By Technology
      • By Application
    • Market Attractiveness Analysis
      • By Country
      • By Component
      • By Technology
      • By Application
    • Key Takeaways
  12. Western Europe Market Analysis 2020 to 2024 and Forecast 2025 to 2035, By Country
    • Historical Market Size Value (USD Million) Trend Analysis By Market Taxonomy, 2020 to 2024
    • Market Size Value (USD Million) Forecast By Market Taxonomy, 2025 to 2035
      • By Country
        • Germany
        • UK
        • Italy
        • Spain
        • France
        • Nordic
        • BENELUX
        • Rest of Western Europe
      • By Component
      • By Technology
      • By Application
    • Market Attractiveness Analysis
      • By Country
      • By Component
      • By Technology
      • By Application
    • Key Takeaways
  13. Eastern Europe Market Analysis 2020 to 2024 and Forecast 2025 to 2035, By Country
    • Historical Market Size Value (USD Million) Trend Analysis By Market Taxonomy, 2020 to 2024
    • Market Size Value (USD Million) Forecast By Market Taxonomy, 2025 to 2035
      • By Country
        • Russia
        • Poland
        • Hungary
        • Balkan & Baltic
        • Rest of Eastern Europe
      • By Component
      • By Technology
      • By Application
    • Market Attractiveness Analysis
      • By Country
      • By Component
      • By Technology
      • By Application
    • Key Takeaways
  14. East Asia Market Analysis 2020 to 2024 and Forecast 2025 to 2035, By Country
    • Historical Market Size Value (USD Million) Trend Analysis By Market Taxonomy, 2020 to 2024
    • Market Size Value (USD Million) Forecast By Market Taxonomy, 2025 to 2035
      • By Country
        • China
        • Japan
        • South Korea
      • By Component
      • By Technology
      • By Application
    • Market Attractiveness Analysis
      • By Country
      • By Component
      • By Technology
      • By Application
    • Key Takeaways
  15. South Asia and Pacific Market Analysis 2020 to 2024 and Forecast 2025 to 2035, By Country
    • Historical Market Size Value (USD Million) Trend Analysis By Market Taxonomy, 2020 to 2024
    • Market Size Value (USD Million) Forecast By Market Taxonomy, 2025 to 2035
      • By Country
        • India
        • ASEAN
        • Australia & New Zealand
        • Rest of South Asia and Pacific
      • By Component
      • By Technology
      • By Application
    • Market Attractiveness Analysis
      • By Country
      • By Component
      • By Technology
      • By Application
    • Key Takeaways
  16. Middle East & Africa Market Analysis 2020 to 2024 and Forecast 2025 to 2035, By Country
    • Historical Market Size Value (USD Million) Trend Analysis By Market Taxonomy, 2020 to 2024
    • Market Size Value (USD Million) Forecast By Market Taxonomy, 2025 to 2035
      • By Country
        • Kingdom of Saudi Arabia
        • Other GCC Countries
        • Turkiye
        • South Africa
        • Other African Union
        • Rest of Middle East & Africa
      • By Component
      • By Technology
      • By Application
    • Market Attractiveness Analysis
      • By Country
      • By Component
      • By Technology
      • By Application
    • Key Takeaways
  17. Key Countries Market Analysis
    • USA
      • Pricing Analysis
      • Market Share Analysis, 2024
        • By Component
        • By Technology
        • By Application
    • Canada
      • Pricing Analysis
      • Market Share Analysis, 2024
        • By Component
        • By Technology
        • By Application
    • Mexico
      • Pricing Analysis
      • Market Share Analysis, 2024
        • By Component
        • By Technology
        • By Application
    • Brazil
      • Pricing Analysis
      • Market Share Analysis, 2024
        • By Component
        • By Technology
        • By Application
    • Chile
      • Pricing Analysis
      • Market Share Analysis, 2024
        • By Component
        • By Technology
        • By Application
    • Germany
      • Pricing Analysis
      • Market Share Analysis, 2024
        • By Component
        • By Technology
        • By Application
    • UK
      • Pricing Analysis
      • Market Share Analysis, 2024
        • By Component
        • By Technology
        • By Application
    • Italy
      • Pricing Analysis
      • Market Share Analysis, 2024
        • By Component
        • By Technology
        • By Application
    • Spain
      • Pricing Analysis
      • Market Share Analysis, 2024
        • By Component
        • By Technology
        • By Application
    • France
      • Pricing Analysis
      • Market Share Analysis, 2024
        • By Component
        • By Technology
        • By Application
    • India
      • Pricing Analysis
      • Market Share Analysis, 2024
        • By Component
        • By Technology
        • By Application
    • ASEAN
      • Pricing Analysis
      • Market Share Analysis, 2024
        • By Component
        • By Technology
        • By Application
    • Australia & New Zealand
      • Pricing Analysis
      • Market Share Analysis, 2024
        • By Component
        • By Technology
        • By Application
    • China
      • Pricing Analysis
      • Market Share Analysis, 2024
        • By Component
        • By Technology
        • By Application
    • Japan
      • Pricing Analysis
      • Market Share Analysis, 2024
        • By Component
        • By Technology
        • By Application
    • South Korea
      • Pricing Analysis
      • Market Share Analysis, 2024
        • By Component
        • By Technology
        • By Application
    • Russia
      • Pricing Analysis
      • Market Share Analysis, 2024
        • By Component
        • By Technology
        • By Application
    • Poland
      • Pricing Analysis
      • Market Share Analysis, 2024
        • By Component
        • By Technology
        • By Application
    • Hungary
      • Pricing Analysis
      • Market Share Analysis, 2024
        • By Component
        • By Technology
        • By Application
    • Kingdom of Saudi Arabia
      • Pricing Analysis
      • Market Share Analysis, 2024
        • By Component
        • By Technology
        • By Application
    • Turkiye
      • Pricing Analysis
      • Market Share Analysis, 2024
        • By Component
        • By Technology
        • By Application
    • South Africa
      • Pricing Analysis
      • Market Share Analysis, 2024
        • By Component
        • By Technology
        • By Application
  18. Market Structure Analysis
    • Competition Dashboard
    • Competition Benchmarking
    • Market Share Analysis of Top Players
      • By Regional
      • By Component
      • By Technology
      • By Application
  19. Competition Analysis
    • Competition Deep Dive
      • Qualcomm Technologies, Inc.
        • Overview
        • Product Portfolio
        • Profitability by Market Segments (Product/Age /Sales Channel/Region)
        • Sales Footprint
        • Strategy Overview
          • Marketing Strategy
          • Product Strategy
          • Channel Strategy
      • NEC Corporation
      • Catchoom Technologies S.L.
      • Hitachi, Ltd.
      • Wikitude GmbH
      • Attrasoft, Inc.
      • Trax Retail
      • Snap2Insight Inc.
      • Apelsa Guadalajara
  20. Assumptions & Acronyms Used
  21. Research Methodology

List of Tables

  • Table 1: Global Market Value (USD Million) Forecast by Region, 2020-2035
  • Table 2: Global Market Value (USD Million) Forecast by Component , 2020-2035
  • Table 3: Global Market Value (USD Million) Forecast by Technology, 2020-2035
  • Table 4: Global Market Value (USD Million) Forecast by Application, 2020-2035
  • Table 5: North America Market Value (USD Million) Forecast by Country, 2020-2035
  • Table 6: North America Market Value (USD Million) Forecast by Component , 2020-2035
  • Table 7: North America Market Value (USD Million) Forecast by Technology, 2020-2035
  • Table 8: North America Market Value (USD Million) Forecast by Application, 2020-2035
  • Table 9: Latin America Market Value (USD Million) Forecast by Country, 2020-2035
  • Table 10: Latin America Market Value (USD Million) Forecast by Component , 2020-2035
  • Table 11: Latin America Market Value (USD Million) Forecast by Technology, 2020-2035
  • Table 12: Latin America Market Value (USD Million) Forecast by Application, 2020-2035
  • Table 13: Western Europe Market Value (USD Million) Forecast by Country, 2020-2035
  • Table 14: Western Europe Market Value (USD Million) Forecast by Component , 2020-2035
  • Table 15: Western Europe Market Value (USD Million) Forecast by Technology, 2020-2035
  • Table 16: Western Europe Market Value (USD Million) Forecast by Application, 2020-2035
  • Table 17: Eastern Europe Market Value (USD Million) Forecast by Country, 2020-2035
  • Table 18: Eastern Europe Market Value (USD Million) Forecast by Component , 2020-2035
  • Table 19: Eastern Europe Market Value (USD Million) Forecast by Technology, 2020-2035
  • Table 20: Eastern Europe Market Value (USD Million) Forecast by Application, 2020-2035
  • Table 21: East Asia Market Value (USD Million) Forecast by Country, 2020-2035
  • Table 22: East Asia Market Value (USD Million) Forecast by Component , 2020-2035
  • Table 23: East Asia Market Value (USD Million) Forecast by Technology, 2020-2035
  • Table 24: East Asia Market Value (USD Million) Forecast by Application, 2020-2035
  • Table 25: South Asia and Pacific Market Value (USD Million) Forecast by Country, 2020-2035
  • Table 26: South Asia and Pacific Market Value (USD Million) Forecast by Component , 2020-2035
  • Table 27: South Asia and Pacific Market Value (USD Million) Forecast by Technology, 2020-2035
  • Table 28: South Asia and Pacific Market Value (USD Million) Forecast by Application, 2020-2035
  • Table 29: Middle East & Africa Market Value (USD Million) Forecast by Country, 2020-2035
  • Table 30: Middle East & Africa Market Value (USD Million) Forecast by Component , 2020-2035
  • Table 31: Middle East & Africa Market Value (USD Million) Forecast by Technology, 2020-2035
  • Table 32: Middle East & Africa Market Value (USD Million) Forecast by Application, 2020-2035

List of Figures

  • Figure 1: Global Market Pricing Analysis
  • Figure 2: Global Market Value (USD Million) Forecast 2020-2035
  • Figure 3: Global Market Value (USD Million) Share and BPS Analysis by Region, 2025 and 2035
  • Figure 4: Global Market Y-o-Y Growth Comparison by Region, 2025-2035
  • Figure 5: Global Market Attractiveness Analysis by Region
  • Figure 6: North America Market Incremental Dollar Opportunity, 2025-2035
  • Figure 7: Latin America Market Incremental Dollar Opportunity, 2025-2035
  • Figure 8: Western Europe Market Incremental Dollar Opportunity, 2025-2035
  • Figure 9: Eastern Europe Market Incremental Dollar Opportunity, 2025-2035
  • Figure 10: East Asia Market Incremental Dollar Opportunity, 2025-2035
  • Figure 11: South Asia and Pacific Market Incremental Dollar Opportunity, 2025-2035
  • Figure 12: Middle East & Africa Market Incremental Dollar Opportunity, 2025-2035
  • Figure 13: North America Market Value Share and BPS Analysis by Country, 2025 and 2035
  • Figure 14: Latin America Market Value Share and BPS Analysis by Country, 2025 and 2035
  • Figure 15: Western Europe Market Value Share and BPS Analysis by Country, 2025 and 2035
  • Figure 16: Eastern Europe Market Value Share and BPS Analysis by Country, 2025 and 2035
  • Figure 17: East Asia Market Value Share and BPS Analysis by Country, 2025 and 2035
  • Figure 18: South Asia and Pacific Market Value Share and BPS Analysis by Country, 2025 and 2035
  • Figure 19: Middle East & Africa Market Value Share and BPS Analysis by Country, 2025 and 2035
  • Figure 20: Global Market - Tier Structure Analysis
  • Figure 21: Global Market - Company Share Analysis

Frequently Asked Questions

How big is the image recognition in retail market in 2025?

The global image recognition in retail market is estimated to be valued at USD 3.5 billion in 2025.

What will be the size of image recognition in retail market in 2035?

The market size for the image recognition in retail market is projected to reach USD 28.0 billion by 2035.

How much will be the image recognition in retail market growth between 2025 and 2035?

The image recognition in retail market is expected to grow at a 23.0% CAGR between 2025 and 2035.

What are the key product types in the image recognition in retail market?

The key product types in image recognition in retail market are hardware, software and services.

Which technology segment to contribute significant share in the image recognition in retail market in 2025?

In terms of technology, digital image processing segment to command 55.2% share in the image recognition in retail market in 2025.

Explore Similar Insights

Future Market Insights

Image Recognition in Retail Market

Chat With

MaRIA

Hi There, I am MaRIA, Your Market Research Intelligence Assistant. How may I help you?