Reports

- Global Locations -

Headquarters

Future Market Insights, Inc.

Christiana Corporate, 200
Continental Drive, Suite 401,
Newark, Delaware - 19713,
United States

T: +1-845-579-5705

Americas

Future Market Insights, Inc.

616 Corporate Way, Suite 2-9018,
Valley Cottage, NY 10989, United States

T: +1-347-918-3531

MEA

Future Market Insights

1602-6 Jumeirah Bay X2 Tower, Plot No: JLT-PH2-X2A,
Jumeirah Lakes Towers, Dubai,
United Arab Emirates

Europe

Future Market Insights

3rd Floor, 207 Regent Street,
W1B 3HH London
United Kingdom

T: + 44 (0) 20 8123 9659
D: +44 (0) 20 3287 4268

Asia Pacific

Future Market Insights

IndiaLand Global Tech Park, Unit UG-1, Behind Grand HighStreet, Phase 1, Hinjawadi, MH, Pune – 411057, India

Facial Recognition Market Outlook (2023 to 2033)

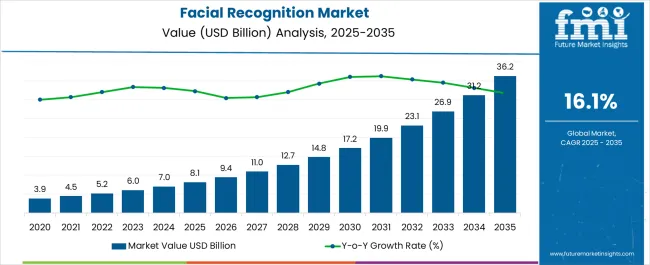
As per the latest research reports of FMI, the global facial recognition market is expected to be valued at US$ 5.7 billion in 2023. The market is expected to grow at a sturdy rate of 16.1% during the forecast period. By 2033, the valuation is expected to be at US$ 25.4 billion.

Key factors which might surge the market growth

  • Adoption of various means to provide safety and security.
  • Technological advancements, like the introduction of 3D recognition systems.

Increasing applications in physical security and intelligent signage are expected to drive the demand. The rise in demand can also be attributed to efforts to enhance safety and security. In addition, technological advancements such as cloud-based services and 3D-based recognition systems positively impact the growth of the market.

Increasing applications in mobile security and drones are expected to offer remunerative opportunities for the expansion of the facial recognition market size during the forecast period. Governments across the world have been investing a significant amount of their resources in the adoption of facial recognition technologies. The United States and China can be considered the leading adopters.

Facial recognition technologies have been deployed for homeland security by federal and regional law enforcement departments, and other security agencies. This has helped solve multiple criminal investigations, thereby facilitating various departments, which has helped in the rapid identification of offenders.

Facial recognition is indeed an area of biometrics where several technologies meet. Apart from airports and border checks, facial recognition applications are also used in retail facilities. Another market that’s growing is that of facial recognition software tools and solutions. However, the growth may vary in developed and emerging nations.

Given the ongoing threat of both physical and digital security breaches, the healthcare industry is investing in facial recognition technology to improve security and fraud prevention. Biometric technology is already being utilized in the health industry for anything from avoiding health insurance fraud to identifying illnesses.

Asia Pacific is expected to be the prominent region in the facial recognition market. This can be attributed to factors like technological development, rising infrastructure growth, and increasing application in multiple areas. Massive industrialization and the growing consumer electronics industry in the region highlight exciting opportunities for the players in the market.

With an increasing urban population and purchasing power, Asia Pacific is one of the dominant markets for consumer biometrics as well. Increasing mobile transactions for banking in countries such as India and China, coupled with their governments’ initiatives, are expected to be the major drivers for the facial recognition market in the region.

Attributes Value
Market Value (2022) US$ 5.2 billion
Market Expected Value (2023) US$ 5.7 billion
Market Forecast Value (2033) US$ 25.4 billion
Market Expected CAGR (2023 to 2033) 16.1%

Don't pay for what you don't need

Customize your report by selecting specific countries or regions and save 30%!

Comparing the Historical Outlook (2017 to 2022) with the Anticipated CAGR

With governments and private players investing in security, the demand for facial recognition systems is expected to surge during the forecast period. This coupled with the introduction of Artificial Intelligence and Machine Learning is expected to increase the efficiency of facial recognition systems. The defense ministries are investing in facial recognition systems, as these are utilized in unmanned vehicles to select the right target. With an increasing number of sectors adopting the facial recognition system, their sales are slated to rise in the future. This can be well explained by comparing the historical and anticipated CAGR. While the historical CAGR for the market was 10.9%, the anticipated CAGR has surged to 16.1%.

  • Short Term (2023 to 2026): This period might see an increase in the adoption of autonomous vehicles. These vehicles make use of facial recognition and sensors to enable driving. With the emphasis being laid on reducing carbon emissions, there might be surging demand for autonomous vehicles, which presents bright prospects for the facial recognition system.
  • Medium Term (2026 to 2029): With tensions between a lot of nations escalating, there might be an increase in the adoption of defense drones. In 2020, the world military spending was more than US$ 2 trillion, which is even more than the GDP of many nations. A considerable amount is spent on drones. Thus, the mammoth defense drone market is expected to surge the adoption of facial recognition systems.
  • Long Term (2029 to 2033): During this timeframe, we might see the healthcare sector grow and make use of facial recognition systems on a large scale. From access control to patient monitoring and diagnosis, the facial recognition system is expected to revolutionize the healthcare system.

What Factors Impede the Facial Recognition Market?

Facial recognition technology is used across industry verticals ranging from healthcare and retail to government and defense. Federal and police departments also use facial recognition technologies to catch suspected criminals in different cases. Even though the federal and police departments use this technology, the possibility of false matches poses a major problem.

For example, Boston's Logan Airport ran two separate facial recognition tests at its security checkpoints, using volunteers posing as terrorists over three months. Unfortunately, the results were disappointing. Throughout the testing period, the systems correctly identified the volunteers 153 times and failed to identify the volunteers 96 times. The high number of false alarms can result in the arrest of innocent people.

The arrest of innocent individuals could further lead to legal action against the concerned authorities. Hence, this also remains a major restraint in the implementation of facial recognition technology. Moreover, the lack of accuracy and high implementation cost of facial recognition technology hampers market growth.
Sudip Saha
Sudip Saha

Principal Consultant

Talk to Analyst

Find your sweet spots for generating winning opportunities in this market.

Comparative View of the Facial Recognition Market

Facial Recognition Market:

Attributes Facial Recognition Market
Anticipated CAGR (2023 to 2033) 16.1%
Market Value (2023) US$ 5.7 billion
Growth Factor Increasing technological advancements
Future Opportunities Adoption of IoT to increase the efficiency
Market Trends The system is largely adopted for enhancing defense capabilities

Biometrics Market:

Attributes Biometrics Market
Anticipated CAGR (2023 to 2033) 15.2%
Market Value (2023) US$ 9.1 billion
Growth Factor Surging terrorism and increase in theft activities
Future Opportunities The adoption of multi-model biometrics, which offers high precision
Market Trends Manufacturers working on hybrid biometric systems

Iris Recognition Market:

Attributes Iris Recognition Market
Anticipated CAGR (2023 to 2033) 13.2%
Market Value (2023) US$ 7.5 billion
Growth Factor Increased adoption in government organizations
Future Opportunities Surging adoption in the consumer electronics market
Market Trends Key players targeting the banking and finance sector

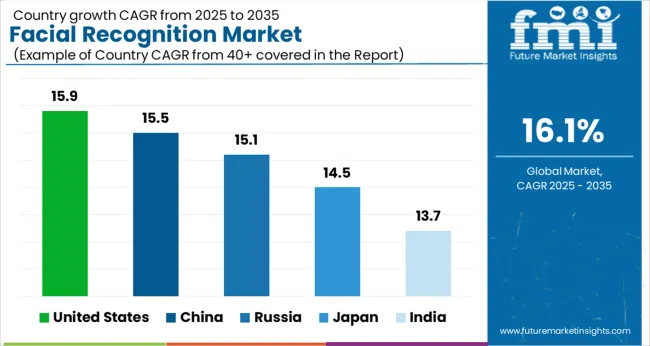
Country-wise Insights

Region North America
Country United States
CAGR (2023 to 2033) 15.9%
Region Asia Pacific
Country Russia
CAGR (2023 to 2033) 15.1%
Region Asia Pacific
Country China
CAGR (2023 to 2033) 15.5%
Region Asia Pacific
Country Japan
CAGR (2023 to 2033) 14.5%
Region Asia Pacific
Country India
CAGR (2023 to 2033) 13.7%

The United States Market to be Driven by Surging Citizen Services

The United States is one of the technologically advanced countries. Apart from various niche areas, the facial recognition system is being used for citizen services as well. For several services, from security to convenience, the facial recognition system is used to determine the characteristics of the individual. The availability of the required infrastructure may assist the functioning of citizen services.

Attributes Details
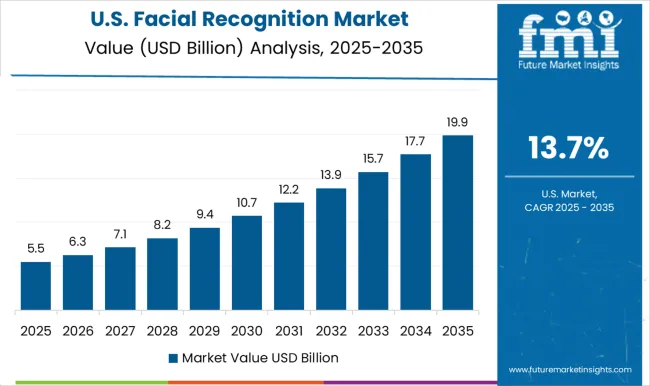
United States Market Expected Size (2033) US$ 6.3 billion
United States Market Absolute Dollar Growth (US$ million/billion) US$ 4.8 billion
CAGR % 2017 to 2022 10.5%

The adoption of a facial recognition system for the financial system is expected to revolutionize the payments landscape. This service is expected to be available in all the major ATMs across the United States.

Russia: Massive Military Budget to Drive the Sales

Russia currently ranks third in the world when it comes to defense capabilities. In 2023, Russia announced a defense budget of US$ 84 billion. At a time when Russia is confronting Ukraine and is expected to have similar confrontations with a lot of other Western countries, the amount is expected to surge. Owing to this, the Russia government is spending a huge amount on war drones. Not only local drones, but the Russia government is also buying drones from some countries, like Iran. The facial recognition system is an important aspect of these drones, as these assist in attacking the right target. These factors are expected to exponentially surge the sales of facial recognition systems.

Attributes Details
Russia Market Expected Size (2033) US$ 767.8 million
Russia Market Absolute Dollar Growth (US$ million/billion) US$ 580 million
CAGR % 2017 to 2022 9.5%

China: Expanding Autonomous Vehicles Market Promises a Lot to Deliver

The sales of autonomous vehicles are gradually gaining pace in China. By 2030, the autonomous vehicles market in China is expected to cross a valuation of US$ 100 billion. Surging technological advancements in the automobile sector and efforts to reduce carbon emissions are the driving factors. Autonomous vehicles make use of the facial recognition system to provide safety in case of car accidents.

Attributes Details
China Market Expected Size (2033) US$ 3.2 billion
China Market Absolute Dollar Growth (US$ million/billion) US$ 2.4 billion
CAGR % 2017 to 2022 10.1%

The Chinese hospitality sector is also making use of facial recognition technology to recognize guests and look up their reservations. These also assist in providing complimentary services to special guests.
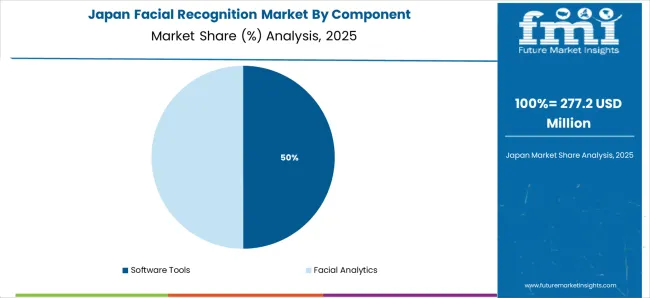
Japan: Healthcare Sector to Surge the Application of Facial Recognition System

Japan's healthcare sector is considered one of the most advanced and technologically upgraded. For example, the Japanese healthcare system uses facial recognition to facilitate security. It makes use of an automated way of scanning if somebody enters the room. Apart from that, it has also been assisting patients with fast check-in and check-out. As soon as the patient enters the hospital, the recognition system scans it against the available records. These are also used to clock the employee sign-in and sign-out timings.

Attributes Details
Japan Market Expected Size (2033) US$ 2.6 billion
Japan Market Absolute Dollar Growth (US$ million/billion) US$ 1.9 billion
CAGR % 2017 to 2022 9%

India: Burgeoning Banking Sector Presents Multiple Opportunities

Being one of the dominant economies in the world, the Indian banking sector has shown growth by leaps and bounds. With massive technological advancements, it is expected that the KYC norms can be filled merely through a facial recognition system. This is going to revolutionize the way banks work. Apart from that, the rapid penetration of mobile banking presents huge scope in front of the market.

Attributes Details
India Market Expected Size (2033) US$ 1.5 billion
India Market Absolute Dollar Growth (US$ million/billion) US$ 1.1 billion
CAGR % 2017 to 2022 7.7%

The country is also surrounded by adversaries. Thus, the facial recognition system is being used at border checkpoints, and through biometrics, the personnel can make out if the concerned person is a local or a trespasser.

Get the data you need at a Fraction of the cost

Personalize your report by choosing insights you need
and save 40%!

Segmentation Insights

Segment Component
Attributes Software Tools
CAGR % 2017 to 2022 10.6%
CAGR % 2023 to 2033 15.8%
Segment Vertical
Attributes Government and Defense
CAGR % 2017 to 2022 10.4%
CAGR % 2023 to 2033 15.6%

Which Component is expected to hold the Leading Share?

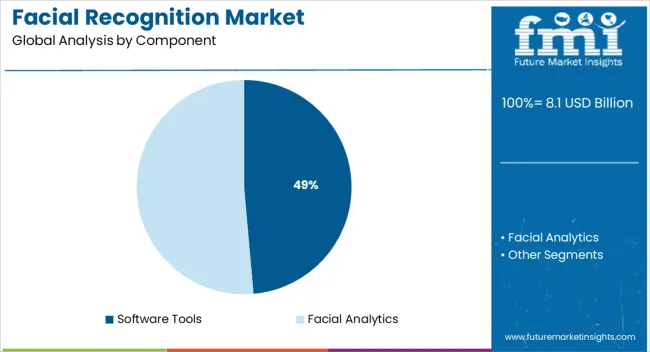
Software tools are expected to have the dominant market share. The software tools act as the interface between the hardware and the user, and provide a platform for analyzing the 2D/3D images. This solves the very purpose of understanding the image, and also makes use of various algorithms to derive a logical conclusion. Apart from that, by making use of various Machine Learning techniques in the software, the precision of these software tools increases. These occupy a high market share owing to high application in defense and healthcare.

Which Vertical is expected to hold the Higher Market Share?

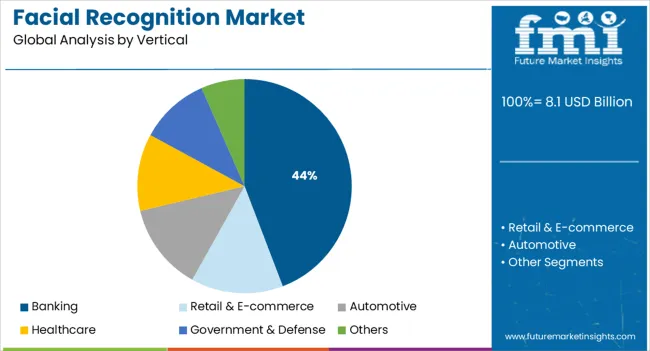
The government and defense segment is expected to hold the dominant share during the forecast period. This can be attributed to the high amounts being spent to upgrade military capabilities. Countries like China, the United States, etc. have been spending at least 10% of their GDP on upgrading their defense capabilities. Apart from that, facial recognition systems are also being used in government offices for surveillance and identity purposes. Moreover, a lot of government offices are making use of biometrics to keep a database of all the crucial information of their employees.

Start-ups Develop Deep Learning Based Image Analysis

The start-ups operating in the market have been developing platforms that offer computer vision technologies, which enable the applications to read and understand the world. This allows users to add deep learning-based image analysis recognition technologies with powerful Software Development Kits.

SenseTime: The start-up has been developing face recognition technology, which can be used for payment and picture analysis. These are used mainly for bank card verification and security systems. SenseTime is committed to advancing AI research, developing scalable AI software platforms, and nurturing top talents. SenseTime has raised a total of US$ 2.6 billion in funding over 10 rounds. Their latest funding was in December 2021 from a Post-IPO Equity round.

Key Players work on Trust Factor to Secure Key Information

The key players operating in the market are maintaining partnerships with key federal agencies worldwide to secure their crucial information. They are also providing biometrics solutions to a lot of federal agencies to maintain a secured database, and assist in employee recognition. In January 2023, Aware was the trusted security enabler to 12 out of 15 executive departments within the executive branch.

Key developments in the market:

  • In December 2022, Aware, Inc., was awarded the 2022 Cybersecurity Excellence award by INTERNET TELEPHONY magazine.

Dominant players in the market

Company Description
Aware Aware has been the leading provider of biometrics software products, solutions, and services to empower users to own and control their identities. The identity verification and management solution supports financial solutions, enterprise security, law enforcement, and surveillance. Aware has always capitalized on its biometric domain expertise to ensure that the company delights users through a customer experience that leverages the cloud and emphasizes the ease of doing business.
Cognitec Cognitec was founded in 2002 by a team of experts who recognized the growing demand for biometric software. The development of the products and growth of the company is built on the extensive knowledge of the scientists and software engineers. Cognitec has been into providing consulting services and excellent technical support as well. Cognitec employs a talented and dedicated team of experts in the areas of mathematics, software development, image processing, and pattern recognition technologies.
Fujitsu Fujitsu has been making use of technology to make happier lives. The company is a global leader in technology and business solutions that transform organizations and the world. By bringing together integration capabilities and cutting-edge technologies, the company has been successful in advancing toward creating a sustainable world. By focusing on computing, network, Artificial Intelligence, Data and Security, and converging technologies, the company ensures consistency across the portfolio.

Other companies profiled: Ayonix Corporation and FacePhi

Market Segmentation

By Component:

  • Software Tools
    • 2D Facial Recognition
    • 3D Facial Recognition
    • Facial Analytics
  • Facial Recognition Services
    • Training and Consulting
    • Cloud Based Facial Recognition

By Vertical:

  • Banking
  • Retail & E-commerce
  • Automotive
  • Healthcare
  • Government & Defense
  • Others

By Application:

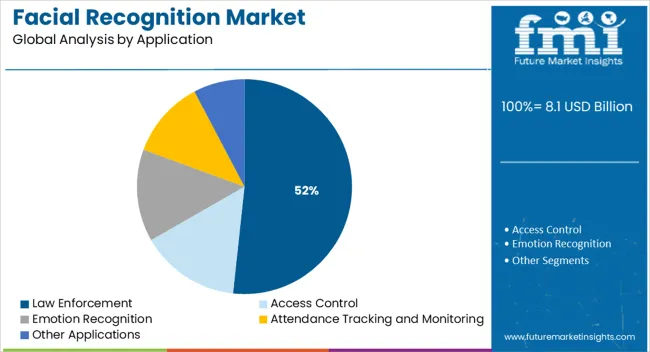
  • Law Enforcement
  • Access Control
  • Emotion Recognition
  • Attendance Tracking and Monitoring
  • Other Applications

By Region:

  • North America
  • Latin America
  • Asia Pacific
  • The Middle East and Africa
  • Europe

Frequently Asked Questions

What will the Expected Market Size by 2033?

The market is estimated to achieve US$ 25.4 billion by 2033.

What is the Market Growth Prediction?

The market is forecast to register a CAGR of 16.1% through 2033.

How Has the Market Evolved Over Time?

From 2018 to 2022, the global market exhibited 10.9% HCAGR.

How Big is the Facial Recognition Market Be in 2023?

The market to reach US$ 5.7 billion by end of 2023.

What May the United States Market CAGR By 2023?

The United States market to exhibit a CAGR of 15.9%.

What May the CAGR on the China market be in 2023?

China market is scheduled to expand at a CAGR of 15.5%.

Which Component Segment Tops the Market?

With a 15.8% CAGR through 2033, software tools segment may outshine the market.

Table of Content

1. Executive Summary | Facial Recognition Market

    1.1. Global Market Outlook

    1.2. Demand-side Trends

    1.3. Supply-side Trends

    1.4. Technology Roadmap Analysis

    1.5. Analysis and Recommendations

2. Market Overview

    2.1. Market Coverage / Taxonomy

    2.2. Market Definition / Scope / Limitations

3. Market Background

    3.1. Market Dynamics

        3.1.1. Drivers

        3.1.2. Restraints

        3.1.3. Opportunity

        3.1.4. Trends

    3.2. Scenario Forecast

        3.2.1. Demand in Optimistic Scenario

        3.2.2. Demand in Likely Scenario

        3.2.3. Demand in Conservative Scenario

    3.3. Opportunity Map Analysis

    3.4. Investment Feasibility Matrix

    3.5. PESTLE and Porter’s Analysis

    3.6. Regulatory Landscape

        3.6.1. By Key Regions

        3.6.2. By Key Countries

    3.7. Regional Parent Market Outlook

4. Global Market Analysis 2017 to 2022 and Forecast, 2023 to 2033

    4.1. Historical Market Size Value (US$ Million) Analysis, 2017 to 2022

    4.2. Current and Future Market Size Value (US$ Million) Projections, 2023 to 2033

        4.2.1. Y-o-Y Growth Trend Analysis

        4.2.2. Absolute $ Opportunity Analysis

5. Global Market Analysis 2017 to 2022 and Forecast 2023 to 2033, By Component

    5.1. Introduction / Key Findings

    5.2. Historical Market Size Value (US$ Million) Analysis By Component, 2017 to 2022

    5.3. Current and Future Market Size Value (US$ Million) Analysis and Forecast By Component, 2023 to 2033

        5.3.1. Software Tools

            5.3.1.1. 2D Facial Recognition

            5.3.1.2. 3D Facial Recognition

            5.3.1.3. Facial Analytics

        5.3.2. Services

            5.3.2.1. Training and Consulting Services

            5.3.2.2. Cloud Based Facial Recognition

    5.4. Y-o-Y Growth Trend Analysis By Component, 2017 to 2022

    5.5. Absolute $ Opportunity Analysis By Component, 2023 to 2033

6. Global Market Analysis 2017 to 2022 and Forecast 2023 to 2033, By Vertical

    6.1. Introduction / Key Findings

    6.2. Historical Market Size Value (US$ Million) Analysis By Vertical, 2017 to 2022

    6.3. Current and Future Market Size Value (US$ Million) Analysis and Forecast By Vertical, 2023 to 2033

        6.3.1. Banking

        6.3.2. Retail & E-Commerce

        6.3.3. Automotive

        6.3.4. Healthcare

        6.3.5. Government & Defence

        6.3.6. Others

    6.4. Y-o-Y Growth Trend Analysis By Vertical, 2017 to 2022

    6.5. Absolute $ Opportunity Analysis By Vertical, 2023 to 2033

7. Global Market Analysis 2017 to 2022 and Forecast 2023 to 2033, By Application

    7.1. Introduction / Key Findings

    7.2. Historical Market Size Value (US$ Million) Analysis By Application , 2017 to 2022

    7.3. Current and Future Market Size Value (US$ Million) Analysis and Forecast By Application , 2023 to 2033

        7.3.1. Law Enforcement

        7.3.2. Access Control

        7.3.3. Emotion Recognition

        7.3.4. Attendance Tracking and Monitoring

        7.3.5. Other Applications

    7.4. Y-o-Y Growth Trend Analysis By Application , 2017 to 2022

    7.5. Absolute $ Opportunity Analysis By Application , 2023 to 2033

8. Global Market Analysis 2017 to 2022 and Forecast 2023 to 2033, By Region

    8.1. Introduction

    8.2. Historical Market Size Value (US$ Million) Analysis By Region, 2017 to 2022

    8.3. Current Market Size Value (US$ Million) Analysis and Forecast By Region, 2023 to 2033

        8.3.1. North America

        8.3.2. Latin America

        8.3.3. Europe

        8.3.4. Asia Pacific

        8.3.5. Middle East and Africa

    8.4. Market Attractiveness Analysis By Region

9. North America Market Analysis 2017 to 2022 and Forecast 2023 to 2033, By Country

    9.1. Historical Market Size Value (US$ Million) Trend Analysis By Market Taxonomy, 2017 to 2022

    9.2. Market Size Value (US$ Million) Forecast By Market Taxonomy, 2023 to 2033

        9.2.1. By Country

            9.2.1.1.USA

            9.2.1.2. Canada

        9.2.2. By Component

        9.2.3. By Vertical

        9.2.4. By Application

    9.3. Market Attractiveness Analysis

        9.3.1. By Country

        9.3.2. By Component

        9.3.3. By Vertical

        9.3.4. By Application

    9.4. Key Takeaways

10. Latin America Market Analysis 2017 to 2022 and Forecast 2023 to 2033, By Country

    10.1. Historical Market Size Value (US$ Million) Trend Analysis By Market Taxonomy, 2017 to 2022

    10.2. Market Size Value (US$ Million) Forecast By Market Taxonomy, 2023 to 2033

        10.2.1. By Country

            10.2.1.1. Brazil

            10.2.1.2. Mexico

            10.2.1.3. Rest of Latin America

        10.2.2. By Component

        10.2.3. By Vertical

        10.2.4. By Application

    10.3. Market Attractiveness Analysis

        10.3.1. By Country

        10.3.2. By Component

        10.3.3. By Vertical

        10.3.4. By Application

    10.4. Key Takeaways

11. Europe Market Analysis 2017 to 2022 and Forecast 2023 to 2033, By Country

    11.1. Historical Market Size Value (US$ Million) Trend Analysis By Market Taxonomy, 2017 to 2022

    11.2. Market Size Value (US$ Million) Forecast By Market Taxonomy, 2023 to 2033

        11.2.1. By Country

            11.2.1.1. United kingdom

            11.2.1.2. Spain

            11.2.1.3. Germany

            11.2.1.4. Russia

            11.2.1.5. France

            11.2.1.6. Rest of Europe

        11.2.2. By Component

        11.2.3. By Vertical

        11.2.4. By Application

    11.3. Market Attractiveness Analysis

        11.3.1. By Country

        11.3.2. By Component

        11.3.3. By Vertical

        11.3.4. By Application

    11.4. Key Takeaways

12. Asia Pacific Market Analysis 2017 to 2022 and Forecast 2023 to 2033, By Country

    12.1. Historical Market Size Value (US$ Million) Trend Analysis By Market Taxonomy, 2017 to 2022

    12.2. Market Size Value (US$ Million) Forecast By Market Taxonomy, 2023 to 2033

        12.2.1. By Country

            12.2.1.1. India

            12.2.1.2. China

            12.2.1.3. Japan

            12.2.1.4. Australia

            12.2.1.5. Rest of Asia Pacific

        12.2.2. By Component

        12.2.3. By Vertical

        12.2.4. By Application

    12.3. Market Attractiveness Analysis

        12.3.1. By Country

        12.3.2. By Component

        12.3.3. By Vertical

        12.3.4. By Application

    12.4. Key Takeaways

13. Middle East and Africa Market Analysis 2017 to 2022 and Forecast 2023 to 2033, By Country

    13.1. Historical Market Size Value (US$ Million) Trend Analysis By Market Taxonomy, 2017 to 2022

    13.2. Market Size Value (US$ Million) Forecast By Market Taxonomy, 2023 to 2033

        13.2.1. By Country

            13.2.1.1. South Africa

            13.2.1.2. GCC Countries

            13.2.1.3. Rest of Middle East and Africa

        13.2.2. By Component

        13.2.3. By Vertical

        13.2.4. By Application

    13.3. Market Attractiveness Analysis

        13.3.1. By Country

        13.3.2. By Component

        13.3.3. By Vertical

        13.3.4. By Application

    13.4. Key Takeaways

14. Key Countries Market Analysis

    14.1.USA

        14.1.1. Pricing Analysis

        14.1.2. Market Share Analysis, 2022

            14.1.2.1. By Component

            14.1.2.2. By Vertical

            14.1.2.3. By Application

    14.2. Canada

        14.2.1. Pricing Analysis

        14.2.2. Market Share Analysis, 2022

            14.2.2.1. By Component

            14.2.2.2. By Vertical

            14.2.2.3. By Application

    14.3. Brazil

        14.3.1. Pricing Analysis

        14.3.2. Market Share Analysis, 2022

            14.3.2.1. By Component

            14.3.2.2. By Vertical

            14.3.2.3. By Application

    14.4. Mexico

        14.4.1. Pricing Analysis

        14.4.2. Market Share Analysis, 2022

            14.4.2.1. By Component

            14.4.2.2. By Vertical

            14.4.2.3. By Application

    14.5. United kingdom

        14.5.1. Pricing Analysis

        14.5.2. Market Share Analysis, 2022

            14.5.2.1. By Component

            14.5.2.2. By Vertical

            14.5.2.3. By Application

    14.6. Spain

        14.6.1. Pricing Analysis

        14.6.2. Market Share Analysis, 2022

            14.6.2.1. By Component

            14.6.2.2. By Vertical

            14.6.2.3. By Application

    14.7. Germany

        14.7.1. Pricing Analysis

        14.7.2. Market Share Analysis, 2022

            14.7.2.1. By Component

            14.7.2.2. By Vertical

            14.7.2.3. By Application

    14.8. Russia

        14.8.1. Pricing Analysis

        14.8.2. Market Share Analysis, 2022

            14.8.2.1. By Component

            14.8.2.2. By Vertical

            14.8.2.3. By Application

    14.9. France

        14.9.1. Pricing Analysis

        14.9.2. Market Share Analysis, 2022

            14.9.2.1. By Component

            14.9.2.2. By Vertical

            14.9.2.3. By Application

    14.10. India

        14.10.1. Pricing Analysis

        14.10.2. Market Share Analysis, 2022

            14.10.2.1. By Component

            14.10.2.2. By Vertical

            14.10.2.3. By Application

    14.11. China

        14.11.1. Pricing Analysis

        14.11.2. Market Share Analysis, 2022

            14.11.2.1. By Component

            14.11.2.2. By Vertical

            14.11.2.3. By Application

    14.12. Japan

        14.12.1. Pricing Analysis

        14.12.2. Market Share Analysis, 2022

            14.12.2.1. By Component

            14.12.2.2. By Vertical

            14.12.2.3. By Application

    14.13. Australia & New Zealand

        14.13.1. Pricing Analysis

        14.13.2. Market Share Analysis, 2022

            14.13.2.1. By Component

            14.13.2.2. By Vertical

            14.13.2.3. By Application

    14.14. South Africa

        14.14.1. Pricing Analysis

        14.14.2. Market Share Analysis, 2022

            14.14.2.1. By Component

            14.14.2.2. By Vertical

            14.14.2.3. By Application

    14.15. GCC Countries

        14.15.1. Pricing Analysis

        14.15.2. Market Share Analysis, 2022

            14.15.2.1. By Component

            14.15.2.2. By Vertical

            14.15.2.3. By Application

15. Market Structure Analysis

    15.1. Competition Dashboard

    15.2. Competition Benchmarking

    15.3. Market Share Analysis of Top Players

        15.3.1. By Regional

        15.3.2. By Component

        15.3.3. By Vertical

        15.3.4. By Application

16. Competition Analysis

    16.1. Competition Deep Dive

        16.1.1. Aware Inc.

            16.1.1.1. Overview

            16.1.1.2. Product Portfolio

            16.1.1.3. Profitability by Market Segments

            16.1.1.4. Sales Footprint

            16.1.1.5. Strategy Overview

                16.1.1.5.1. Marketing Strategy

        16.1.2. Ayonix Corporation

            16.1.2.1. Overview

            16.1.2.2. Product Portfolio

            16.1.2.3. Profitability by Market Segments

            16.1.2.4. Sales Footprint

            16.1.2.5. Strategy Overview

                16.1.2.5.1. Marketing Strategy

        16.1.3. Cognitec Systems GmbH

            16.1.3.1. Overview

            16.1.3.2. Product Portfolio

            16.1.3.3. Profitability by Market Segments

            16.1.3.4. Sales Footprint

            16.1.3.5. Strategy Overview

                16.1.3.5.1. Marketing Strategy

        16.1.4. FacePhi

            16.1.4.1. Overview

            16.1.4.2. Product Portfolio

            16.1.4.3. Profitability by Market Segments

            16.1.4.4. Sales Footprint

            16.1.4.5. Strategy Overview

                16.1.4.5.1. Marketing Strategy

        16.1.5. Fujitsu

            16.1.5.1. Overview

            16.1.5.2. Product Portfolio

            16.1.5.3. Profitability by Market Segments

            16.1.5.4. Sales Footprint

            16.1.5.5. Strategy Overview

                16.1.5.5.1. Marketing Strategy

        16.1.6. Gemalto NV

            16.1.6.1. Overview

            16.1.6.2. Product Portfolio

            16.1.6.3. Profitability by Market Segments

            16.1.6.4. Sales Footprint

            16.1.6.5. Strategy Overview

                16.1.6.5.1. Marketing Strategy

        16.1.7. IDEMIA

            16.1.7.1. Overview

            16.1.7.2. Product Portfolio

            16.1.7.3. Profitability by Market Segments

            16.1.7.4. Sales Footprint

            16.1.7.5. Strategy Overview

                16.1.7.5.1. Marketing Strategy

        16.1.8. NEC Corporation

            16.1.8.1. Overview

            16.1.8.2. Product Portfolio

            16.1.8.3. Profitability by Market Segments

            16.1.8.4. Sales Footprint

            16.1.8.5. Strategy Overview

                16.1.8.5.1. Marketing Strategy

        16.1.9. Onfido

            16.1.9.1. Overview

            16.1.9.2. Product Portfolio

            16.1.9.3. Profitability by Market Segments

            16.1.9.4. Sales Footprint

            16.1.9.5. Strategy Overview

                16.1.9.5.1. Marketing Strategy

        16.1.10. TECH5 SA

            16.1.10.1. Overview

            16.1.10.2. Product Portfolio

            16.1.10.3. Profitability by Market Segments

            16.1.10.4. Sales Footprint

            16.1.10.5. Strategy Overview

                16.1.10.5.1. Marketing Strategy

17. Assumptions & Acronyms Used

18. Research Methodology

List of Tables

Table 1: Global Market Value (US$ Million) Forecast by Region, 2017 to 2033

Table 2: Global Market Value (US$ Million) Forecast by Component, 2017 to 2033

Table 3: Global Market Value (US$ Million) Forecast by Vertical, 2017 to 2033

Table 4: Global Market Value (US$ Million) Forecast by Application , 2017 to 2033

Table 5: North America Market Value (US$ Million) Forecast by Country, 2017 to 2033

Table 6: North America Market Value (US$ Million) Forecast by Component, 2017 to 2033

Table 7: North America Market Value (US$ Million) Forecast by Vertical, 2017 to 2033

Table 8: North America Market Value (US$ Million) Forecast by Application , 2017 to 2033

Table 9: Latin America Market Value (US$ Million) Forecast by Country, 2017 to 2033

Table 10: Latin America Market Value (US$ Million) Forecast by Component, 2017 to 2033

Table 11: Latin America Market Value (US$ Million) Forecast by Vertical, 2017 to 2033

Table 12: Latin America Market Value (US$ Million) Forecast by Application , 2017 to 2033

Table 13: Europe Market Value (US$ Million) Forecast by Country, 2017 to 2033

Table 14: Europe Market Value (US$ Million) Forecast by Component, 2017 to 2033

Table 15: Europe Market Value (US$ Million) Forecast by Vertical, 2017 to 2033

Table 16: Europe Market Value (US$ Million) Forecast by Application , 2017 to 2033

Table 17: Asia Pacific Market Value (US$ Million) Forecast by Country, 2017 to 2033

Table 18: Asia Pacific Market Value (US$ Million) Forecast by Component, 2017 to 2033

Table 19: Asia Pacific Market Value (US$ Million) Forecast by Vertical, 2017 to 2033

Table 20: Asia Pacific Market Value (US$ Million) Forecast by Application , 2017 to 2033

Table 21: Middle East and Africa Market Value (US$ Million) Forecast by Country, 2017 to 2033

Table 22: Middle East and Africa Market Value (US$ Million) Forecast by Component, 2017 to 2033

Table 23: Middle East and Africa Market Value (US$ Million) Forecast by Vertical, 2017 to 2033

Table 24: Middle East and Africa Market Value (US$ Million) Forecast by Application , 2017 to 2033

List of Charts

Figure 1: Global Market Value (US$ Million) by Component, 2023 to 2033

Figure 2: Global Market Value (US$ Million) by Vertical, 2023 to 2033

Figure 3: Global Market Value (US$ Million) by Application , 2023 to 2033

Figure 4: Global Market Value (US$ Million) by Region, 2023 to 2033

Figure 5: Global Market Value (US$ Million) Analysis by Region, 2017 to 2033

Figure 6: Global Market Value Share (%) and BPS Analysis by Region, 2023 to 2033

Figure 7: Global Market Y-o-Y Growth (%) Projections by Region, 2023 to 2033

Figure 8: Global Market Value (US$ Million) Analysis by Component, 2017 to 2033

Figure 9: Global Market Value Share (%) and BPS Analysis by Component, 2023 to 2033

Figure 10: Global Market Y-o-Y Growth (%) Projections by Component, 2023 to 2033

Figure 11: Global Market Value (US$ Million) Analysis by Vertical, 2017 to 2033

Figure 12: Global Market Value Share (%) and BPS Analysis by Vertical, 2023 to 2033

Figure 13: Global Market Y-o-Y Growth (%) Projections by Vertical, 2023 to 2033

Figure 14: Global Market Value (US$ Million) Analysis by Application , 2017 to 2033

Figure 15: Global Market Value Share (%) and BPS Analysis by Application , 2023 to 2033

Figure 16: Global Market Y-o-Y Growth (%) Projections by Application , 2023 to 2033

Figure 17: Global Market Attractiveness by Component, 2023 to 2033

Figure 18: Global Market Attractiveness by Vertical, 2023 to 2033

Figure 19: Global Market Attractiveness by Application , 2023 to 2033

Figure 20: Global Market Attractiveness by Region, 2023 to 2033

Figure 21: North America Market Value (US$ Million) by Component, 2023 to 2033

Figure 22: North America Market Value (US$ Million) by Vertical, 2023 to 2033

Figure 23: North America Market Value (US$ Million) by Application , 2023 to 2033

Figure 24: North America Market Value (US$ Million) by Country, 2023 to 2033

Figure 25: North America Market Value (US$ Million) Analysis by Country, 2017 to 2033

Figure 26: North America Market Value Share (%) and BPS Analysis by Country, 2023 to 2033

Figure 27: North America Market Y-o-Y Growth (%) Projections by Country, 2023 to 2033

Figure 28: North America Market Value (US$ Million) Analysis by Component, 2017 to 2033

Figure 29: North America Market Value Share (%) and BPS Analysis by Component, 2023 to 2033

Figure 30: North America Market Y-o-Y Growth (%) Projections by Component, 2023 to 2033

Figure 31: North America Market Value (US$ Million) Analysis by Vertical, 2017 to 2033

Figure 32: North America Market Value Share (%) and BPS Analysis by Vertical, 2023 to 2033

Figure 33: North America Market Y-o-Y Growth (%) Projections by Vertical, 2023 to 2033

Figure 34: North America Market Value (US$ Million) Analysis by Application , 2017 to 2033

Figure 35: North America Market Value Share (%) and BPS Analysis by Application , 2023 to 2033

Figure 36: North America Market Y-o-Y Growth (%) Projections by Application , 2023 to 2033

Figure 37: North America Market Attractiveness by Component, 2023 to 2033

Figure 38: North America Market Attractiveness by Vertical, 2023 to 2033

Figure 39: North America Market Attractiveness by Application , 2023 to 2033

Figure 40: North America Market Attractiveness by Country, 2023 to 2033

Figure 41: Latin America Market Value (US$ Million) by Component, 2023 to 2033

Figure 42: Latin America Market Value (US$ Million) by Vertical, 2023 to 2033

Figure 43: Latin America Market Value (US$ Million) by Application , 2023 to 2033

Figure 44: Latin America Market Value (US$ Million) by Country, 2023 to 2033

Figure 45: Latin America Market Value (US$ Million) Analysis by Country, 2017 to 2033

Figure 46: Latin America Market Value Share (%) and BPS Analysis by Country, 2023 to 2033

Figure 47: Latin America Market Y-o-Y Growth (%) Projections by Country, 2023 to 2033

Figure 48: Latin America Market Value (US$ Million) Analysis by Component, 2017 to 2033

Figure 49: Latin America Market Value Share (%) and BPS Analysis by Component, 2023 to 2033

Figure 50: Latin America Market Y-o-Y Growth (%) Projections by Component, 2023 to 2033

Figure 51: Latin America Market Value (US$ Million) Analysis by Vertical, 2017 to 2033

Figure 52: Latin America Market Value Share (%) and BPS Analysis by Vertical, 2023 to 2033

Figure 53: Latin America Market Y-o-Y Growth (%) Projections by Vertical, 2023 to 2033

Figure 54: Latin America Market Value (US$ Million) Analysis by Application , 2017 to 2033

Figure 55: Latin America Market Value Share (%) and BPS Analysis by Application , 2023 to 2033

Figure 56: Latin America Market Y-o-Y Growth (%) Projections by Application , 2023 to 2033

Figure 57: Latin America Market Attractiveness by Component, 2023 to 2033

Figure 58: Latin America Market Attractiveness by Vertical, 2023 to 2033

Figure 59: Latin America Market Attractiveness by Application , 2023 to 2033

Figure 60: Latin America Market Attractiveness by Country, 2023 to 2033

Figure 61: Europe Market Value (US$ Million) by Component, 2023 to 2033

Figure 62: Europe Market Value (US$ Million) by Vertical, 2023 to 2033

Figure 63: Europe Market Value (US$ Million) by Application , 2023 to 2033

Figure 64: Europe Market Value (US$ Million) by Country, 2023 to 2033

Figure 65: Europe Market Value (US$ Million) Analysis by Country, 2017 to 2033

Figure 66: Europe Market Value Share (%) and BPS Analysis by Country, 2023 to 2033

Figure 67: Europe Market Y-o-Y Growth (%) Projections by Country, 2023 to 2033

Figure 68: Europe Market Value (US$ Million) Analysis by Component, 2017 to 2033

Figure 69: Europe Market Value Share (%) and BPS Analysis by Component, 2023 to 2033

Figure 70: Europe Market Y-o-Y Growth (%) Projections by Component, 2023 to 2033

Figure 71: Europe Market Value (US$ Million) Analysis by Vertical, 2017 to 2033

Figure 72: Europe Market Value Share (%) and BPS Analysis by Vertical, 2023 to 2033

Figure 73: Europe Market Y-o-Y Growth (%) Projections by Vertical, 2023 to 2033

Figure 74: Europe Market Value (US$ Million) Analysis by Application , 2017 to 2033

Figure 75: Europe Market Value Share (%) and BPS Analysis by Application , 2023 to 2033

Figure 76: Europe Market Y-o-Y Growth (%) Projections by Application , 2023 to 2033

Figure 77: Europe Market Attractiveness by Component, 2023 to 2033

Figure 78: Europe Market Attractiveness by Vertical, 2023 to 2033

Figure 79: Europe Market Attractiveness by Application , 2023 to 2033

Figure 80: Europe Market Attractiveness by Country, 2023 to 2033

Figure 81: Asia Pacific Market Value (US$ Million) by Component, 2023 to 2033

Figure 82: Asia Pacific Market Value (US$ Million) by Vertical, 2023 to 2033

Figure 83: Asia Pacific Market Value (US$ Million) by Application , 2023 to 2033

Figure 84: Asia Pacific Market Value (US$ Million) by Country, 2023 to 2033

Figure 85: Asia Pacific Market Value (US$ Million) Analysis by Country, 2017 to 2033

Figure 86: Asia Pacific Market Value Share (%) and BPS Analysis by Country, 2023 to 2033

Figure 87: Asia Pacific Market Y-o-Y Growth (%) Projections by Country, 2023 to 2033

Figure 88: Asia Pacific Market Value (US$ Million) Analysis by Component, 2017 to 2033

Figure 89: Asia Pacific Market Value Share (%) and BPS Analysis by Component, 2023 to 2033

Figure 90: Asia Pacific Market Y-o-Y Growth (%) Projections by Component, 2023 to 2033

Figure 91: Asia Pacific Market Value (US$ Million) Analysis by Vertical, 2017 to 2033

Figure 92: Asia Pacific Market Value Share (%) and BPS Analysis by Vertical, 2023 to 2033

Figure 93: Asia Pacific Market Y-o-Y Growth (%) Projections by Vertical, 2023 to 2033

Figure 94: Asia Pacific Market Value (US$ Million) Analysis by Application , 2017 to 2033

Figure 95: Asia Pacific Market Value Share (%) and BPS Analysis by Application , 2023 to 2033

Figure 96: Asia Pacific Market Y-o-Y Growth (%) Projections by Application , 2023 to 2033

Figure 97: Asia Pacific Market Attractiveness by Component, 2023 to 2033

Figure 98: Asia Pacific Market Attractiveness by Vertical, 2023 to 2033

Figure 99: Asia Pacific Market Attractiveness by Application , 2023 to 2033

Figure 100: Asia Pacific Market Attractiveness by Country, 2023 to 2033

Figure 101: Middle East and Africa Market Value (US$ Million) by Component, 2023 to 2033

Figure 102: Middle East and Africa Market Value (US$ Million) by Vertical, 2023 to 2033

Figure 103: Middle East and Africa Market Value (US$ Million) by Application , 2023 to 2033

Figure 104: Middle East and Africa Market Value (US$ Million) by Country, 2023 to 2033

Figure 105: Middle East and Africa Market Value (US$ Million) Analysis by Country, 2017 to 2033

Figure 106: Middle East and Africa Market Value Share (%) and BPS Analysis by Country, 2023 to 2033

Figure 107: Middle East and Africa Market Y-o-Y Growth (%) Projections by Country, 2023 to 2033

Figure 108: Middle East and Africa Market Value (US$ Million) Analysis by Component, 2017 to 2033

Figure 109: Middle East and Africa Market Value Share (%) and BPS Analysis by Component, 2023 to 2033

Figure 110: Middle East and Africa Market Y-o-Y Growth (%) Projections by Component, 2023 to 2033

Figure 111: Middle East and Africa Market Value (US$ Million) Analysis by Vertical, 2017 to 2033

Figure 112: Middle East and Africa Market Value Share (%) and BPS Analysis by Vertical, 2023 to 2033

Figure 113: Middle East and Africa Market Y-o-Y Growth (%) Projections by Vertical, 2023 to 2033

Figure 114: Middle East and Africa Market Value (US$ Million) Analysis by Application , 2017 to 2033

Figure 115: Middle East and Africa Market Value Share (%) and BPS Analysis by Application , 2023 to 2033

Figure 116: Middle East and Africa Market Y-o-Y Growth (%) Projections by Application , 2023 to 2033

Figure 117: Middle East and Africa Market Attractiveness by Component, 2023 to 2033

Figure 118: Middle East and Africa Market Attractiveness by Vertical, 2023 to 2033

Figure 119: Middle East and Africa Market Attractiveness by Application , 2023 to 2033

Figure 120: Middle East and Africa Market Attractiveness by Country, 2023 to 2033

Explore Technology Insights

View Reports

Facial Recognition Market