Facial Erythema Treatment Market
Key Players Look at Improving Cross-border Presence to Become a Global Brand for Facial Erythema Treatment. Here's More
Facial Erythema Treatment Market by Drug Type, Disease Type, Distribution Channel & Region | Forecast 2022 to 2032
Facial Erythema Treatment Market Outlook (2022 to 2032)
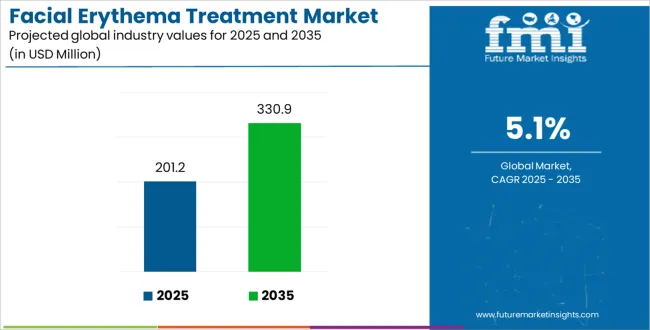
The global facial erythema treatment market is expected to be valued at US$ 299 million by 2032, up from US$ 173.3 million in 2022, growing at a 5.1% CAGR during the forecast period.
The growing patient population, large pipeline drugs, and other factors are likely to drive up demand for facial erythema treatment. However, strict government regulations governing drug product approvals are expected to stymie global market growth.
On the contrary, increasing Research and Development activities and advancements in drug products are projected to provide manufacturers with more opportunities.
Clinic applications are expected to grow significantly during the forecast period due to rising practitioner awareness of early detection and efficient treatments that do not require any kind of invasive procedures or surgeries. Patients with mild cases, or those who are uncomfortable visiting healthcare facilities for treatment, are more likely to prefer at-home care.
Attributes |
Details |
Facial Erythema Treatment Market Size (2022) |
US$ 173.3 Million |
Facial Erythema Treatment Market Size (2032) |
US$ 299 Million |
Facial Erythema Treatment Market CAGR |
5.1% |
Let us know your requirement to get
100% FREE customization
Demand for Minimally Invasive Procedures and Other Factors Likely to Drive the Facial Erythema Treatment Market
The steadily rising use of alcohol, cigarettes, and other narcotics may result in a variety of skin diseases. Furthermore, changing climatic conditions, the introduction of new products, and allergic reactions all contribute to skin abnormalities such as rosacea, which increases the use of facial erythema treatment.
The demand for minimally invasive procedures is increasing due to advantages such as shorter recovery time and less pain post-procedure. Furthermore, people are becoming increasingly aware of the various types of facial erythema treatment options available on the market. These are important factors that are expected to drive market growth.
People have a growing desire to improve their appearance, especially if they have skin conditions like perioral dermatitis, systemic illness, or rosacea. These, along with the need for skin cancer protection, are expected to significantly drive demand for facial erythema treatment.
Obstructions & Future Prospects of Facial Erythema Treatment Reshaping the Market
Certain medications used during the treatment of facial erythema may cause side effects. Antibiotics, for example, can cause bloating, abdominal pain, loss of appetite, and other side effects. This factor is likely to limit the use of this type of treatment.
In contrast, due to varying utilization demands, key manufacturers are primarily focusing on new product solutions for specific applications. During the forecast period, these factors are expected to generate creative opportunities for market share and increase demand for facial erythema treatment.
Find your sweet spots for generating winning opportunities in this market.
Talk to AnalystHow will the North America & Europe Facial Erythema Treatment Markets Grow?
North America is the most dominant facial erythema treatment market, accounting for 42% of total revenue. This is due to the majority of the population having fair skin and being prone to skin problems, resulting in the treatment's early adoption.
Climate changes, as well as population lifestyle changes, contribute to a variety of skin diseases. Furthermore, there has been an increase in skin treatment awareness in this region. These factors are likely to sustain the region's growing demand for facial erythema treatment and boost the global market growth.
The US government spends a lot of money on pharmaceuticals and medical devices every year, and they raise awareness in society. Furthermore, the business of the facial erythema treatment market is endorsed by the collaboration of multiple international companies with a slew of major hospital chains.
With revenue of 33.7%, Europe is the second-largest facial erythema treatment market. This is due to rising alcohol consumption and extensive research and development activities in the region.
Unveiling the Start-up Economy Contributing to the Facial Erythema Treatment Market Growth
Most cases of facial erythema, such as rosacea, have no known cause or treatment. It does, however, cause significant discomfort to those who suffer from these skin conditions. In many cases, it causes extreme embarrassment, anxiety, and depression. As a result, start-up companies are taking these issues into account and devising solutions to reduce their prevalence, fueling the growth of the facial erythema treatment market.
- Praxis Biotechnology
Dr. Wladis and Dr. Adam founded Praxis Biotechnology in response to a lack of rosacea treatment options. Praxis Biotechnology is based at Albany Medical College. Praxis Biotechnology was recently awarded $50,000 after winning FuzeHub's commercialization competition. This medication, according to the non-profit, could benefit millions of people.
- Legit Health
Legit Health is a Spanish start-up that offers a skin diagnostic tool. The startup's software employs artificial intelligence to classify 139 skin pathologies, with a focus on the detection of seven of these, including acne, rosacea, and dermatitis. The software's algorithms automatically fill in most medical grading systems for the seven skin conditions.
- Dermatica
The team at this UK start-up develops an evidence-based treatment and delivers it monthly. The web-based platform of the start-up assists patients in developing relationships with medical professionals and seeking expert assistance when necessary. The company also develops treatments for acne, facial erythema, anti-aging, pigmentation, and melasma.

A unified Market Research Subscription Platform, built for today's disparate research needs.
Competitive Landscape of Facial Erythema Treatment Transforming the Outlook of the Market
Due to the involvement of several established players, the market share for facial erythema treatment is highly competitive. These players are focusing on expanding their presence through acquisitions, expansions, product approvals, and launches in order to capitalize on market growth opportunities.
Latest Developments:
- Eucrisa (crisaborole) ointment was approved by the FDA in June 2016 to treat mild to moderate atopic dermatitis. It is an eczema treatment for patients aged two and up that was developed by Anacor Pharmaceuticals, which Pfizer purchased for $4.5 billion. The condition causes red, scaly, crusted bumps that are extremely itchy.
- Arcutis launched Zoryve in the United States in July 2022, shortly after acquiring plaque psoriasis. Arcutis revealed late-stage roflumilast foam data in seborrheic dermatitis, a chronic inflammatory skin disease in which the company is testing its drug in adults and children aged nine and up with the moderate-to-severe disease.
- Galderma S.A. received European Commission marketing authorization for its Mirvaso gel in February 2014.
Other Market Participants of the Facial Erythema Treatment Market:
- Novartis International AG
- Regeneron Pharmaceuticals Inc.
- Sanofi S.A.
- Valeant Pharmaceuticals International Inc.
- Bausch Health Companies Inc.
- GlaxoSmithKline plc
- Merck & Co. Inc.
- Enzon Pharmaceuticals
Report Scope
Report Attribute |
Details |
Growth Rate |
CAGR of 5.1% from 2022 to 2032 |
The base year for estimation |
2021 |
Historical data |
2015 to 2020 |
Forecast period |
2022 to 2032 |
Quantitative units |
Revenue in USD million, volume in kilotons, and CAGR from 2022 to 2032 |
Report Coverage |
Revenue forecast, volume forecast, company ranking, competitive landscape, growth factors, and trends, Pricing Analysis, |
Segments Covered |
Drug Type, Disease Type, Distribution Channel, and Region. |
Regional scope |
North America; Western Europe, Eastern Europe, Middle East, Africa, ASEAN, South Asia, Rest of Asia, Australia, and New Zealand |
Country scope |
United States of America; Canada; Mexico; Germany; United Kingdom; France; Italy; Spain; Russia; Belgium; Poland; Czech Republic; China; India; Japan; Australia; Brazil; Argentina; Colombia; Saudi Arabia; UAE; Iran; South Africa |
Key companies profiled |
Anacor Pharmaceuticals Inc., Astellas Pharma Inc., Galderma S.A., Meda Pharmaceuticals, Pfizer Inc., Novartis International AG, Regeneron Pharmaceuticals Inc., Sanofi S.A., Valeant Pharmaceuticals International Inc., Bausch Health Companies Inc., GlaxoSmithKline plc, Merck & Co. Inc., Enzon Pharmaceuticals, etc. |
Customization scope |
Free report customization (equivalent to up to 8 analysts' working days) with purchase. Addition or alteration to country, regional & segment scope. |
Pricing and purchase options |
Avail customized purchase options to meet your exact research needs. |
Key Segments Profiled in the Facial Erythema Treatment Market Survey
By Drug Type:
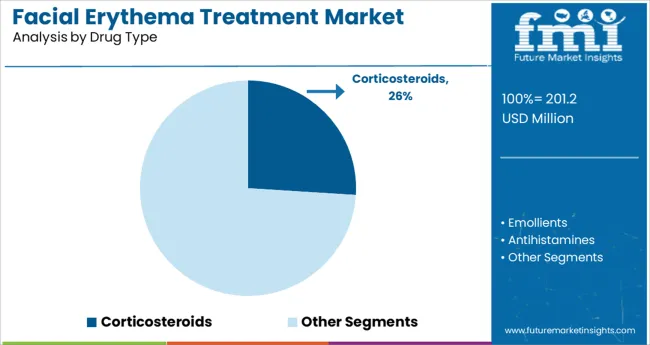
- Emollients
- Antihistamines
- Antifungal
- Antibiotics
- Corticosteroids
- Calcineurin Inhibitors
By Disease Type:
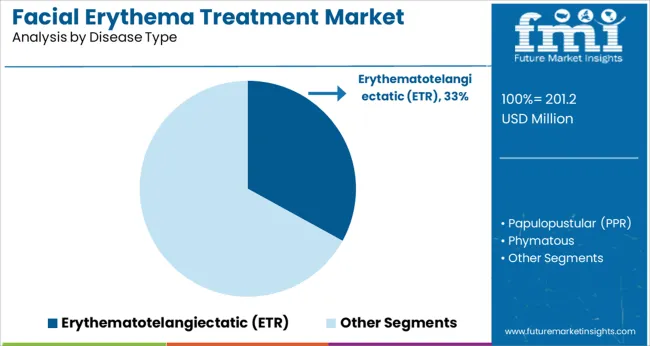
- Erythematotelangiectatic (ETR)
- Papulopustular (PPR)
- Phymatous
- Ocular
By Distribution Channel:
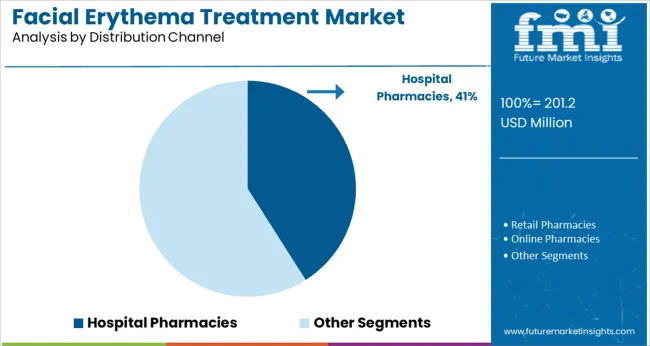
- Hospital Pharmacies
- Retail Pharmacies
- Online Pharmacies
By Region:
- North America
- Latin America
- Asia Pacific
- Middle East and Africa
- Europe
Frequently Asked Questions
How much CAGR can be approximated for the Facial Erythema Treatment Market?
The facial erythema treatment market is likely to accumulate a CAGR of 5.1%, during the forecast period.
What is the Leading Regional Market of Facial Erythema Treatment?
North America is the leading facial erythema treatment market with revenue of 42%.
What will be the Size of the Facial Erythema Treatment Market by 2032?
By 2032, the facial erythema treatment market is likely to grow to a valuation of US$ 299 Million.
Table of Content
1. Executive Summary | Facial Erythema Treatment Market 1.1. Global Market Outlook 1.2. Demand-side Trends 1.3. Supply-side Trends 1.4. Technology Roadmap Analysis 1.5. Analysis and Recommendations 2. Market Overview 2.1. Market Coverage / Taxonomy 2.2. Market Definition / Scope / Limitations 3. Market Background 3.1. Market Dynamics 3.1.1. Drivers 3.1.2. Restraints 3.1.3. Opportunity 3.1.4. Trends 3.2. Scenario Forecast 3.2.1. Demand in Optimistic Scenario 3.2.2. Demand in Likely Scenario 3.2.3. Demand in Conservative Scenario 3.3. Opportunity Map Analysis 3.4. Investment Feasibility Matrix 3.5. PESTLE and Porter’s Analysis 3.6. Regulatory Landscape 3.6.1. By Key Regions 3.6.2. By Key Countries 3.7. Regional Parent Market Outlook 4. Global Analysis 2017 to 2021 and Forecast, 2022 to 2032 4.1. Historical Market Size Value (US$ Million) Analysis, 2017 to 2021 4.2. Current and Future Market Size Value (US$ Million) Projections, 2022 to 2032 4.2.1. Y-o-Y Growth Trend Analysis 4.2.2. Absolute $ Opportunity Analysis 5. Global Analysis 2017 to 2021 and Forecast 2022 to 2032, By Drug Type 5.1. Introduction / Key Findings 5.2. Historical Market Size Value (US$ Million) Analysis By Drug Type, 2017 to 2021 5.3. Current and Future Market Size Value (US$ Million) Analysis and Forecast By Drug Type, 2022 to 2032 5.3.1. Emollients 5.3.2. Antihistamines 5.3.3. Antifungal 5.3.4. Antibiotics 5.3.5. Corticosteroids 5.3.6. Calcineurin inhibitors 5.4. Y-o-Y Growth Trend Analysis By Drug Type, 2017 to 2021 5.5. Absolute $ Opportunity Analysis By Drug Type, 2022 to 2032 6. Global Analysis 2017 to 2021 and Forecast 2022 to 2032, By Disease Type 6.1. Introduction / Key Findings 6.2. Historical Market Size Value (US$ Million) Analysis By Disease Type, 2017 to 2021 6.3. Current and Future Market Size Value (US$ Million) Analysis and Forecast By Disease Type, 2022 to 2032 6.3.1. Erythematotelangiectatic (ETR) 6.3.2. Papulopustular (PPR) 6.3.3. Phymatous 6.3.4. Ocular 6.4. Y-o-Y Growth Trend Analysis By Disease Type, 2017 to 2021 6.5. Absolute $ Opportunity Analysis By Disease Type, 2022 to 2032 7. Global Analysis 2017 to 2021 and Forecast 2022 to 2032, By Distribution Channel 7.1. Introduction / Key Findings 7.2. Historical Market Size Value (US$ Million) Analysis By Distribution Channel, 2017 to 2021 7.3. Current and Future Market Size Value (US$ Million) Analysis and Forecast By Distribution Channel, 2022 to 2032 7.3.1. Hospital Pharmacies 7.3.2. Retail Pharmacies 7.3.3. Online Pharmacies 7.3.4. Others 7.4. Y-o-Y Growth Trend Analysis By Distribution Channel, 2017 to 2021 7.5. Absolute $ Opportunity Analysis By Distribution Channel, 2022 to 2032 8. Global Analysis 2017 to 2021 and Forecast 2022 to 2032, By Region 8.1. Introduction 8.2. Historical Market Size Value (US$ Million) Analysis By Region, 2017 to 2021 8.3. Current Market Size Value (US$ Million) Analysis and Forecast By Region, 2022 to 2032 8.3.1. North America 8.3.2. Latin America 8.3.3. Europe 8.3.4. South Asia 8.3.5. East Asia 8.3.6. Oceania 8.3.7. Middle East and Africa 8.4. Market Attractiveness Analysis By Region 9. North America Analysis 2017 to 2021 and Forecast 2022 to 2032, By Country 9.1. Historical Market Size Value (US$ Million) Trend Analysis By Market Taxonomy, 2017 to 2021 9.2. Market Size Value (US$ Million) Forecast By Market Taxonomy, 2022 to 2032 9.2.1. By Country 9.2.1.1. United States of America 9.2.1.2. Canada 9.2.2. By Drug Type 9.2.3. By Disease Type 9.2.4. By Distribution Channel 9.3. Market Attractiveness Analysis 9.3.1. By Country 9.3.2. By Drug Type 9.3.3. By Disease Type 9.3.4. By Distribution Channel 9.4. Key Takeaways 10. Latin America Analysis 2017 to 2021 and Forecast 2022 to 2032, By Country 10.1. Historical Market Size Value (US$ Million) Trend Analysis By Market Taxonomy, 2017 to 2021 10.2. Market Size Value (US$ Million) Forecast By Market Taxonomy, 2022 to 2032 10.2.1. By Country 10.2.1.1. Brazil 10.2.1.2. Mexico 10.2.1.3. Rest of Latin America 10.2.2. By Drug Type 10.2.3. By Disease Type 10.2.4. By Distribution Channel 10.3. Market Attractiveness Analysis 10.3.1. By Country 10.3.2. By Drug Type 10.3.3. By Disease Type 10.3.4. By Distribution Channel 10.4. Key Takeaways 11. Europe Analysis 2017 to 2021 and Forecast 2022 to 2032, By Country 11.1. Historical Market Size Value (US$ Million) Trend Analysis By Market Taxonomy, 2017 to 2021 11.2. Market Size Value (US$ Million) Forecast By Market Taxonomy, 2022 to 2032 11.2.1. By Country 11.2.1.1. Germany 11.2.1.2. United Kingdom 11.2.1.3. France 11.2.1.4. Spain 11.2.1.5. Italy 11.2.1.6. Rest of Europe 11.2.2. By Drug Type 11.2.3. By Disease Type 11.2.4. By Distribution Channel 11.3. Market Attractiveness Analysis 11.3.1. By Country 11.3.2. By Drug Type 11.3.3. By Disease Type 11.3.4. By Distribution Channel 11.4. Key Takeaways 12. South Asia Analysis 2017 to 2021 and Forecast 2022 to 2032, By Country 12.1. Historical Market Size Value (US$ Million) Trend Analysis By Market Taxonomy, 2017 to 2021 12.2. Market Size Value (US$ Million) Forecast By Market Taxonomy, 2022 to 2032 12.2.1. By Country 12.2.1.1. India 12.2.1.2. Malaysia 12.2.1.3. Singapore 12.2.1.4. Thailand 12.2.1.5. Rest of South Asia 12.2.2. By Drug Type 12.2.3. By Disease Type 12.2.4. By Distribution Channel 12.3. Market Attractiveness Analysis 12.3.1. By Country 12.3.2. By Drug Type 12.3.3. By Disease Type 12.3.4. By Distribution Channel 12.4. Key Takeaways 13. East Asia Analysis 2017 to 2021 and Forecast 2022 to 2032, By Country 13.1. Historical Market Size Value (US$ Million) Trend Analysis By Market Taxonomy, 2017 to 2021 13.2. Market Size Value (US$ Million) Forecast By Market Taxonomy, 2022 to 2032 13.2.1. By Country 13.2.1.1. China 13.2.1.2. Japan 13.2.1.3. South Korea 13.2.2. By Drug Type 13.2.3. By Disease Type 13.2.4. By Distribution Channel 13.3. Market Attractiveness Analysis 13.3.1. By Country 13.3.2. By Drug Type 13.3.3. By Disease Type 13.3.4. By Distribution Channel 13.4. Key Takeaways 14. Oceania Analysis 2017 to 2021 and Forecast 2022 to 2032, By Country 14.1. Historical Market Size Value (US$ Million) Trend Analysis By Market Taxonomy, 2017 to 2021 14.2. Market Size Value (US$ Million) Forecast By Market Taxonomy, 2022 to 2032 14.2.1. By Country 14.2.1.1. Australia 14.2.1.2. New Zealand 14.2.2. By Drug Type 14.2.3. By Disease Type 14.2.4. By Distribution Channel 14.3. Market Attractiveness Analysis 14.3.1. By Country 14.3.2. By Drug Type 14.3.3. By Disease Type 14.3.4. By Distribution Channel 14.4. Key Takeaways 15. Middle East and Africa Analysis 2017 to 2021 and Forecast 2022 to 2032, By Country 15.1. Historical Market Size Value (US$ Million) Trend Analysis By Market Taxonomy, 2017 to 2021 15.2. Market Size Value (US$ Million) Forecast By Market Taxonomy, 2022 to 2032 15.2.1. By Country 15.2.1.1. GCC Countries 15.2.1.2. South Africa 15.2.1.3. Israel 15.2.1.4. Rest of Middle East and Africa 15.2.2. By Drug Type 15.2.3. By Disease Type 15.2.4. By Distribution Channel 15.3. Market Attractiveness Analysis 15.3.1. By Country 15.3.2. By Drug Type 15.3.3. By Disease Type 15.3.4. By Distribution Channel 15.4. Key Takeaways 16. Key Countries Analysis 16.1. United States of America 16.1.1. Pricing Analysis 16.1.2. Market Share Analysis, 2021 16.1.2.1. By Drug Type 16.1.2.2. By Disease Type 16.1.2.3. By Distribution Channel 16.2. Canada 16.2.1. Pricing Analysis 16.2.2. Market Share Analysis, 2021 16.2.2.1. By Drug Type 16.2.2.2. By Disease Type 16.2.2.3. By Distribution Channel 16.3. Brazil 16.3.1. Pricing Analysis 16.3.2. Market Share Analysis, 2021 16.3.2.1. By Drug Type 16.3.2.2. By Disease Type 16.3.2.3. By Distribution Channel 16.4. Mexico 16.4.1. Pricing Analysis 16.4.2. Market Share Analysis, 2021 16.4.2.1. By Drug Type 16.4.2.2. By Disease Type 16.4.2.3. By Distribution Channel 16.5. Germany 16.5.1. Pricing Analysis 16.5.2. Market Share Analysis, 2021 16.5.2.1. By Drug Type 16.5.2.2. By Disease Type 16.5.2.3. By Distribution Channel 16.6. United Kingdom 16.6.1. Pricing Analysis 16.6.2. Market Share Analysis, 2021 16.6.2.1. By Drug Type 16.6.2.2. By Disease Type 16.6.2.3. By Distribution Channel 16.7. France 16.7.1. Pricing Analysis 16.7.2. Market Share Analysis, 2021 16.7.2.1. By Drug Type 16.7.2.2. By Disease Type 16.7.2.3. By Distribution Channel 16.8. Spain 16.8.1. Pricing Analysis 16.8.2. Market Share Analysis, 2021 16.8.2.1. By Drug Type 16.8.2.2. By Disease Type 16.8.2.3. By Distribution Channel 16.9. Italy 16.9.1. Pricing Analysis 16.9.2. Market Share Analysis, 2021 16.9.2.1. By Drug Type 16.9.2.2. By Disease Type 16.9.2.3. By Distribution Channel 16.10. India 16.10.1. Pricing Analysis 16.10.2. Market Share Analysis, 2021 16.10.2.1. By Drug Type 16.10.2.2. By Disease Type 16.10.2.3. By Distribution Channel 16.11. Malaysia 16.11.1. Pricing Analysis 16.11.2. Market Share Analysis, 2021 16.11.2.1. By Drug Type 16.11.2.2. By Disease Type 16.11.2.3. By Distribution Channel 16.12. Singapore 16.12.1. Pricing Analysis 16.12.2. Market Share Analysis, 2021 16.12.2.1. By Drug Type 16.12.2.2. By Disease Type 16.12.2.3. By Distribution Channel 16.13. Thailand 16.13.1. Pricing Analysis 16.13.2. Market Share Analysis, 2021 16.13.2.1. By Drug Type 16.13.2.2. By Disease Type 16.13.2.3. By Distribution Channel 16.14. China 16.14.1. Pricing Analysis 16.14.2. Market Share Analysis, 2021 16.14.2.1. By Drug Type 16.14.2.2. By Disease Type 16.14.2.3. By Distribution Channel 16.15. Japan 16.15.1. Pricing Analysis 16.15.2. Market Share Analysis, 2021 16.15.2.1. By Drug Type 16.15.2.2. By Disease Type 16.15.2.3. By Distribution Channel 16.16. South Korea 16.16.1. Pricing Analysis 16.16.2. Market Share Analysis, 2021 16.16.2.1. By Drug Type 16.16.2.2. By Disease Type 16.16.2.3. By Distribution Channel 16.17. Australia 16.17.1. Pricing Analysis 16.17.2. Market Share Analysis, 2021 16.17.2.1. By Drug Type 16.17.2.2. By Disease Type 16.17.2.3. By Distribution Channel 16.18. New Zealand 16.18.1. Pricing Analysis 16.18.2. Market Share Analysis, 2021 16.18.2.1. By Drug Type 16.18.2.2. By Disease Type 16.18.2.3. By Distribution Channel 16.19. GCC Countries 16.19.1. Pricing Analysis 16.19.2. Market Share Analysis, 2021 16.19.2.1. By Drug Type 16.19.2.2. By Disease Type 16.19.2.3. By Distribution Channel 16.20. South Africa 16.20.1. Pricing Analysis 16.20.2. Market Share Analysis, 2021 16.20.2.1. By Drug Type 16.20.2.2. By Disease Type 16.20.2.3. By Distribution Channel 16.21. Israel 16.21.1. Pricing Analysis 16.21.2. Market Share Analysis, 2021 16.21.2.1. By Drug Type 16.21.2.2. By Disease Type 16.21.2.3. By Distribution Channel 17. Market Structure Analysis 17.1. Competition Dashboard 17.2. Competition Benchmarking 17.3. Market Share Analysis of Top Players 17.3.1. By Regional 17.3.2. By Drug Type 17.3.3. By Disease Type 17.3.4. By Distribution Channel 18. Competition Analysis 18.1. Competition Deep Dive 18.1.1. Anacor Pharmaceuticals Inc. 18.1.1.1. Overview 18.1.1.2. Product Portfolio 18.1.1.3. Profitability by Market Segments 18.1.1.4. Sales Footprint 18.1.1.5. Strategy Overview 18.1.1.5.1. Marketing Strategy 18.1.2. Astellas Pharma Inc. 18.1.2.1. Overview 18.1.2.2. Product Portfolio 18.1.2.3. Profitability by Market Segments 18.1.2.4. Sales Footprint 18.1.2.5. Strategy Overview 18.1.2.5.1. Marketing Strategy 18.1.3. Galderma S.A. 18.1.3.1. Overview 18.1.3.2. Product Portfolio 18.1.3.3. Profitability by Market Segments 18.1.3.4. Sales Footprint 18.1.3.5. Strategy Overview 18.1.3.5.1. Marketing Strategy 18.1.4. Meda Pharmaceuticals 18.1.4.1. Overview 18.1.4.2. Product Portfolio 18.1.4.3. Profitability by Market Segments 18.1.4.4. Sales Footprint 18.1.4.5. Strategy Overview 18.1.4.5.1. Marketing Strategy 18.1.5. Novartis International AG 18.1.5.1. Overview 18.1.5.2. Product Portfolio 18.1.5.3. Profitability by Market Segments 18.1.5.4. Sales Footprint 18.1.5.5. Strategy Overview 18.1.5.5.1. Marketing Strategy 18.1.6. Pfizer Inc. 18.1.6.1. Overview 18.1.6.2. Product Portfolio 18.1.6.3. Profitability by Market Segments 18.1.6.4. Sales Footprint 18.1.6.5. Strategy Overview 18.1.6.5.1. Marketing Strategy 18.1.7. Regeneron Pharmaceuticals Inc. 18.1.7.1. Overview 18.1.7.2. Product Portfolio 18.1.7.3. Profitability by Market Segments 18.1.7.4. Sales Footprint 18.1.7.5. Strategy Overview 18.1.7.5.1. Marketing Strategy 18.1.8. Sanofi S.A. 18.1.8.1. Overview 18.1.8.2. Product Portfolio 18.1.8.3. Profitability by Market Segments 18.1.8.4. Sales Footprint 18.1.8.5. Strategy Overview 18.1.8.5.1. Marketing Strategy 18.1.9. Valeant Pharmaceuticals International, Inc. 18.1.9.1. Overview 18.1.9.2. Product Portfolio 18.1.9.3. Profitability by Market Segments 18.1.9.4. Sales Footprint 18.1.9.5. Strategy Overview 18.1.9.5.1. Marketing Strategy 18.1.10. Merck and Co. Inc. 18.1.10.1. Overview 18.1.10.2. Product Portfolio 18.1.10.3. Profitability by Market Segments 18.1.10.4. Sales Footprint 18.1.10.5. Strategy Overview 18.1.10.5.1. Marketing Strategy 19. Assumptions & Acronyms Used 20. Research Methodology
Let us know your requirement to get
100% FREE customization
List of Tables
Table 1: Global (US$ Million) Forecast by Region, 2017 to 2032 Table 2: Global (US$ Million) Forecast by Drug Type, 2017 to 2032 Table 3: Global (US$ Million) Forecast by Disease Type, 2017 to 2032 Table 4: Global (US$ Million) Forecast by Distribution Channel, 2017 to 2032 Table 5: North America (US$ Million) Forecast by Country, 2017 to 2032 Table 6: North America (US$ Million) Forecast by Drug Type, 2017 to 2032 Table 7: North America (US$ Million) Forecast by Disease Type, 2017 to 2032 Table 8: North America (US$ Million) Forecast by Distribution Channel, 2017 to 2032 Table 9: Latin America (US$ Million) Forecast by Country, 2017 to 2032 Table 10: Latin America (US$ Million) Forecast by Drug Type, 2017 to 2032 Table 11: Latin America (US$ Million) Forecast by Disease Type, 2017 to 2032 Table 12: Latin America (US$ Million) Forecast by Distribution Channel, 2017 to 2032 Table 13: Europe (US$ Million) Forecast by Country, 2017 to 2032 Table 14: Europe (US$ Million) Forecast by Drug Type, 2017 to 2032 Table 15: Europe (US$ Million) Forecast by Disease Type, 2017 to 2032 Table 16: Europe (US$ Million) Forecast by Distribution Channel, 2017 to 2032 Table 17: South Asia (US$ Million) Forecast by Country, 2017 to 2032 Table 18: South Asia (US$ Million) Forecast by Drug Type, 2017 to 2032 Table 19: South Asia (US$ Million) Forecast by Disease Type, 2017 to 2032 Table 20: South Asia (US$ Million) Forecast by Distribution Channel, 2017 to 2032 Table 21: East Asia (US$ Million) Forecast by Country, 2017 to 2032 Table 22: East Asia (US$ Million) Forecast by Drug Type, 2017 to 2032 Table 23: East Asia (US$ Million) Forecast by Disease Type, 2017 to 2032 Table 24: East Asia (US$ Million) Forecast by Distribution Channel, 2017 to 2032 Table 25: Oceania (US$ Million) Forecast by Country, 2017 to 2032 Table 26: Oceania (US$ Million) Forecast by Drug Type, 2017 to 2032 Table 27: Oceania (US$ Million) Forecast by Disease Type, 2017 to 2032 Table 28: Oceania (US$ Million) Forecast by Distribution Channel, 2017 to 2032 Table 29: Middle East and Africa (US$ Million) Forecast by Country, 2017 to 2032 Table 30: Middle East and Africa (US$ Million) Forecast by Drug Type, 2017 to 2032 Table 31: Middle East and Africa (US$ Million) Forecast by Disease Type, 2017 to 2032 Table 32: Middle East and Africa (US$ Million) Forecast by Distribution Channel, 2017 to 2032
Find your sweet spots for generating winning opportunities in this market.
Talk to AnalystList of Charts
Figure 1: Global (US$ Million) by Drug Type, 2022 to 2032 Figure 2: Global (US$ Million) by Disease Type, 2022 to 2032 Figure 3: Global (US$ Million) by Distribution Channel, 2022 to 2032 Figure 4: Global (US$ Million) by Region, 2022 to 2032 Figure 5: Global (US$ Million) Analysis by Region, 2017 to 2032 Figure 6: Global Share (%) and BPS Analysis by Region, 2022 to 2032 Figure 7: Global Facial Erythema Treatment Market Y-o-Y Growth (%) Projections by Region, 2022 to 2032 Figure 8: Global (US$ Million) Analysis by Drug Type, 2017 to 2032 Figure 9: Global Share (%) and BPS Analysis by Drug Type, 2022 to 2032 Figure 10: Global Facial Erythema Treatment Market Y-o-Y Growth (%) Projections by Drug Type, 2022 to 2032 Figure 11: Global (US$ Million) Analysis by Disease Type, 2017 to 2032 Figure 12: Global Share (%) and BPS Analysis by Disease Type, 2022 to 2032 Figure 13: Global Facial Erythema Treatment Market Y-o-Y Growth (%) Projections by Disease Type, 2022 to 2032 Figure 14: Global (US$ Million) Analysis by Distribution Channel, 2017 to 2032 Figure 15: Global Share (%) and BPS Analysis by Distribution Channel, 2022 to 2032 Figure 16: Global Facial Erythema Treatment Market Y-o-Y Growth (%) Projections by Distribution Channel, 2022 to 2032 Figure 17: Global Facial Erythema Treatment Market Attractiveness by Drug Type, 2022 to 2032 Figure 18: Global Facial Erythema Treatment Market Attractiveness by Disease Type, 2022 to 2032 Figure 19: Global Facial Erythema Treatment Market Attractiveness by Distribution Channel, 2022 to 2032 Figure 20: Global Facial Erythema Treatment Market Attractiveness by Region, 2022 to 2032 Figure 21: North America (US$ Million) by Drug Type, 2022 to 2032 Figure 22: North America (US$ Million) by Disease Type, 2022 to 2032 Figure 23: North America (US$ Million) by Distribution Channel, 2022 to 2032 Figure 24: North America (US$ Million) by Country, 2022 to 2032 Figure 25: North America (US$ Million) Analysis by Country, 2017 to 2032 Figure 26: North America Share (%) and BPS Analysis by Country, 2022 to 2032 Figure 27: North America Facial Erythema Treatment Market Y-o-Y Growth (%) Projections by Country, 2022 to 2032 Figure 28: North America (US$ Million) Analysis by Drug Type, 2017 to 2032 Figure 29: North America Share (%) and BPS Analysis by Drug Type, 2022 to 2032 Figure 30: North America Facial Erythema Treatment Market Y-o-Y Growth (%) Projections by Drug Type, 2022 to 2032 Figure 31: North America (US$ Million) Analysis by Disease Type, 2017 to 2032 Figure 32: North America Share (%) and BPS Analysis by Disease Type, 2022 to 2032 Figure 33: North America Facial Erythema Treatment Market Y-o-Y Growth (%) Projections by Disease Type, 2022 to 2032 Figure 34: North America (US$ Million) Analysis by Distribution Channel, 2017 to 2032 Figure 35: North America Share (%) and BPS Analysis by Distribution Channel, 2022 to 2032 Figure 36: North America Facial Erythema Treatment Market Y-o-Y Growth (%) Projections by Distribution Channel, 2022 to 2032 Figure 37: North America Facial Erythema Treatment Market Attractiveness by Drug Type, 2022 to 2032 Figure 38: North America Facial Erythema Treatment Market Attractiveness by Disease Type, 2022 to 2032 Figure 39: North America Facial Erythema Treatment Market Attractiveness by Distribution Channel, 2022 to 2032 Figure 40: North America Facial Erythema Treatment Market Attractiveness by Country, 2022 to 2032 Figure 41: Latin America (US$ Million) by Drug Type, 2022 to 2032 Figure 42: Latin America (US$ Million) by Disease Type, 2022 to 2032 Figure 43: Latin America (US$ Million) by Distribution Channel, 2022 to 2032 Figure 44: Latin America (US$ Million) by Country, 2022 to 2032 Figure 45: Latin America (US$ Million) Analysis by Country, 2017 to 2032 Figure 46: Latin America Share (%) and BPS Analysis by Country, 2022 to 2032 Figure 47: Latin America Facial Erythema Treatment Market Y-o-Y Growth (%) Projections by Country, 2022 to 2032 Figure 48: Latin America (US$ Million) Analysis by Drug Type, 2017 to 2032 Figure 49: Latin America Share (%) and BPS Analysis by Drug Type, 2022 to 2032 Figure 50: Latin America Facial Erythema Treatment Market Y-o-Y Growth (%) Projections by Drug Type, 2022 to 2032 Figure 51: Latin America (US$ Million) Analysis by Disease Type, 2017 to 2032 Figure 52: Latin America Share (%) and BPS Analysis by Disease Type, 2022 to 2032 Figure 53: Latin America Facial Erythema Treatment Market Y-o-Y Growth (%) Projections by Disease Type, 2022 to 2032 Figure 54: Latin America (US$ Million) Analysis by Distribution Channel, 2017 to 2032 Figure 55: Latin America Share (%) and BPS Analysis by Distribution Channel, 2022 to 2032 Figure 56: Latin America Facial Erythema Treatment Market Y-o-Y Growth (%) Projections by Distribution Channel, 2022 to 2032 Figure 57: Latin America Facial Erythema Treatment Market Attractiveness by Drug Type, 2022 to 2032 Figure 58: Latin America Facial Erythema Treatment Market Attractiveness by Disease Type, 2022 to 2032 Figure 59: Latin America Facial Erythema Treatment Market Attractiveness by Distribution Channel, 2022 to 2032 Figure 60: Latin America Facial Erythema Treatment Market Attractiveness by Country, 2022 to 2032 Figure 61: Europe (US$ Million) by Drug Type, 2022 to 2032 Figure 62: Europe (US$ Million) by Disease Type, 2022 to 2032 Figure 63: Europe (US$ Million) by Distribution Channel, 2022 to 2032 Figure 64: Europe (US$ Million) by Country, 2022 to 2032 Figure 65: Europe (US$ Million) Analysis by Country, 2017 to 2032 Figure 66: Europe Share (%) and BPS Analysis by Country, 2022 to 2032 Figure 67: Europe Facial Erythema Treatment Market Y-o-Y Growth (%) Projections by Country, 2022 to 2032 Figure 68: Europe (US$ Million) Analysis by Drug Type, 2017 to 2032 Figure 69: Europe Share (%) and BPS Analysis by Drug Type, 2022 to 2032 Figure 70: Europe Facial Erythema Treatment Market Y-o-Y Growth (%) Projections by Drug Type, 2022 to 2032 Figure 71: Europe (US$ Million) Analysis by Disease Type, 2017 to 2032 Figure 72: Europe Share (%) and BPS Analysis by Disease Type, 2022 to 2032 Figure 73: Europe Facial Erythema Treatment Market Y-o-Y Growth (%) Projections by Disease Type, 2022 to 2032 Figure 74: Europe (US$ Million) Analysis by Distribution Channel, 2017 to 2032 Figure 75: Europe Share (%) and BPS Analysis by Distribution Channel, 2022 to 2032 Figure 76: Europe Facial Erythema Treatment Market Y-o-Y Growth (%) Projections by Distribution Channel, 2022 to 2032 Figure 77: Europe Facial Erythema Treatment Market Attractiveness by Drug Type, 2022 to 2032 Figure 78: Europe Facial Erythema Treatment Market Attractiveness by Disease Type, 2022 to 2032 Figure 79: Europe Facial Erythema Treatment Market Attractiveness by Distribution Channel, 2022 to 2032 Figure 80: Europe Facial Erythema Treatment Market Attractiveness by Country, 2022 to 2032 Figure 81: South Asia (US$ Million) by Drug Type, 2022 to 2032 Figure 82: South Asia (US$ Million) by Disease Type, 2022 to 2032 Figure 83: South Asia (US$ Million) by Distribution Channel, 2022 to 2032 Figure 84: South Asia (US$ Million) by Country, 2022 to 2032 Figure 85: South Asia (US$ Million) Analysis by Country, 2017 to 2032 Figure 86: South Asia Share (%) and BPS Analysis by Country, 2022 to 2032 Figure 87: South Asia Facial Erythema Treatment Market Y-o-Y Growth (%) Projections by Country, 2022 to 2032 Figure 88: South Asia (US$ Million) Analysis by Drug Type, 2017 to 2032 Figure 89: South Asia Share (%) and BPS Analysis by Drug Type, 2022 to 2032 Figure 90: South Asia Facial Erythema Treatment Market Y-o-Y Growth (%) Projections by Drug Type, 2022 to 2032 Figure 91: South Asia (US$ Million) Analysis by Disease Type, 2017 to 2032 Figure 92: South Asia Share (%) and BPS Analysis by Disease Type, 2022 to 2032 Figure 93: South Asia Facial Erythema Treatment Market Y-o-Y Growth (%) Projections by Disease Type, 2022 to 2032 Figure 94: South Asia (US$ Million) Analysis by Distribution Channel, 2017 to 2032 Figure 95: South Asia Share (%) and BPS Analysis by Distribution Channel, 2022 to 2032 Figure 96: South Asia Facial Erythema Treatment Market Y-o-Y Growth (%) Projections by Distribution Channel, 2022 to 2032 Figure 97: South Asia Facial Erythema Treatment Market Attractiveness by Drug Type, 2022 to 2032 Figure 98: South Asia Facial Erythema Treatment Market Attractiveness by Disease Type, 2022 to 2032 Figure 99: South Asia Facial Erythema Treatment Market Attractiveness by Distribution Channel, 2022 to 2032 Figure 100: South Asia Facial Erythema Treatment Market Attractiveness by Country, 2022 to 2032 Figure 101: East Asia (US$ Million) by Drug Type, 2022 to 2032 Figure 102: East Asia (US$ Million) by Disease Type, 2022 to 2032 Figure 103: East Asia (US$ Million) by Distribution Channel, 2022 to 2032 Figure 104: East Asia (US$ Million) by Country, 2022 to 2032 Figure 105: East Asia (US$ Million) Analysis by Country, 2017 to 2032 Figure 106: East Asia Share (%) and BPS Analysis by Country, 2022 to 2032 Figure 107: East Asia Facial Erythema Treatment Market Y-o-Y Growth (%) Projections by Country, 2022 to 2032 Figure 108: East Asia (US$ Million) Analysis by Drug Type, 2017 to 2032 Figure 109: East Asia Share (%) and BPS Analysis by Drug Type, 2022 to 2032 Figure 110: East Asia Facial Erythema Treatment Market Y-o-Y Growth (%) Projections by Drug Type, 2022 to 2032 Figure 111: East Asia (US$ Million) Analysis by Disease Type, 2017 to 2032 Figure 112: East Asia Share (%) and BPS Analysis by Disease Type, 2022 to 2032 Figure 113: East Asia Facial Erythema Treatment Market Y-o-Y Growth (%) Projections by Disease Type, 2022 to 2032 Figure 114: East Asia (US$ Million) Analysis by Distribution Channel, 2017 to 2032 Figure 115: East Asia Share (%) and BPS Analysis by Distribution Channel, 2022 to 2032 Figure 116: East Asia Facial Erythema Treatment Market Y-o-Y Growth (%) Projections by Distribution Channel, 2022 to 2032 Figure 117: East Asia Facial Erythema Treatment Market Attractiveness by Drug Type, 2022 to 2032 Figure 118: East Asia Facial Erythema Treatment Market Attractiveness by Disease Type, 2022 to 2032 Figure 119: East Asia Facial Erythema Treatment Market Attractiveness by Distribution Channel, 2022 to 2032 Figure 120: East Asia Facial Erythema Treatment Market Attractiveness by Country, 2022 to 2032 Figure 121: Oceania (US$ Million) by Drug Type, 2022 to 2032 Figure 122: Oceania (US$ Million) by Disease Type, 2022 to 2032 Figure 123: Oceania (US$ Million) by Distribution Channel, 2022 to 2032 Figure 124: Oceania (US$ Million) by Country, 2022 to 2032 Figure 125: Oceania (US$ Million) Analysis by Country, 2017 to 2032 Figure 126: Oceania Share (%) and BPS Analysis by Country, 2022 to 2032 Figure 127: Oceania Facial Erythema Treatment Market Y-o-Y Growth (%) Projections by Country, 2022 to 2032 Figure 128: Oceania (US$ Million) Analysis by Drug Type, 2017 to 2032 Figure 129: Oceania Share (%) and BPS Analysis by Drug Type, 2022 to 2032 Figure 130: Oceania Facial Erythema Treatment Market Y-o-Y Growth (%) Projections by Drug Type, 2022 to 2032 Figure 131: Oceania (US$ Million) Analysis by Disease Type, 2017 to 2032 Figure 132: Oceania Share (%) and BPS Analysis by Disease Type, 2022 to 2032 Figure 133: Oceania Facial Erythema Treatment Market Y-o-Y Growth (%) Projections by Disease Type, 2022 to 2032 Figure 134: Oceania (US$ Million) Analysis by Distribution Channel, 2017 to 2032 Figure 135: Oceania Share (%) and BPS Analysis by Distribution Channel, 2022 to 2032 Figure 136: Oceania Facial Erythema Treatment Market Y-o-Y Growth (%) Projections by Distribution Channel, 2022 to 2032 Figure 137: Oceania Facial Erythema Treatment Market Attractiveness by Drug Type, 2022 to 2032 Figure 138: Oceania Facial Erythema Treatment Market Attractiveness by Disease Type, 2022 to 2032 Figure 139: Oceania Facial Erythema Treatment Market Attractiveness by Distribution Channel, 2022 to 2032 Figure 140: Oceania Facial Erythema Treatment Market Attractiveness by Country, 2022 to 2032 Figure 141: Middle East and Africa (US$ Million) by Drug Type, 2022 to 2032 Figure 142: Middle East and Africa (US$ Million) by Disease Type, 2022 to 2032 Figure 143: Middle East and Africa (US$ Million) by Distribution Channel, 2022 to 2032 Figure 144: Middle East and Africa (US$ Million) by Country, 2022 to 2032 Figure 145: Middle East and Africa (US$ Million) Analysis by Country, 2017 to 2032 Figure 146: Middle East and Africa Share (%) and BPS Analysis by Country, 2022 to 2032 Figure 147: Middle East and Africa Facial Erythema Treatment Market Y-o-Y Growth (%) Projections by Country, 2022 to 2032 Figure 148: Middle East and Africa (US$ Million) Analysis by Drug Type, 2017 to 2032 Figure 149: Middle East and Africa Share (%) and BPS Analysis by Drug Type, 2022 to 2032 Figure 150: Middle East and Africa Facial Erythema Treatment Market Y-o-Y Growth (%) Projections by Drug Type, 2022 to 2032 Figure 151: Middle East and Africa (US$ Million) Analysis by Disease Type, 2017 to 2032 Figure 152: Middle East and Africa Share (%) and BPS Analysis by Disease Type, 2022 to 2032 Figure 153: Middle East and Africa Facial Erythema Treatment Market Y-o-Y Growth (%) Projections by Disease Type, 2022 to 2032 Figure 154: Middle East and Africa (US$ Million) Analysis by Distribution Channel, 2017 to 2032 Figure 155: Middle East and Africa Share (%) and BPS Analysis by Distribution Channel, 2022 to 2032 Figure 156: Middle East and Africa Facial Erythema Treatment Market Y-o-Y Growth (%) Projections by Distribution Channel, 2022 to 2032 Figure 157: Middle East and Africa Facial Erythema Treatment Market Attractiveness by Drug Type, 2022 to 2032 Figure 158: Middle East and Africa Facial Erythema Treatment Market Attractiveness by Disease Type, 2022 to 2032 Figure 159: Middle East and Africa Facial Erythema Treatment Market Attractiveness by Distribution Channel, 2022 to 2032 Figure 160: Middle East and Africa Facial Erythema Treatment Market Attractiveness by Country, 2022 to 2032
Need specific information?
Request CustomizationExplore Healthcare Insights
View Reports