Reports

- Global Locations -

Headquarters

Future Market Insights, Inc.

Christiana Corporate, 200
Continental Drive, Suite 401,
Newark, Delaware - 19713,
United States

T: +1-845-579-5705

Americas

Future Market Insights, Inc.

616 Corporate Way, Suite 2-9018,
Valley Cottage, NY 10989, United States

T: +1-347-918-3531

MEA

Future Market Insights

1602-6 Jumeirah Bay X2 Tower, Plot No: JLT-PH2-X2A,
Jumeirah Lakes Towers, Dubai,
United Arab Emirates

Europe

Future Market Insights

3rd Floor, 207 Regent Street,
W1B 3HH London
United Kingdom

T: + 44 (0) 20 8123 9659
D: +44 (0) 20 3287 4268

Asia Pacific

Future Market Insights

IndiaLand Global Tech Park, Unit UG-1, Behind Grand HighStreet, Phase 1, Hinjawadi, MH, Pune – 411057, India

Facial Serum Market Outlook from 2024 to 2034

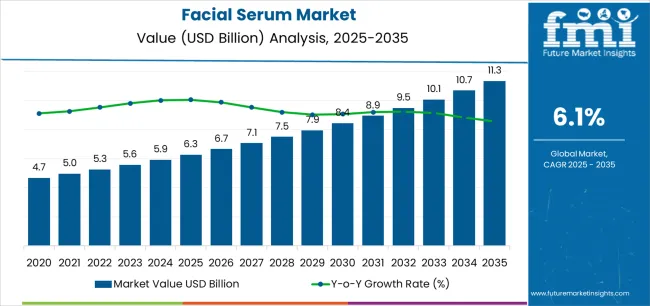
The global facial serum market is anticipated to total US$ 11 billion by 2034, estimated to gain a US$ 5.9 billion valuation by 2024. This progress will be at a moderate CAGR of 6.4%. This market growth creates lucrative opportunities for investing in facial serum brands.

Attributes Key Insights
Estimated Market Size in 2024 US$ 5.9 billion
Projected Market Value in 2034 US$ 11 billion
Value-based CAGR from 2024 to 2034 6.4%

Don't pay for what you don't need

Customize your report by selecting specific countries or regions and save 30%!

Key Facial Serum Industry Trends

  • Men’s skincare industry has been rising recently, which proves to be a key market trend for the facial serum market. Various masculine skincare and cosmetic brands, like Garnier, are emerging in the market, fueling the said market’s growth.
  • The rising consumer awareness regarding organic serums drives many key players to enter the market segment, creating multiple investment opportunities in organic facial serums. This enhances the cash flow in the industry.
  • Increasing customization in skincare products is a key market trend that propels the industry to deliver relevant products and services. Social media has fueled these demands through social media influencers. Thus, this is a key demand-side trend in the market.
  • Technological integration trends the industry as it leverages innovation in producing unique facial serums with organic components.

Thus, these key facial serum industry trends govern customer interest in various brands. Consequently, these trends influence facial serum market investment.

Demand Analysis of Facial Serum Market from 2019 to 2023 vs. Outlook from 2024 to 2034

The historical period projected the market advancement at a promising CAGR of 8.1%, elevating the facial serum market size from US$ 4 billion in 2019 to US$ 5.5 billion in 2023.

Strict imposition of lockdown was the primary market driver in the pandemic era. Consumers started looking for different opportunities to experiment to pass the time. Skincare was a method that leveraged pastime activities and skin health maintenance. Hence, the demand for facial serums surged, driving the subject market.

Encapsulation enabled customers to smoothen their skincare routine. Also, the technological integration enabled the market to reduce the time consumed to apply serums and wait for them to become effective. Consequently, this was a key market driver for the industry.

Historical CAGR from 2019 to 2023 8.1%
Forecast CAGR from 2024 to 2034 6.4%

The forecasted period registers the rising consumer awareness about men’s skincare. Due to this, many key players started playing an active role in this segment. This created lucrative chances for investments in the facial serum brands working in a new market segment. Hence, this is a primary demand generator for the period.

The rising concern about sustainability will likely drive the subject market. Customers prefer organic and sustainable compounds, redefining the market's progress path.

Sudip Saha
Sudip Saha

Principal Consultant

Talk to Analyst

Find your sweet spots for generating winning opportunities in this market.

Market Drivers

  • According to the demand-side trends of the facial serum market, it is seen that organic compounds and vegan products are more favored. This will likely be a primary market driver. Surging demand will shift the industry paradigm towards organic production, driving the subject market.
  • The market will be driven by increasing men’s skincare segment demand. This rising demand is accelerating the growth opportunity for the subject segment, forecasting to drive the market.
  • Technological integration will help the industry generate innovation in different market segments, fueling the industry's growth.
  • From the supply-side trends of the facial serum market, more emphasis is placed on ethical sourcing. This adheres to ethical practice and sustainability, so consumer demand drives the market.

Market Challenges

  • According to the risk assessment for facial serum product development, local players surpass the global marketers. This is because of their better knowledge of the local population. Due to this, they can customize the products, delivering better solutions to customers. This increases the threat of substitution, affecting the market growth.
  • Consumer sensitivity and allergies might be a risk associated with facial serum product development. This is due to difficulties faced in the standardized formulation of the product.

Get the data you need at a Fraction of the cost

Personalize your report by choosing insights you need
and save 40%!

Comparative View of Adjacent Markets

Future Market Insights analyses the facial serum industry trends alongside the adjacent markets, facial tissue and steamer markets.

Facial Serum Market:

Attributes Facial Serum Market
CAGR from 2024 to 2034 6.4%
Key Trends The increasing product customization as per consumers’ convenience and preference is a key market trend.
Growth Factor Consumers are inclined more towards organic and vegan products, which drives the production of sustainable products.

Facial Tissue Market:

Attributes Facial Tissue Market
CAGR from 2022 to 2032 3.2%
Key Trends The cosmetic industry and make-up as a profession are growing, which is a key market trend.
Growth Factor The growing applications of facial tissues support the progress of the subject industry.

Facial Steamer Market:

Attributes Facial Steamer Market
CAGR from 2024 to 2034 9.5%
Key Trends The growing consumer awareness about facial steaming is a key driving trend in the market.
Growth Factor The demand for organic skincare products is rising, surging the market under consideration.

Country-wise Analysis

North America is leading the global facial serum market. The main reason behind this is the growing consumer awareness regarding skincare treatments. Also, the market possesses great growth potential in the forecasted period.

Further, Europe contributes to the market along with the Asia-Pacific region due to the large-scale players investing in local facial serum brands.

Forecast CAGRs from 2024 to 2034

Countries Forecasted CAGR
The United States of America 6.7%
The United Kingdom 7.6%
China 7.2%
Japan 8.0%
South Korea 7.9%

Technological Innovation runs the Facial Serum Market in the United States of America

  • It is forecasted that the facial serum market will propel at a moderate CAGR of 6.7% through 2034.
  • The market size is forecasted to reach US$ 2 billion, the highest among all the other countries.
  • Technological upgradation leads to innovation in delivery systems, fueling the augmentation of facial serums, thereby enhancing the market’s growth potential.
  • Thus, the market players manufacturing innovative yet organic products increase, creating lucrative chances for growing investment opportunities in organic facial serum brands.

The United Kingdom is concerned about Ethical Consumerism, which creates the Growth Potential for the Facial Serum Market

  • It is anticipated that the United Kingdom’s market will leap at a CAGR of 7.6% through 2034, reaching US$ 0.44 billion.
  • Consumers have become aware of ethical practices in the subject market, encouraging suppliers and manufacturers to follow the same.
  • The supply-side trends of the facial serum market dictate that suppliers are fostering practices that contain ethical sourcing and procurement.
  • Therefore, vegan and organic serum products are in demand, creating more investment opportunities in organic facial serum brands.

Traditional Chinese Medicines Govern the Market Growth Potential, Pushing the Chinese Market

  • Chinese consumers foster traditional values and philosophies. Due to this, the growth potential in the market will arise from integrating traditional organic content into serums.
  • Natural ingredients and herbal extracts are expected to create lucrative growth opportunities for local brands.
  • Similarly, the global players will likely have to shift to this product design from the perspective of demand-side trends in the Chinese market.
  • The estimated Chinese market size will be US$ 1.7 billion by 2034, with an impressive CAGR of 7.2%.

Pollution Control and Protective Skincare Governs the Japanese Facial Serum Market

  • The growth potential of the Japanese market lies in the protective skin care serums produced in its competitive landscape.
  • Japanese manufacturers, similar to the Chinese market, are keen to fulfill the demand-side trend, where consumers seek protection against rising pollution.
  • The demand for products containing organic composition, protecting skin from UV radiation, is likely to surge, fueling the investment opportunities in organic facial serums.
  • This will elevate the market size to US$ 1.2 billion by 2034 at a promising CAGR of 8.0%.

Growth Potential in the South Korean Market is governed by the K-Beauty Trends

  • South Korea estimates the facial serum market growth at a CAGR of 7.9%, which promises to elevate the market size to US$ 0.69 billion through 2034.
  • Due to the integration of unique ingredients, like bee venom and snail mucin, the K-beauty market in the country is flourishing.
  • Glass skin is a typical demand-side trend in the market, fueling the market growth.
  • Hence, this is a primary market driver.

Category-wise Insights

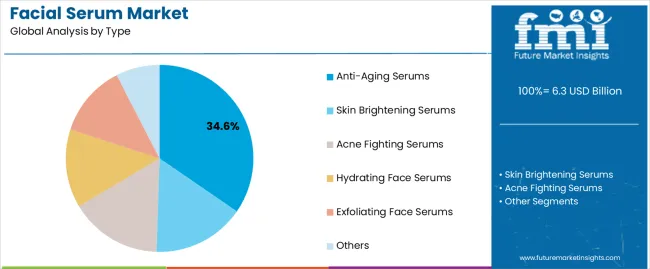
Category Top Type- Anti-Aging Serums
CAGR % 2024 to End of Forecast (2034) 6.2%
Market Segment Drivers
  • Growing concerns about skin health and wrinkles will likely govern the growth potential of the market segment.
  • The competitive landscape is flooded by numerous anti-aging serums, developing more choices for customers.
  • Therefore, this drives the market segment.
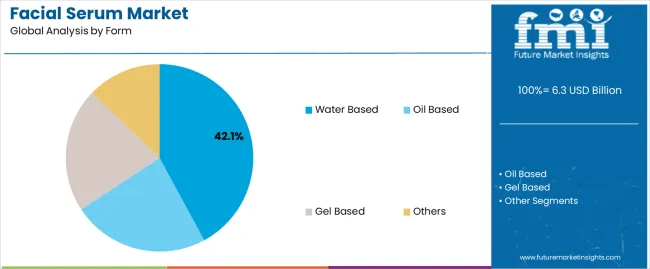
Category Top Form- Water-Based
CAGR % 2024 to End of Forecast (2034) 6.0%
Market Segment Drivers
  • The competitive landscape is estimated to grow the production of water-based serums due to their versatile properties.
  • Acne and wrinkle-reduction are the key benefits of the market segments, developing better growth opportunities for it.

Competitive Landscape

The competitive landscape of the facial serum market is governed by various key players, expanding with the help of numerous strategies. Their expansion's effectiveness determines these key players' growth potential. Key market expansion strategies include mergers and acquisitions, partnerships, strategic collaborations, and innovation.

For new entrants, the competitive landscape is highly cluttered. Product innovation is a key strategic move suggested to meet the demand-side and supply-side trends in the market.

Key Market Developments

  • In September 2023, Galderma S.A. launched Cetaphil Healthy Renew. This product is designed to address sensitive skin issues. This enhances the growth opportunities by widening the scope of the organization’s market penetration in the competitive landscape.
  • In March 2024, L'Oréal S.A. introduced a new product called Melasy. The product is specially designed to mitigate the rising issue of skin acne and pigmentations. It helps the organization bolster its position in the competitive landscape, and due to the widened horizons of products, it improves the scope of investments in the facial serum brand.

Key Coverage of Facial Serum Market Report

  • Facial Serum Market Investment Analysis
  • Investment opportunities in organic facial serums
  • Risk assessment for facial serum product development
  • Trends Influencing Facial Serum Market Investment
  • SWOT, PESTLE, and Porter Analysis for Facial Serums
  • Key coverage of supply-side trends of facial serum.
  • Analysis of the bargaining power of buyers in the industry.

Report Scope

Attributes Details
Estimated Market Size in 2024 US$ 5.9 billion
Projected Market Valuation in 2034 US$ 11.0 billion
Value-based CAGR 2024 to 2034 6.4%
Forecast Period 2024 to 2034
Historical Data Available for 2019 to 2023
Market Analysis Value in US$ billion
Key Regions Covered
  • North America
  • Latin America
  • Western Europe
  • Eastern Europe
  • South Asia and Pacific
  • East Asia
  • The Middle East and Africa
Key Market Segments Covered
  • Type
  • Form
  • Distribution Channel
  • Price Point
  • Region
Key Countries Profiled
  • The United States
  • Canada
  • Brazil
  • Mexico
  • Germany
  • The United Kingdom
  • France
  • Spain
  • Italy
  • Poland
  • Russia
  • Czech Republic
  • Romania
  • India
  • Bangladesh
  • Australia
  • New Zealand
  • China
  • Japan
  • South Korea
  • GCC Countries
  • South Africa
  • Israel
Key Companies Profiled
  • L'Oréal S.A.
  • Galderma S.A
  • Amorepacific Group Inc.
  • KOSÉ Corporation
  • Clarins Inc.
  • Unilever plc
  • Shiseido Company Limited
  • Beiersdorf AG
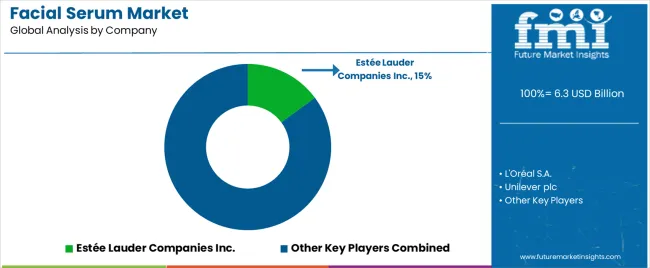
  • Estée Lauder Companies Inc.
  • Revlon Inc.

Facial Serum Market- Key Segments

By Type:

  • Anti-Aging Serums
  • Skin Brightening Serums
  • Acne Fighting Serums
  • Hydrating Face Serums
  • Exfoliating Face Serums
  • Others

By Form:

  • Oil Based
  • Gel Based
  • Water Based
  • Others

By Distribution Channel:

  • Supermarkets & Hypermarkets
  • Drugstores & Pharmacies
  • Specialty Beauty Stores
  • Online Retailers
  • Others

By Price Point:

  • Mass-Market
  • Premium
  • Luxury

By Region:

  • North America
  • Latin America
  • Western Europe
  • Eastern Europe
  • South Asia and Pacific
  • East Asia
  • The Middle East and Africa

Frequently Asked Questions

What is the estimated CAGR of the facial serum market through 2034?

The facial serum market is estimated to propel a CAGR of 6.4% through 2034.

What is the estimated market size of the facial serum market by 2034?

The facial serum market is expected to reach US$ 11 billion by 2034.

What is the estimated market size of the facial serum market by 2024?

The facial serum market is expected to reach US$ 5.9 billion by 2024.

Based on type, which category grows most in the facial serum market's material segment through 2034?

The facial serum market's anti-aging serums segment will grow at a CAGR of 6.2% through 2034.

Based on form, which category grows most in the facial serum market's material segment?

The facial serum market's water-based segment will grow at a CAGR of 6% through 2034.

Table of Content

1. Executive Summary

    1.1. Global Market Outlook

    1.2. Demand-side Trends

    1.3. Supply-side Trends

    1.4. Technology Roadmap Analysis

    1.5. Analysis and Recommendations

2. Market Overview

    2.1. Market Coverage / Taxonomy

    2.2. Market Definition / Scope / Limitations

3. Market Background

    3.1. Market Dynamics

        3.1.1. Drivers

        3.1.2. Restraints

        3.1.3. Opportunity

        3.1.4. Trends

    3.2. Scenario Forecast

        3.2.1. Demand in Optimistic Scenario

        3.2.2. Demand in Likely Scenario

        3.2.3. Demand in Conservative Scenario

    3.3. Opportunity Map Analysis

    3.4. Product Life Cycle Analysis

    3.5. Supply Chain Analysis

        3.5.1. Supply Side Participants and their Roles

            3.5.1.1. Manufacturer

            3.5.1.2. Mid-Level Participants (Traders)

            3.5.1.3. Wholesalers and Distributors

        3.5.2. Value Added and Value Created at Node in the Supply Chain

        3.5.3. List of Raw Material Suppliers

        3.5.4. List of Existing and Potential Buyer’s

    3.6. Investment Feasibility Matrix

    3.7. Value Chain Analysis

        3.7.1. Profit Margin Analysis

        3.7.2. Wholesalers and Distributors

        3.7.3. Retailers

    3.8. PESTLE and Porter’s Analysis

    3.9. Regulatory Landscape

        3.9.1. By Key Regions

        3.9.2. By Key Countries

    3.10. Regional Parent Market Outlook

    3.11. Production and Consumption Statistics

    3.12. Import and Export Statistics

4. Global Market Analysis 2019 to 2023 and Forecast, 2024 to 2034

    4.1. Historical Market Size Value (US$ Million) & Volume (Unit Pack) Analysis, 2019 to 2023

    4.2. Current and Future Market Size Value (US$ Million) & Volume (Unit Pack) Projections, 2024 to 2034

        4.2.1. Y-o-Y Growth Trend Analysis

        4.2.2. Absolute $ Opportunity Analysis

5. Global Market Analysis 2019 to 2023 and Forecast 2024 to 2034, By Type

    5.1. Introduction / Key Findings

    5.2. Historical Market Size Value (US$ Million) & Volume (Unit Pack) Analysis By Type, 2019 to 2023

    5.3. Current and Future Market Size Value (US$ Million) & Volume (Unit Pack) Analysis and Forecast By Type, 2024 to 2034

        5.3.1. Anti-Aging Serums

        5.3.2. Skin Brightening Serums

        5.3.3. Acne Fighting Serums

        5.3.4. Hydrating Face Serums

        5.3.5. Exfoliating Face Serums

        5.3.6. Others

    5.4. Y-o-Y Growth Trend Analysis By Type, 2019 to 2023

    5.5. Absolute $ Opportunity Analysis By Type, 2024 to 2034

6. Global Market Analysis 2019 to 2023 and Forecast 2024 to 2034, By Form

    6.1. Introduction / Key Findings

    6.2. Historical Market Size Value (US$ Million) & Volume (Unit Pack) Analysis By Form, 2019 to 2023

    6.3. Current and Future Market Size Value (US$ Million) & Volume (Unit Pack) Analysis and Forecast By Form, 2024 to 2034

        6.3.1. Oil Based

        6.3.2. Gel Based

        6.3.3. Water Based

        6.3.4. Others

    6.4. Y-o-Y Growth Trend Analysis By Form, 2019 to 2023

    6.5. Absolute $ Opportunity Analysis By Form, 2024 to 2034

7. Global Market Analysis 2019 to 2023 and Forecast 2024 to 2034, By Distribution Channel

    7.1. Introduction / Key Findings

    7.2. Historical Market Size Value (US$ Million) & Volume (Unit Pack) Analysis By Distribution Channel, 2019 to 2023

    7.3. Current and Future Market Size Value (US$ Million) & Volume (Unit Pack) Analysis and Forecast By Distribution Channel, 2024 to 2034

        7.3.1. Supermarkets & Hypermarkets

        7.3.2. Drugstores & Pharmacies

        7.3.3. Specialty Beauty Stores

        7.3.4. Online Retailers

        7.3.5. Others

    7.4. Y-o-Y Growth Trend Analysis By Distribution Channel, 2019 to 2023

    7.5. Absolute $ Opportunity Analysis By Distribution Channel, 2024 to 2034

8. Global Market Analysis 2019 to 2023 and Forecast 2024 to 2034, By Region

    8.1. Introduction

    8.2. Historical Market Size Value (US$ Million) & Volume (Unit Pack) Analysis By Region, 2019 to 2023

    8.3. Current Market Size Value (US$ Million) & Volume (Unit Pack) Analysis and Forecast By Region, 2024 to 2034

        8.3.1. North America

        8.3.2. Latin America

        8.3.3. Western Europe

        8.3.4. Eastern Europe

        8.3.5. South Asia and Pacific

        8.3.6. East Asia

        8.3.7. Middle East and Africa

    8.4. Market Attractiveness Analysis By Region

9. North America Market Analysis 2019 to 2023 and Forecast 2024 to 2034, By Country

    9.1. Historical Market Size Value (US$ Million) & Volume (Unit Pack) Trend Analysis By Market Taxonomy, 2019 to 2023

    9.2. Market Size Value (US$ Million) & Volume (Unit Pack) Forecast By Market Taxonomy, 2024 to 2034

        9.2.1. By Country

            9.2.1.1. USA

            9.2.1.2. Canada

        9.2.2. By Type

        9.2.3. By Form

        9.2.4. By Distribution Channel

    9.3. Market Attractiveness Analysis

        9.3.1. By Country

        9.3.2. By Type

        9.3.3. By Form

        9.3.4. By Distribution Channel

    9.4. Key Takeaways

10. Latin America Market Analysis 2019 to 2023 and Forecast 2024 to 2034, By Country

    10.1. Historical Market Size Value (US$ Million) & Volume (Unit Pack) Trend Analysis By Market Taxonomy, 2019 to 2023

    10.2. Market Size Value (US$ Million) & Volume (Unit Pack) Forecast By Market Taxonomy, 2024 to 2034

        10.2.1. By Country

            10.2.1.1. Brazil

            10.2.1.2. Mexico

            10.2.1.3. Rest of Latin America

        10.2.2. By Type

        10.2.3. By Form

        10.2.4. By Distribution Channel

    10.3. Market Attractiveness Analysis

        10.3.1. By Country

        10.3.2. By Type

        10.3.3. By Form

        10.3.4. By Distribution Channel

    10.4. Key Takeaways

11. Western Europe Market Analysis 2019 to 2023 and Forecast 2024 to 2034, By Country

    11.1. Historical Market Size Value (US$ Million) & Volume (Unit Pack) Trend Analysis By Market Taxonomy, 2019 to 2023

    11.2. Market Size Value (US$ Million) & Volume (Unit Pack) Forecast By Market Taxonomy, 2024 to 2034

        11.2.1. By Country

            11.2.1.1. Germany

            11.2.1.2. UK

            11.2.1.3. France

            11.2.1.4. Spain

            11.2.1.5. Italy

            11.2.1.6. Rest of Western Europe

        11.2.2. By Type

        11.2.3. By Form

        11.2.4. By Distribution Channel

    11.3. Market Attractiveness Analysis

        11.3.1. By Country

        11.3.2. By Type

        11.3.3. By Form

        11.3.4. By Distribution Channel

    11.4. Key Takeaways

12. Eastern Europe Market Analysis 2019 to 2023 and Forecast 2024 to 2034, By Country

    12.1. Historical Market Size Value (US$ Million) & Volume (Unit Pack) Trend Analysis By Market Taxonomy, 2019 to 2023

    12.2. Market Size Value (US$ Million) & Volume (Unit Pack) Forecast By Market Taxonomy, 2024 to 2034

        12.2.1. By Country

            12.2.1.1. Poland

            12.2.1.2. Russia

            12.2.1.3. Czech Republic

            12.2.1.4. Romania

            12.2.1.5. Rest of Eastern Europe

        12.2.2. By Type

        12.2.3. By Form

        12.2.4. By Distribution Channel

    12.3. Market Attractiveness Analysis

        12.3.1. By Country

        12.3.2. By Type

        12.3.3. By Form

        12.3.4. By Distribution Channel

    12.4. Key Takeaways

13. South Asia and Pacific Market Analysis 2019 to 2023 and Forecast 2024 to 2034, By Country

    13.1. Historical Market Size Value (US$ Million) & Volume (Unit Pack) Trend Analysis By Market Taxonomy, 2019 to 2023

    13.2. Market Size Value (US$ Million) & Volume (Unit Pack) Forecast By Market Taxonomy, 2024 to 2034

        13.2.1. By Country

            13.2.1.1. India

            13.2.1.2. Bangladesh

            13.2.1.3. Australia

            13.2.1.4. New Zealand

            13.2.1.5. Rest of South Asia and Pacific

        13.2.2. By Type

        13.2.3. By Form

        13.2.4. By Distribution Channel

    13.3. Market Attractiveness Analysis

        13.3.1. By Country

        13.3.2. By Type

        13.3.3. By Form

        13.3.4. By Distribution Channel

    13.4. Key Takeaways

14. East Asia Market Analysis 2019 to 2023 and Forecast 2024 to 2034, By Country

    14.1. Historical Market Size Value (US$ Million) & Volume (Unit Pack) Trend Analysis By Market Taxonomy, 2019 to 2023

    14.2. Market Size Value (US$ Million) & Volume (Unit Pack) Forecast By Market Taxonomy, 2024 to 2034

        14.2.1. By Country

            14.2.1.1. China

            14.2.1.2. Japan

            14.2.1.3. South Korea

        14.2.2. By Type

        14.2.3. By Form

        14.2.4. By Distribution Channel

    14.3. Market Attractiveness Analysis

        14.3.1. By Country

        14.3.2. By Type

        14.3.3. By Form

        14.3.4. By Distribution Channel

    14.4. Key Takeaways

15. Middle East and Africa Market Analysis 2019 to 2023 and Forecast 2024 to 2034, By Country

    15.1. Historical Market Size Value (US$ Million) & Volume (Unit Pack) Trend Analysis By Market Taxonomy, 2019 to 2023

    15.2. Market Size Value (US$ Million) & Volume (Unit Pack) Forecast By Market Taxonomy, 2024 to 2034

        15.2.1. By Country

            15.2.1.1. GCC Countries

            15.2.1.2. South Africa

            15.2.1.3. Israel

            15.2.1.4. Rest of MEA

        15.2.2. By Type

        15.2.3. By Form

        15.2.4. By Distribution Channel

    15.3. Market Attractiveness Analysis

        15.3.1. By Country

        15.3.2. By Type

        15.3.3. By Form

        15.3.4. By Distribution Channel

    15.4. Key Takeaways

16. Key Countries Market Analysis

    16.1. USA

        16.1.1. Pricing Analysis

        16.1.2. Market Share Analysis, 2023

            16.1.2.1. By Type

            16.1.2.2. By Form

            16.1.2.3. By Distribution Channel

    16.2. Canada

        16.2.1. Pricing Analysis

        16.2.2. Market Share Analysis, 2023

            16.2.2.1. By Type

            16.2.2.2. By Form

            16.2.2.3. By Distribution Channel

    16.3. Brazil

        16.3.1. Pricing Analysis

        16.3.2. Market Share Analysis, 2023

            16.3.2.1. By Type

            16.3.2.2. By Form

            16.3.2.3. By Distribution Channel

    16.4. Mexico

        16.4.1. Pricing Analysis

        16.4.2. Market Share Analysis, 2023

            16.4.2.1. By Type

            16.4.2.2. By Form

            16.4.2.3. By Distribution Channel

    16.5. Germany

        16.5.1. Pricing Analysis

        16.5.2. Market Share Analysis, 2023

            16.5.2.1. By Type

            16.5.2.2. By Form

            16.5.2.3. By Distribution Channel

    16.6. UK

        16.6.1. Pricing Analysis

        16.6.2. Market Share Analysis, 2023

            16.6.2.1. By Type

            16.6.2.2. By Form

            16.6.2.3. By Distribution Channel

    16.7. France

        16.7.1. Pricing Analysis

        16.7.2. Market Share Analysis, 2023

            16.7.2.1. By Type

            16.7.2.2. By Form

            16.7.2.3. By Distribution Channel

    16.8. Spain

        16.8.1. Pricing Analysis

        16.8.2. Market Share Analysis, 2023

            16.8.2.1. By Type

            16.8.2.2. By Form

            16.8.2.3. By Distribution Channel

    16.9. Italy

        16.9.1. Pricing Analysis

        16.9.2. Market Share Analysis, 2023

            16.9.2.1. By Type

            16.9.2.2. By Form

            16.9.2.3. By Distribution Channel

    16.10. Poland

        16.10.1. Pricing Analysis

        16.10.2. Market Share Analysis, 2023

            16.10.2.1. By Type

            16.10.2.2. By Form

            16.10.2.3. By Distribution Channel

    16.11. Russia

        16.11.1. Pricing Analysis

        16.11.2. Market Share Analysis, 2023

            16.11.2.1. By Type

            16.11.2.2. By Form

            16.11.2.3. By Distribution Channel

    16.12. Czech Republic

        16.12.1. Pricing Analysis

        16.12.2. Market Share Analysis, 2023

            16.12.2.1. By Type

            16.12.2.2. By Form

            16.12.2.3. By Distribution Channel

    16.13. Romania

        16.13.1. Pricing Analysis

        16.13.2. Market Share Analysis, 2023

            16.13.2.1. By Type

            16.13.2.2. By Form

            16.13.2.3. By Distribution Channel

    16.14. India

        16.14.1. Pricing Analysis

        16.14.2. Market Share Analysis, 2023

            16.14.2.1. By Type

            16.14.2.2. By Form

            16.14.2.3. By Distribution Channel

    16.15. Bangladesh

        16.15.1. Pricing Analysis

        16.15.2. Market Share Analysis, 2023

            16.15.2.1. By Type

            16.15.2.2. By Form

            16.15.2.3. By Distribution Channel

    16.16. Australia

        16.16.1. Pricing Analysis

        16.16.2. Market Share Analysis, 2023

            16.16.2.1. By Type

            16.16.2.2. By Form

            16.16.2.3. By Distribution Channel

    16.17. New Zealand

        16.17.1. Pricing Analysis

        16.17.2. Market Share Analysis, 2023

            16.17.2.1. By Type

            16.17.2.2. By Form

            16.17.2.3. By Distribution Channel

    16.18. China

        16.18.1. Pricing Analysis

        16.18.2. Market Share Analysis, 2023

            16.18.2.1. By Type

            16.18.2.2. By Form

            16.18.2.3. By Distribution Channel

    16.19. Japan

        16.19.1. Pricing Analysis

        16.19.2. Market Share Analysis, 2023

            16.19.2.1. By Type

            16.19.2.2. By Form

            16.19.2.3. By Distribution Channel

    16.20. South Korea

        16.20.1. Pricing Analysis

        16.20.2. Market Share Analysis, 2023

            16.20.2.1. By Type

            16.20.2.2. By Form

            16.20.2.3. By Distribution Channel

    16.21. GCC Countries

        16.21.1. Pricing Analysis

        16.21.2. Market Share Analysis, 2023

            16.21.2.1. By Type

            16.21.2.2. By Form

            16.21.2.3. By Distribution Channel

    16.22. South Africa

        16.22.1. Pricing Analysis

        16.22.2. Market Share Analysis, 2023

            16.22.2.1. By Type

            16.22.2.2. By Form

            16.22.2.3. By Distribution Channel

    16.23. Israel

        16.23.1. Pricing Analysis

        16.23.2. Market Share Analysis, 2023

            16.23.2.1. By Type

            16.23.2.2. By Form

            16.23.2.3. By Distribution Channel

17. Market Structure Analysis

    17.1. Competition Dashboard

    17.2. Competition Benchmarking

    17.3. Market Share Analysis of Top Players

        17.3.1. By Regional

        17.3.2. By Type

        17.3.3. By Form

        17.3.4. By Distribution Channel

18. Competition Analysis

    18.1. Competition Deep Dive

        18.1.1. L'Oréal S.A.

            18.1.1.1. Overview

            18.1.1.2. Product Portfolio

            18.1.1.3. Profitability by Market Segments

            18.1.1.4. Sales Footprint

            18.1.1.5. Strategy Overview

                18.1.1.5.1. Marketing Strategy

                18.1.1.5.2. Product Strategy

                18.1.1.5.3. Channel Strategy

        18.1.2. Galderma S.A. 

            18.1.2.1. Overview

            18.1.2.2. Product Portfolio

            18.1.2.3. Profitability by Market Segments

            18.1.2.4. Sales Footprint

            18.1.2.5. Strategy Overview

                18.1.2.5.1. Marketing Strategy

                18.1.2.5.2. Product Strategy

                18.1.2.5.3. Channel Strategy

        18.1.3. Amorepacific Group Inc.

            18.1.3.1. Overview

            18.1.3.2. Product Portfolio

            18.1.3.3. Profitability by Market Segments

            18.1.3.4. Sales Footprint

            18.1.3.5. Strategy Overview

                18.1.3.5.1. Marketing Strategy

                18.1.3.5.2. Product Strategy

                18.1.3.5.3. Channel Strategy

        18.1.4. KOSÉ Corporation

            18.1.4.1. Overview

            18.1.4.2. Product Portfolio

            18.1.4.3. Profitability by Market Segments

            18.1.4.4. Sales Footprint

            18.1.4.5. Strategy Overview

                18.1.4.5.1. Marketing Strategy

                18.1.4.5.2. Product Strategy

                18.1.4.5.3. Channel Strategy

        18.1.5. Clarins Inc.

            18.1.5.1. Overview

            18.1.5.2. Product Portfolio

            18.1.5.3. Profitability by Market Segments

            18.1.5.4. Sales Footprint

            18.1.5.5. Strategy Overview

                18.1.5.5.1. Marketing Strategy

                18.1.5.5.2. Product Strategy

                18.1.5.5.3. Channel Strategy

        18.1.6. Unilever plc

            18.1.6.1. Overview

            18.1.6.2. Product Portfolio

            18.1.6.3. Profitability by Market Segments

            18.1.6.4. Sales Footprint

            18.1.6.5. Strategy Overview

                18.1.6.5.1. Marketing Strategy

                18.1.6.5.2. Product Strategy

                18.1.6.5.3. Channel Strategy

        18.1.7. Shiseido Company Limited

            18.1.7.1. Overview

            18.1.7.2. Product Portfolio

            18.1.7.3. Profitability by Market Segments

            18.1.7.4. Sales Footprint

            18.1.7.5. Strategy Overview

                18.1.7.5.1. Marketing Strategy

                18.1.7.5.2. Product Strategy

                18.1.7.5.3. Channel Strategy

        18.1.8. Beiersdorf AG 

            18.1.8.1. Overview

            18.1.8.2. Product Portfolio

            18.1.8.3. Profitability by Market Segments

            18.1.8.4. Sales Footprint

            18.1.8.5. Strategy Overview

                18.1.8.5.1. Marketing Strategy

                18.1.8.5.2. Product Strategy

                18.1.8.5.3. Channel Strategy

        18.1.9. Estée Lauder Companies Inc.

            18.1.9.1. Overview

            18.1.9.2. Product Portfolio

            18.1.9.3. Profitability by Market Segments

            18.1.9.4. Sales Footprint

            18.1.9.5. Strategy Overview

                18.1.9.5.1. Marketing Strategy

                18.1.9.5.2. Product Strategy

                18.1.9.5.3. Channel Strategy

        18.1.10. Revlon Inc.

            18.1.10.1. Overview

            18.1.10.2. Product Portfolio

            18.1.10.3. Profitability by Market Segments

            18.1.10.4. Sales Footprint

            18.1.10.5. Strategy Overview

                18.1.10.5.1. Marketing Strategy

                18.1.10.5.2. Product Strategy

                18.1.10.5.3. Channel Strategy

19. Assumptions & Acronyms Used

20. Research Methodology

List of Tables

Table 1: Global Market Value (US$ Million) Forecast by Region, 2019 to 2034

Table 2: Global Market Volume (Unit Pack) Forecast by Region, 2019 to 2034

Table 3: Global Market Value (US$ Million) Forecast by Type, 2019 to 2034

Table 4: Global Market Volume (Unit Pack) Forecast by Type, 2019 to 2034

Table 5: Global Market Value (US$ Million) Forecast by Form, 2019 to 2034

Table 6: Global Market Volume (Unit Pack) Forecast by Form, 2019 to 2034

Table 7: Global Market Value (US$ Million) Forecast by Distribution Channel, 2019 to 2034

Table 8: Global Market Volume (Unit Pack) Forecast by Distribution Channel, 2019 to 2034

Table 9: North America Market Value (US$ Million) Forecast by Country, 2019 to 2034

Table 10: North America Market Volume (Unit Pack) Forecast by Country, 2019 to 2034

Table 11: North America Market Value (US$ Million) Forecast by Type, 2019 to 2034

Table 12: North America Market Volume (Unit Pack) Forecast by Type, 2019 to 2034

Table 13: North America Market Value (US$ Million) Forecast by Form, 2019 to 2034

Table 14: North America Market Volume (Unit Pack) Forecast by Form, 2019 to 2034

Table 15: North America Market Value (US$ Million) Forecast by Distribution Channel, 2019 to 2034

Table 16: North America Market Volume (Unit Pack) Forecast by Distribution Channel, 2019 to 2034

Table 17: Latin America Market Value (US$ Million) Forecast by Country, 2019 to 2034

Table 18: Latin America Market Volume (Unit Pack) Forecast by Country, 2019 to 2034

Table 19: Latin America Market Value (US$ Million) Forecast by Type, 2019 to 2034

Table 20: Latin America Market Volume (Unit Pack) Forecast by Type, 2019 to 2034

Table 21: Latin America Market Value (US$ Million) Forecast by Form, 2019 to 2034

Table 22: Latin America Market Volume (Unit Pack) Forecast by Form, 2019 to 2034

Table 23: Latin America Market Value (US$ Million) Forecast by Distribution Channel, 2019 to 2034

Table 24: Latin America Market Volume (Unit Pack) Forecast by Distribution Channel, 2019 to 2034

Table 25: Western Europe Market Value (US$ Million) Forecast by Country, 2019 to 2034

Table 26: Western Europe Market Volume (Unit Pack) Forecast by Country, 2019 to 2034

Table 27: Western Europe Market Value (US$ Million) Forecast by Type, 2019 to 2034

Table 28: Western Europe Market Volume (Unit Pack) Forecast by Type, 2019 to 2034

Table 29: Western Europe Market Value (US$ Million) Forecast by Form, 2019 to 2034

Table 30: Western Europe Market Volume (Unit Pack) Forecast by Form, 2019 to 2034

Table 31: Western Europe Market Value (US$ Million) Forecast by Distribution Channel, 2019 to 2034

Table 32: Western Europe Market Volume (Unit Pack) Forecast by Distribution Channel, 2019 to 2034

Table 33: Eastern Europe Market Value (US$ Million) Forecast by Country, 2019 to 2034

Table 34: Eastern Europe Market Volume (Unit Pack) Forecast by Country, 2019 to 2034

Table 35: Eastern Europe Market Value (US$ Million) Forecast by Type, 2019 to 2034

Table 36: Eastern Europe Market Volume (Unit Pack) Forecast by Type, 2019 to 2034

Table 37: Eastern Europe Market Value (US$ Million) Forecast by Form, 2019 to 2034

Table 38: Eastern Europe Market Volume (Unit Pack) Forecast by Form, 2019 to 2034

Table 39: Eastern Europe Market Value (US$ Million) Forecast by Distribution Channel, 2019 to 2034

Table 40: Eastern Europe Market Volume (Unit Pack) Forecast by Distribution Channel, 2019 to 2034

Table 41: South Asia and Pacific Market Value (US$ Million) Forecast by Country, 2019 to 2034

Table 42: South Asia and Pacific Market Volume (Unit Pack) Forecast by Country, 2019 to 2034

Table 43: South Asia and Pacific Market Value (US$ Million) Forecast by Type, 2019 to 2034

Table 44: South Asia and Pacific Market Volume (Unit Pack) Forecast by Type, 2019 to 2034

Table 45: South Asia and Pacific Market Value (US$ Million) Forecast by Form, 2019 to 2034

Table 46: South Asia and Pacific Market Volume (Unit Pack) Forecast by Form, 2019 to 2034

Table 47: South Asia and Pacific Market Value (US$ Million) Forecast by Distribution Channel, 2019 to 2034

Table 48: South Asia and Pacific Market Volume (Unit Pack) Forecast by Distribution Channel, 2019 to 2034

Table 49: East Asia Market Value (US$ Million) Forecast by Country, 2019 to 2034

Table 50: East Asia Market Volume (Unit Pack) Forecast by Country, 2019 to 2034

Table 51: East Asia Market Value (US$ Million) Forecast by Type, 2019 to 2034

Table 52: East Asia Market Volume (Unit Pack) Forecast by Type, 2019 to 2034

Table 53: East Asia Market Value (US$ Million) Forecast by Form, 2019 to 2034

Table 54: East Asia Market Volume (Unit Pack) Forecast by Form, 2019 to 2034

Table 55: East Asia Market Value (US$ Million) Forecast by Distribution Channel, 2019 to 2034

Table 56: East Asia Market Volume (Unit Pack) Forecast by Distribution Channel, 2019 to 2034

Table 57: Middle East and Africa Market Value (US$ Million) Forecast by Country, 2019 to 2034

Table 58: Middle East and Africa Market Volume (Unit Pack) Forecast by Country, 2019 to 2034

Table 59: Middle East and Africa Market Value (US$ Million) Forecast by Type, 2019 to 2034

Table 60: Middle East and Africa Market Volume (Unit Pack) Forecast by Type, 2019 to 2034

Table 61: Middle East and Africa Market Value (US$ Million) Forecast by Form, 2019 to 2034

Table 62: Middle East and Africa Market Volume (Unit Pack) Forecast by Form, 2019 to 2034

Table 63: Middle East and Africa Market Value (US$ Million) Forecast by Distribution Channel, 2019 to 2034

Table 64: Middle East and Africa Market Volume (Unit Pack) Forecast by Distribution Channel, 2019 to 2034

List of Charts

Figure 1: Global Market Value (US$ Million) by Type, 2024 to 2034

Figure 2: Global Market Value (US$ Million) by Form, 2024 to 2034

Figure 3: Global Market Value (US$ Million) by Distribution Channel, 2024 to 2034

Figure 4: Global Market Value (US$ Million) by Region, 2024 to 2034

Figure 5: Global Market Value (US$ Million) Analysis by Region, 2019 to 2034

Figure 6: Global Market Volume (Unit Pack) Analysis by Region, 2019 to 2034

Figure 7: Global Market Value Share (%) and BPS Analysis by Region, 2024 to 2034

Figure 8: Global Market Y-o-Y Growth (%) Projections by Region, 2024 to 2034

Figure 9: Global Market Value (US$ Million) Analysis by Type, 2019 to 2034

Figure 10: Global Market Volume (Unit Pack) Analysis by Type, 2019 to 2034

Figure 11: Global Market Value Share (%) and BPS Analysis by Type, 2024 to 2034

Figure 12: Global Market Y-o-Y Growth (%) Projections by Type, 2024 to 2034

Figure 13: Global Market Value (US$ Million) Analysis by Form, 2019 to 2034

Figure 14: Global Market Volume (Unit Pack) Analysis by Form, 2019 to 2034

Figure 15: Global Market Value Share (%) and BPS Analysis by Form, 2024 to 2034

Figure 16: Global Market Y-o-Y Growth (%) Projections by Form, 2024 to 2034

Figure 17: Global Market Value (US$ Million) Analysis by Distribution Channel, 2019 to 2034

Figure 18: Global Market Volume (Unit Pack) Analysis by Distribution Channel, 2019 to 2034

Figure 19: Global Market Value Share (%) and BPS Analysis by Distribution Channel, 2024 to 2034

Figure 20: Global Market Y-o-Y Growth (%) Projections by Distribution Channel, 2024 to 2034

Figure 21: Global Market Attractiveness by Type, 2024 to 2034

Figure 22: Global Market Attractiveness by Form, 2024 to 2034

Figure 23: Global Market Attractiveness by Distribution Channel, 2024 to 2034

Figure 24: Global Market Attractiveness by Region, 2024 to 2034

Figure 25: North America Market Value (US$ Million) by Type, 2024 to 2034

Figure 26: North America Market Value (US$ Million) by Form, 2024 to 2034

Figure 27: North America Market Value (US$ Million) by Distribution Channel, 2024 to 2034

Figure 28: North America Market Value (US$ Million) by Country, 2024 to 2034

Figure 29: North America Market Value (US$ Million) Analysis by Country, 2019 to 2034

Figure 30: North America Market Volume (Unit Pack) Analysis by Country, 2019 to 2034

Figure 31: North America Market Value Share (%) and BPS Analysis by Country, 2024 to 2034

Figure 32: North America Market Y-o-Y Growth (%) Projections by Country, 2024 to 2034

Figure 33: North America Market Value (US$ Million) Analysis by Type, 2019 to 2034

Figure 34: North America Market Volume (Unit Pack) Analysis by Type, 2019 to 2034

Figure 35: North America Market Value Share (%) and BPS Analysis by Type, 2024 to 2034

Figure 36: North America Market Y-o-Y Growth (%) Projections by Type, 2024 to 2034

Figure 37: North America Market Value (US$ Million) Analysis by Form, 2019 to 2034

Figure 38: North America Market Volume (Unit Pack) Analysis by Form, 2019 to 2034

Figure 39: North America Market Value Share (%) and BPS Analysis by Form, 2024 to 2034

Figure 40: North America Market Y-o-Y Growth (%) Projections by Form, 2024 to 2034

Figure 41: North America Market Value (US$ Million) Analysis by Distribution Channel, 2019 to 2034

Figure 42: North America Market Volume (Unit Pack) Analysis by Distribution Channel, 2019 to 2034

Figure 43: North America Market Value Share (%) and BPS Analysis by Distribution Channel, 2024 to 2034

Figure 44: North America Market Y-o-Y Growth (%) Projections by Distribution Channel, 2024 to 2034

Figure 45: North America Market Attractiveness by Type, 2024 to 2034

Figure 46: North America Market Attractiveness by Form, 2024 to 2034

Figure 47: North America Market Attractiveness by Distribution Channel, 2024 to 2034

Figure 48: North America Market Attractiveness by Country, 2024 to 2034

Figure 49: Latin America Market Value (US$ Million) by Type, 2024 to 2034

Figure 50: Latin America Market Value (US$ Million) by Form, 2024 to 2034

Figure 51: Latin America Market Value (US$ Million) by Distribution Channel, 2024 to 2034

Figure 52: Latin America Market Value (US$ Million) by Country, 2024 to 2034

Figure 53: Latin America Market Value (US$ Million) Analysis by Country, 2019 to 2034

Figure 54: Latin America Market Volume (Unit Pack) Analysis by Country, 2019 to 2034

Figure 55: Latin America Market Value Share (%) and BPS Analysis by Country, 2024 to 2034

Figure 56: Latin America Market Y-o-Y Growth (%) Projections by Country, 2024 to 2034

Figure 57: Latin America Market Value (US$ Million) Analysis by Type, 2019 to 2034

Figure 58: Latin America Market Volume (Unit Pack) Analysis by Type, 2019 to 2034

Figure 59: Latin America Market Value Share (%) and BPS Analysis by Type, 2024 to 2034

Figure 60: Latin America Market Y-o-Y Growth (%) Projections by Type, 2024 to 2034

Figure 61: Latin America Market Value (US$ Million) Analysis by Form, 2019 to 2034

Figure 62: Latin America Market Volume (Unit Pack) Analysis by Form, 2019 to 2034

Figure 63: Latin America Market Value Share (%) and BPS Analysis by Form, 2024 to 2034

Figure 64: Latin America Market Y-o-Y Growth (%) Projections by Form, 2024 to 2034

Figure 65: Latin America Market Value (US$ Million) Analysis by Distribution Channel, 2019 to 2034

Figure 66: Latin America Market Volume (Unit Pack) Analysis by Distribution Channel, 2019 to 2034

Figure 67: Latin America Market Value Share (%) and BPS Analysis by Distribution Channel, 2024 to 2034

Figure 68: Latin America Market Y-o-Y Growth (%) Projections by Distribution Channel, 2024 to 2034

Figure 69: Latin America Market Attractiveness by Type, 2024 to 2034

Figure 70: Latin America Market Attractiveness by Form, 2024 to 2034

Figure 71: Latin America Market Attractiveness by Distribution Channel, 2024 to 2034

Figure 72: Latin America Market Attractiveness by Country, 2024 to 2034

Figure 73: Western Europe Market Value (US$ Million) by Type, 2024 to 2034

Figure 74: Western Europe Market Value (US$ Million) by Form, 2024 to 2034

Figure 75: Western Europe Market Value (US$ Million) by Distribution Channel, 2024 to 2034

Figure 76: Western Europe Market Value (US$ Million) by Country, 2024 to 2034

Figure 77: Western Europe Market Value (US$ Million) Analysis by Country, 2019 to 2034

Figure 78: Western Europe Market Volume (Unit Pack) Analysis by Country, 2019 to 2034

Figure 79: Western Europe Market Value Share (%) and BPS Analysis by Country, 2024 to 2034

Figure 80: Western Europe Market Y-o-Y Growth (%) Projections by Country, 2024 to 2034

Figure 81: Western Europe Market Value (US$ Million) Analysis by Type, 2019 to 2034

Figure 82: Western Europe Market Volume (Unit Pack) Analysis by Type, 2019 to 2034

Figure 83: Western Europe Market Value Share (%) and BPS Analysis by Type, 2024 to 2034

Figure 84: Western Europe Market Y-o-Y Growth (%) Projections by Type, 2024 to 2034

Figure 85: Western Europe Market Value (US$ Million) Analysis by Form, 2019 to 2034

Figure 86: Western Europe Market Volume (Unit Pack) Analysis by Form, 2019 to 2034

Figure 87: Western Europe Market Value Share (%) and BPS Analysis by Form, 2024 to 2034

Figure 88: Western Europe Market Y-o-Y Growth (%) Projections by Form, 2024 to 2034

Figure 89: Western Europe Market Value (US$ Million) Analysis by Distribution Channel, 2019 to 2034

Figure 90: Western Europe Market Volume (Unit Pack) Analysis by Distribution Channel, 2019 to 2034

Figure 91: Western Europe Market Value Share (%) and BPS Analysis by Distribution Channel, 2024 to 2034

Figure 92: Western Europe Market Y-o-Y Growth (%) Projections by Distribution Channel, 2024 to 2034

Figure 93: Western Europe Market Attractiveness by Type, 2024 to 2034

Figure 94: Western Europe Market Attractiveness by Form, 2024 to 2034

Figure 95: Western Europe Market Attractiveness by Distribution Channel, 2024 to 2034

Figure 96: Western Europe Market Attractiveness by Country, 2024 to 2034

Figure 97: Eastern Europe Market Value (US$ Million) by Type, 2024 to 2034

Figure 98: Eastern Europe Market Value (US$ Million) by Form, 2024 to 2034

Figure 99: Eastern Europe Market Value (US$ Million) by Distribution Channel, 2024 to 2034

Figure 100: Eastern Europe Market Value (US$ Million) by Country, 2024 to 2034

Figure 101: Eastern Europe Market Value (US$ Million) Analysis by Country, 2019 to 2034

Figure 102: Eastern Europe Market Volume (Unit Pack) Analysis by Country, 2019 to 2034

Figure 103: Eastern Europe Market Value Share (%) and BPS Analysis by Country, 2024 to 2034

Figure 104: Eastern Europe Market Y-o-Y Growth (%) Projections by Country, 2024 to 2034

Figure 105: Eastern Europe Market Value (US$ Million) Analysis by Type, 2019 to 2034

Figure 106: Eastern Europe Market Volume (Unit Pack) Analysis by Type, 2019 to 2034

Figure 107: Eastern Europe Market Value Share (%) and BPS Analysis by Type, 2024 to 2034

Figure 108: Eastern Europe Market Y-o-Y Growth (%) Projections by Type, 2024 to 2034

Figure 109: Eastern Europe Market Value (US$ Million) Analysis by Form, 2019 to 2034

Figure 110: Eastern Europe Market Volume (Unit Pack) Analysis by Form, 2019 to 2034

Figure 111: Eastern Europe Market Value Share (%) and BPS Analysis by Form, 2024 to 2034

Figure 112: Eastern Europe Market Y-o-Y Growth (%) Projections by Form, 2024 to 2034

Figure 113: Eastern Europe Market Value (US$ Million) Analysis by Distribution Channel, 2019 to 2034

Figure 114: Eastern Europe Market Volume (Unit Pack) Analysis by Distribution Channel, 2019 to 2034

Figure 115: Eastern Europe Market Value Share (%) and BPS Analysis by Distribution Channel, 2024 to 2034

Figure 116: Eastern Europe Market Y-o-Y Growth (%) Projections by Distribution Channel, 2024 to 2034

Figure 117: Eastern Europe Market Attractiveness by Type, 2024 to 2034

Figure 118: Eastern Europe Market Attractiveness by Form, 2024 to 2034

Figure 119: Eastern Europe Market Attractiveness by Distribution Channel, 2024 to 2034

Figure 120: Eastern Europe Market Attractiveness by Country, 2024 to 2034

Figure 121: South Asia and Pacific Market Value (US$ Million) by Type, 2024 to 2034

Figure 122: South Asia and Pacific Market Value (US$ Million) by Form, 2024 to 2034

Figure 123: South Asia and Pacific Market Value (US$ Million) by Distribution Channel, 2024 to 2034

Figure 124: South Asia and Pacific Market Value (US$ Million) by Country, 2024 to 2034

Figure 125: South Asia and Pacific Market Value (US$ Million) Analysis by Country, 2019 to 2034

Figure 126: South Asia and Pacific Market Volume (Unit Pack) Analysis by Country, 2019 to 2034

Figure 127: South Asia and Pacific Market Value Share (%) and BPS Analysis by Country, 2024 to 2034

Figure 128: South Asia and Pacific Market Y-o-Y Growth (%) Projections by Country, 2024 to 2034

Figure 129: South Asia and Pacific Market Value (US$ Million) Analysis by Type, 2019 to 2034

Figure 130: South Asia and Pacific Market Volume (Unit Pack) Analysis by Type, 2019 to 2034

Figure 131: South Asia and Pacific Market Value Share (%) and BPS Analysis by Type, 2024 to 2034

Figure 132: South Asia and Pacific Market Y-o-Y Growth (%) Projections by Type, 2024 to 2034

Figure 133: South Asia and Pacific Market Value (US$ Million) Analysis by Form, 2019 to 2034

Figure 134: South Asia and Pacific Market Volume (Unit Pack) Analysis by Form, 2019 to 2034

Figure 135: South Asia and Pacific Market Value Share (%) and BPS Analysis by Form, 2024 to 2034

Figure 136: South Asia and Pacific Market Y-o-Y Growth (%) Projections by Form, 2024 to 2034

Figure 137: South Asia and Pacific Market Value (US$ Million) Analysis by Distribution Channel, 2019 to 2034

Figure 138: South Asia and Pacific Market Volume (Unit Pack) Analysis by Distribution Channel, 2019 to 2034

Figure 139: South Asia and Pacific Market Value Share (%) and BPS Analysis by Distribution Channel, 2024 to 2034

Figure 140: South Asia and Pacific Market Y-o-Y Growth (%) Projections by Distribution Channel, 2024 to 2034

Figure 141: South Asia and Pacific Market Attractiveness by Type, 2024 to 2034

Figure 142: South Asia and Pacific Market Attractiveness by Form, 2024 to 2034

Figure 143: South Asia and Pacific Market Attractiveness by Distribution Channel, 2024 to 2034

Figure 144: South Asia and Pacific Market Attractiveness by Country, 2024 to 2034

Figure 145: East Asia Market Value (US$ Million) by Type, 2024 to 2034

Figure 146: East Asia Market Value (US$ Million) by Form, 2024 to 2034

Figure 147: East Asia Market Value (US$ Million) by Distribution Channel, 2024 to 2034

Figure 148: East Asia Market Value (US$ Million) by Country, 2024 to 2034

Figure 149: East Asia Market Value (US$ Million) Analysis by Country, 2019 to 2034

Figure 150: East Asia Market Volume (Unit Pack) Analysis by Country, 2019 to 2034

Figure 151: East Asia Market Value Share (%) and BPS Analysis by Country, 2024 to 2034

Figure 152: East Asia Market Y-o-Y Growth (%) Projections by Country, 2024 to 2034

Figure 153: East Asia Market Value (US$ Million) Analysis by Type, 2019 to 2034

Figure 154: East Asia Market Volume (Unit Pack) Analysis by Type, 2019 to 2034

Figure 155: East Asia Market Value Share (%) and BPS Analysis by Type, 2024 to 2034

Figure 156: East Asia Market Y-o-Y Growth (%) Projections by Type, 2024 to 2034

Figure 157: East Asia Market Value (US$ Million) Analysis by Form, 2019 to 2034

Figure 158: East Asia Market Volume (Unit Pack) Analysis by Form, 2019 to 2034

Figure 159: East Asia Market Value Share (%) and BPS Analysis by Form, 2024 to 2034

Figure 160: East Asia Market Y-o-Y Growth (%) Projections by Form, 2024 to 2034

Figure 161: East Asia Market Value (US$ Million) Analysis by Distribution Channel, 2019 to 2034

Figure 162: East Asia Market Volume (Unit Pack) Analysis by Distribution Channel, 2019 to 2034

Figure 163: East Asia Market Value Share (%) and BPS Analysis by Distribution Channel, 2024 to 2034

Figure 164: East Asia Market Y-o-Y Growth (%) Projections by Distribution Channel, 2024 to 2034

Figure 165: East Asia Market Attractiveness by Type, 2024 to 2034

Figure 166: East Asia Market Attractiveness by Form, 2024 to 2034

Figure 167: East Asia Market Attractiveness by Distribution Channel, 2024 to 2034

Figure 168: East Asia Market Attractiveness by Country, 2024 to 2034

Figure 169: Middle East and Africa Market Value (US$ Million) by Type, 2024 to 2034

Figure 170: Middle East and Africa Market Value (US$ Million) by Form, 2024 to 2034

Figure 171: Middle East and Africa Market Value (US$ Million) by Distribution Channel, 2024 to 2034

Figure 172: Middle East and Africa Market Value (US$ Million) by Country, 2024 to 2034

Figure 173: Middle East and Africa Market Value (US$ Million) Analysis by Country, 2019 to 2034

Figure 174: Middle East and Africa Market Volume (Unit Pack) Analysis by Country, 2019 to 2034

Figure 175: Middle East and Africa Market Value Share (%) and BPS Analysis by Country, 2024 to 2034

Figure 176: Middle East and Africa Market Y-o-Y Growth (%) Projections by Country, 2024 to 2034

Figure 177: Middle East and Africa Market Value (US$ Million) Analysis by Type, 2019 to 2034

Figure 178: Middle East and Africa Market Volume (Unit Pack) Analysis by Type, 2019 to 2034

Figure 179: Middle East and Africa Market Value Share (%) and BPS Analysis by Type, 2024 to 2034

Figure 180: Middle East and Africa Market Y-o-Y Growth (%) Projections by Type, 2024 to 2034

Figure 181: Middle East and Africa Market Value (US$ Million) Analysis by Form, 2019 to 2034

Figure 182: Middle East and Africa Market Volume (Unit Pack) Analysis by Form, 2019 to 2034

Figure 183: Middle East and Africa Market Value Share (%) and BPS Analysis by Form, 2024 to 2034

Figure 184: Middle East and Africa Market Y-o-Y Growth (%) Projections by Form, 2024 to 2034

Figure 185: Middle East and Africa Market Value (US$ Million) Analysis by Distribution Channel, 2019 to 2034

Figure 186: Middle East and Africa Market Volume (Unit Pack) Analysis by Distribution Channel, 2019 to 2034

Figure 187: Middle East and Africa Market Value Share (%) and BPS Analysis by Distribution Channel, 2024 to 2034

Figure 188: Middle East and Africa Market Y-o-Y Growth (%) Projections by Distribution Channel, 2024 to 2034

Figure 189: Middle East and Africa Market Attractiveness by Type, 2024 to 2034

Figure 190: Middle East and Africa Market Attractiveness by Form, 2024 to 2034

Figure 191: Middle East and Africa Market Attractiveness by Distribution Channel, 2024 to 2034

Figure 192: Middle East and Africa Market Attractiveness by Country, 2024 to 2034

Recommendations

Consumer Product

Facial Epilator Market

Published : November 2023

Consumer Product

Facial Steamer Market

Published : November 2023

Consumer Product

Facial Tissue Market

Published : October 2022

Healthcare

Facial Erythema Treatment Market

Published : October 2022

Explore Consumer Product Insights

View Reports