Reports

- Global Locations -

Headquarters

Future Market Insights, Inc.

Christiana Corporate, 200
Continental Drive, Suite 401,
Newark, Delaware - 19713,
United States

T: +1-845-579-5705

Americas

Future Market Insights, Inc.

616 Corporate Way, Suite 2-9018,
Valley Cottage, NY 10989, United States

T: +1-347-918-3531

MEA

Future Market Insights

1602-6 Jumeirah Bay X2 Tower, Plot No: JLT-PH2-X2A,
Jumeirah Lakes Towers, Dubai,
United Arab Emirates

Europe

Future Market Insights

3rd Floor, 207 Regent Street,
W1B 3HH London
United Kingdom

T: + 44 (0) 20 8123 9659
D: +44 (0) 20 3287 4268

Asia Pacific

Future Market Insights

IndiaLand Global Tech Park, Unit UG-1, Behind Grand HighStreet, Phase 1, Hinjawadi, MH, Pune – 411057, India

Traffic Sign Recognition System Market Outlook (2022 to 2032)

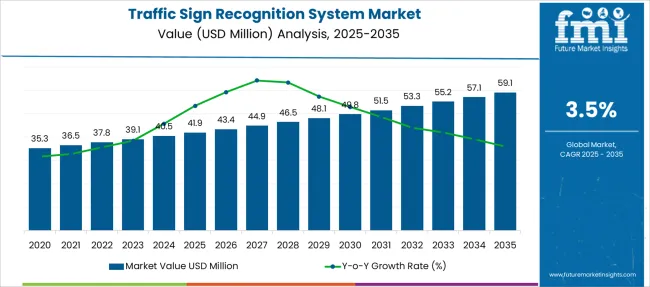
The global traffic sign recognition system market is projected to grow at a CAGR of 3.5%, from US$ 37.81 Million in 2022 to US$ 53.34 Million in 2032.

Owing to initiatives taken by governments and regulatory bodies across the world to ensure road safety and many other factors, the demand for traffic sign recognition systems will only increase in the times to come. Moreover, with even customers looking for vehicles that offer better safety features for their personal well-being, the sales of traffic sign recognition systems will upsurge.

Report Attribute Details
Traffic Sign Recognition System Market Value (2021) US$ 36.53 Million
Traffic Sign Recognition System Market Value (2022) US$ 37.81 Million
Traffic Sign Recognition System Market Value (2032) US$ 53.34 Million
Traffic Sign Recognition System Market Projected Growth Rate (2022 to 2032) 3.5%

A traffic-sign recognition (TSR) system is a technology that can recognize a traffic sign placed beside the road, such as turn ahead, speed limit, etc.

A traffic sign recognition system uses a camera mounted on the vehicle's front to capture video of the roadside spaces. The process can be divided into two phases, which are detection and recognition. In the traffic sign detection process, the Traffic Sign Recognition System uses various methods to identify a road sign's characteristics like shape, color, etc.

With so much technology involved in the manufacturing of traffic sign recognition systems, and even these technologies getting evolved on a continuous basis, one thing is for sure even the traffic sign recognition system will be more sophisticated and will operate with high precision in the coming times. This will ensure higher demand for traffic sign recognition systems.

Don't pay for what you don't need

Customize your report by selecting specific countries or regions and save 30%!

What are the Key Market Drivers Influencing the Sales of Traffic Sign Recognition System?

From the customer's perspective, safety is the main reason why the sales of traffic sign recognition systems are expected to rise. With nearly 1.3 million road deaths in 2021 and 50 million injuries caused because of road accidents, the time is now when people have started adopting safety practices while traveling on the road through vehicles.

The traffic sign recognition system does just that and would give impetus to people who aspire to have safe travel. Moreover, in many developed and developing countries, looking at the previous cases of road accidents, the governments have made it mandatory to install a traffic sign recognition system to avoid accidents. If someone is seen not having installed the traffic sign recognition system, they will be charged with a penalty. All this indicates towards higher demand for traffic sign recognition systems.

Developing countries like India, China, etc., are investing huge amounts of money in technology and road safety. If the benefits of traffic sign recognition system are effectively conveyed to the people residing in such countries, the sales of traffic sign recognition system would certainly increase, and more and more people will act proactively.

A very important point to note over here is that the traffic sign recognition system is mainly used in autonomous cars. Companies like Google, Tesla, Apple, etc., are investing heavily in the development of these autonomous cars. Moreover, based on a study conducted, autonomous cars can reduce the chances of an accident by nearly 95%, as these cars are trained to be extremely careful while plying on the road. Governments are also encouraging people to use these autonomous cars as they run on electric batteries, as a result of which they do not emit harmful gases. Moreover, as these cars make use of a traffic sign recognition system, the chances of road mishaps are drastically reduced. Because of this, the demand for traffic sign recognition system will take an uptick.

However, the only challenge associated with the traffic sign recognition system may be visual recognition. There are times when the signboards may not display the sign clearly because of the wear and tear caused due to extreme weather conditions. Because of that, the system may not be in a position to decide the right course of action and may end up doing something undesirable. This is something on which the manufacturers should ponder upon and come up with a suitable solution.
What is the Region-wise Analysis of Traffic Sign Recognition System Market?

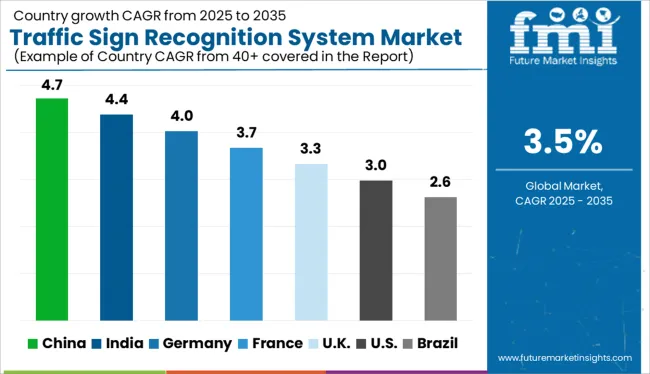
Based on the regional analysis, North America remains the biggest market for traffic sign detection systems followed by Europe. The reason is stringent laws framed by the public authorities to avoid accidents, and also more disposable income for people living in these regions. Thus, North America has the highest market share, followed by Europe.

However, Asia Pacific is showing exponential growth in terms of purchasing traffic sign recognition systems, and would certainly have a relatively higher market share in the future. The reason being major developing countries like India, China, etc., have started taking measures to reduce road mishaps, and to control these incidences, people are buying vehicles that are equipped with such systems.
Nikhil Kaitwade
Nikhil Kaitwade

Principal Consultant

Talk to Analyst

Find your sweet spots for generating winning opportunities in this market.

What is the Competitive Landscape that is observed in Traffic Sign Recognition System Market?

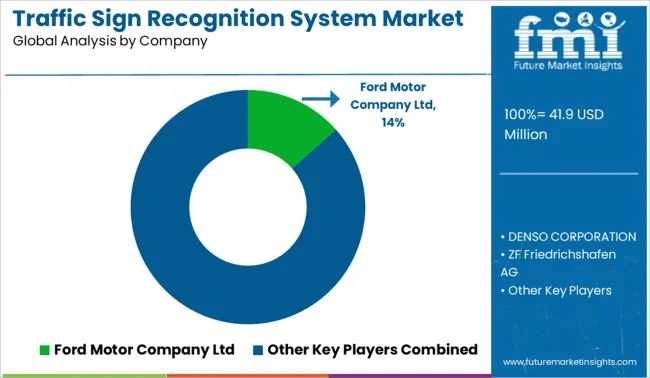
The traffic sign recognition system has a considerable market size. Some of the key players in the traffic sign recognition system market are Ford Motor Company Ltd, DENSO CORPORATION, ZF Friedrichshafen AG, Robert Bosch GmbH, TOSHIBA ELECTRONIC DEVICES & STORAGE CORPORATION, Daimler AG, HELLA Aglaia Mobile Vision GmbH, Continental AG, Škoda Auto a.s., dSPACE GmbH, Magna International Inc., ELBIT, Elektrobit, Mobileye Corporation, Volkswagen.

Recently, Continental announced that it is prepared for developing high-level Advanced Driver Assistance systems, and these would function mainly on the principle of full stack solution. The full stack includes three pillars - the system and the software; the ecosystem; and the component business.

Also, ZF Friedrichshafen AG is all set to hire 5000 engineers in India with an aim to increase its market presence and share in the autonomous technologies market.

Report Scope

Report Attribute Details
Growth Rate CAGR of 3.5% from 2022 to 2032
Base Year for Estimation 2021
Historical Data 2015 to 2021
Forecast Period 2022 to 2032
Quantitative Units Revenue in USD Billion, Volume in Kilotons, and CAGR from 2022 to 2032
Report Coverage Revenue Forecast, Volume Forecast, Company Ranking, Competitive Landscape, Growth Factors, Trends, and Pricing Analysis
Segments Covered
  • Application
  • Traffic
  • Region
Regions Covered
  • North America
  • Latin America
  • Europe
  • East Asia
  • South Asia
  • Oceania
  • Middle East and Africa
Key Countries Profiled
  • USA
  • Canada
  • Brazil
  • Argentina
  • Germany
  • United Kingdom
  • France
  • Spain
  • Italy
  • Nordics
  • BENELUX
  • Australia & New Zealand
  • China
  • India
  • ASIAN
  • GCC Countries
  • South Africa
Key Companies Profiled
  • Ford Motor Company Ltd
  • DENSO CORPORATION
  • ZF Friedrichshafen AG
  • Robert Bosch GmbH
  • TOSHIBA ELECTRONIC DEVICES & STORAGE CORPORATION
  • Daimler AG
  • HELLA Aglaia Mobile Vision GmbH
  • Continental AG,
  • Škoda Auto a.s.
  • dSPACE GmbH
  • Magna International Inc.
  • ELBIT
  • Elektrobit
  • Mobileye Corporation
  • Volkswagen.
Customization Available Upon Request

Get the data you need at a Fraction of the cost

Personalize your report by choosing insights you need
and save 40%!

Key Segments Profiled in the Traffic Sign Recognition System Market

By Application:

  • Commercial vehicle
  • Passenger vehicle

By Traffic:

  • Color based
  • Shape-based
  • Feature-based

By Region:

  • North America
  • Latin America
  • Europe
  • East Asia
  • South Asia
  • Oceania
  • Middle East and Africa

Frequently Asked Questions

What is the expected CAGR over the forecast period for the Traffic Sign Recognition System?

The expected CAGR over the forecast period is 3.5%.

Which Region is the Largest Market for the Traffic Sign Recognition System?

North America is the largest market for the traffic sign recognition system.

What is the Projected Valuation of the Traffic Sign Recognition System Market by 2032?

The traffic sign recognition system market is expected to have a valuation of US$ 53.34 Million in 2032.

Table of Content

1. Executive Summary | Traffic Sign Recognition System Market

    1.1. Global Market Outlook

    1.2. Demand-side Trends

    1.3. Supply-side Trends

    1.4. Technology Roadmap Analysis

    1.5. Analysis and Recommendations

2. Market Overview

    2.1. Market Coverage / Taxonomy

    2.2. Market Definition / Scope / Limitations

3. Market Background

    3.1. Market Dynamics

        3.1.1. Drivers

        3.1.2. Restraints

        3.1.3. Opportunity

        3.1.4. Trends

    3.2. Scenario Forecast

        3.2.1. Demand in Optimistic Scenario

        3.2.2. Demand in Likely Scenario

        3.2.3. Demand in Conservative Scenario

    3.3. Opportunity Map Analysis

    3.4. Product Life Cycle Analysis

    3.5. Supply Chain Analysis

        3.5.1. Supply Side Participants and Their Roles

            3.5.1.1. Producers

            3.5.1.2. Mid-Level Participants (Traders/ Agents/ Brokers)

            3.5.1.3. Wholesalers and Distributors

        3.5.2. Value Added and Value Created at Node in the Supply Chain

        3.5.3. List of Raw Material Suppliers

        3.5.4. List of Existing and Potential Buyers

    3.6. Investment Feasibility Matrix

    3.7. Value Chain Analysis

        3.7.1. Profit Margin Analysis

        3.7.2. Wholesalers and Distributors

        3.7.3. Retailers

    3.8. PESTLE and Porter’s Analysis

    3.9. Regulatory Landscape

        3.9.1. By Key Regions

        3.9.2. By Key Countries

    3.10. Regional Parent Market Outlook

    3.11. Production and Consumption Statistics

    3.12. Import and Export Statistics

4. Global Market Analysis 2017 to 2021 and Forecast, 2022 to 2032

    4.1. Historical Market Size Value (US$ Million) & Volume (Units) Analysis, 2017 to 2021

    4.2. Current and Future Market Size Value (US$ Million) & Volume (Units) Projections, 2022 to 2032

        4.2.1. Y-o-Y Growth Trend Analysis

        4.2.2. Absolute $ Opportunity Analysis

5. Global Market Analysis 2017 to 2021 and Forecast 2022 to 2032, By Application

    5.1. Introduction / Key Findings

    5.2. Historical Market Size Value (US$ Million) & Volume (Units) Analysis By Application, 2017 to 2021

    5.3. Current and Future Market Size Value (US$ Million) & Volume (Units) Analysis and Forecast By Application, 2022 to 2032

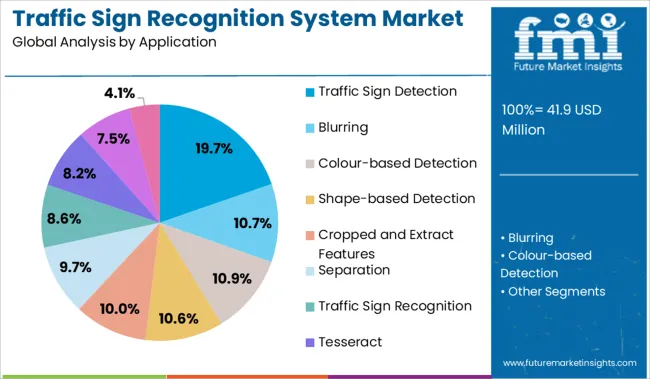
        5.3.1. Traffic Sign Detection

        5.3.2. Blurring

        5.3.3. Colour-based Detection

        5.3.4. Shape-based Detection

        5.3.5. Cropped and Extract Features

        5.3.6. Separation

        5.3.7. Traffic Sign Recognition

        5.3.8. Tesseract

        5.3.9. Support Vector Machine (SVM)

        5.3.10. Others (Template matching, SIFT, etc.)

    5.4. Y-o-Y Growth Trend Analysis By Application, 2017 to 2021

    5.5. Absolute $ Opportunity Analysis By Application, 2022 to 2032

6. Global Market Analysis 2017 to 2021 and Forecast 2022 to 2032, By Vehicle Type

    6.1. Introduction / Key Findings

    6.2. Historical Market Size Value (US$ Million) & Volume (Units) Analysis By Vehicle Type, 2017 to 2021

    6.3. Current and Future Market Size Value (US$ Million) & Volume (Units) Analysis and Forecast By Vehicle Type, 2022 to 2032

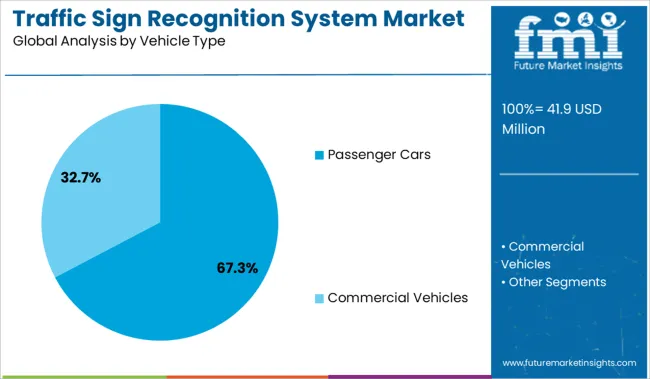
        6.3.1. Passenger Cars

        6.3.2. Commercial Vehicles

    6.4. Y-o-Y Growth Trend Analysis By Vehicle Type, 2017 to 2021

    6.5. Absolute $ Opportunity Analysis By Vehicle Type, 2022 to 2032

7. Global Market Analysis 2017 to 2021 and Forecast 2022 to 2032, By Region

    7.1. Introduction

    7.2. Historical Market Size Value (US$ Million) & Volume (Units) Analysis By Region, 2017 to 2021

    7.3. Current Market Size Value (US$ Million) & Volume (Units) Analysis and Forecast By Region, 2022 to 2032

        7.3.1. North America

        7.3.2. Latin America

        7.3.3. Europe

        7.3.4. Asia Pacific

        7.3.5. Middle East and Africa

    7.4. Market Attractiveness Analysis By Region

8. North America Market Analysis 2017 to 2021 and Forecast 2022 to 2032, By Country

    8.1. Historical Market Size Value (US$ Million) & Volume (Units) Trend Analysis By Market Taxonomy, 2017 to 2021

    8.2. Market Size Value (US$ Million) & Volume (Units) Forecast By Market Taxonomy, 2022 to 2032

        8.2.1. By Country

            8.2.1.1. USA

            8.2.1.2. Canada

        8.2.2. By Application

        8.2.3. By Vehicle Type

    8.3. Market Attractiveness Analysis

        8.3.1. By Country

        8.3.2. By Application

        8.3.3. By Vehicle Type

    8.4. Key Takeaways

9. Latin America Market Analysis 2017 to 2021 and Forecast 2022 to 2032, By Country

    9.1. Historical Market Size Value (US$ Million) & Volume (Units) Trend Analysis By Market Taxonomy, 2017 to 2021

    9.2. Market Size Value (US$ Million) & Volume (Units) Forecast By Market Taxonomy, 2022 to 2032

        9.2.1. By Country

            9.2.1.1. Brazil

            9.2.1.2. Mexico

            9.2.1.3. Argentina

            9.2.1.4. Chile

            9.2.1.5. Peru

            9.2.1.6. Rest of Latin America

        9.2.2. By Application

        9.2.3. By Vehicle Type

    9.3. Market Attractiveness Analysis

        9.3.1. By Country

        9.3.2. By Application

        9.3.3. By Vehicle Type

    9.4. Key Takeaways

10. Europe Market Analysis 2017 to 2021 and Forecast 2022 to 2032, By Country

    10.1. Historical Market Size Value (US$ Million) & Volume (Units) Trend Analysis By Market Taxonomy, 2017 to 2021

    10.2. Market Size Value (US$ Million) & Volume (Units) Forecast By Market Taxonomy, 2022 to 2032

        10.2.1. By Country

            10.2.1.1. Germany

            10.2.1.2. Italy

            10.2.1.3. France

            10.2.1.4. United Kingdom

            10.2.1.5. Spain

            10.2.1.6. Russia

            10.2.1.7. BENELUX

            10.2.1.8. Rest of Europe

        10.2.2. By Application

        10.2.3. By Vehicle Type

    10.3. Market Attractiveness Analysis

        10.3.1. By Country

        10.3.2. By Application

        10.3.3. By Vehicle Type

    10.4. Key Takeaways

11. Asia Pacific Market Analysis 2017 to 2021 and Forecast 2022 to 2032, By Country

    11.1. Historical Market Size Value (US$ Million) & Volume (Units) Trend Analysis By Market Taxonomy, 2017 to 2021

    11.2. Market Size Value (US$ Million) & Volume (Units) Forecast By Market Taxonomy, 2022 to 2032

        11.2.1. By Country

            11.2.1.1. China

            11.2.1.2. Japan

            11.2.1.3. South Korea

            11.2.1.4. Rest of Asia Pacific

        11.2.2. By Application

        11.2.3. By Vehicle Type

    11.3. Market Attractiveness Analysis

        11.3.1. By Country

        11.3.2. By Application

        11.3.3. By Vehicle Type

    11.4. Key Takeaways

12. Middle East and Africa Market Analysis 2017 to 2021 and Forecast 2022 to 2032, By Country

    12.1. Historical Market Size Value (US$ Million) & Volume (Units) Trend Analysis By Market Taxonomy, 2017 to 2021

    12.2. Market Size Value (US$ Million) & Volume (Units) Forecast By Market Taxonomy, 2022 to 2032

        12.2.1. By Country

            12.2.1.1. GCC Countries

            12.2.1.2. South Africa

            12.2.1.3. Turkey

            12.2.1.4. Rest of Middle East and Africa

        12.2.2. By Application

        12.2.3. By Vehicle Type

    12.3. Market Attractiveness Analysis

        12.3.1. By Country

        12.3.2. By Application

        12.3.3. By Vehicle Type

    12.4. Key Takeaways

13. Key Countries Market Analysis

    13.1. USA

        13.1.1. Pricing Analysis

        13.1.2. Market Share Analysis, 2021

            13.1.2.1. By Application

            13.1.2.2. By Vehicle Type

    13.2. Canada

        13.2.1. Pricing Analysis

        13.2.2. Market Share Analysis, 2021

            13.2.2.1. By Application

            13.2.2.2. By Vehicle Type

    13.3. Brazil

        13.3.1. Pricing Analysis

        13.3.2. Market Share Analysis, 2021

            13.3.2.1. By Application

            13.3.2.2. By Vehicle Type

    13.4. Mexico

        13.4.1. Pricing Analysis

        13.4.2. Market Share Analysis, 2021

            13.4.2.1. By Application

            13.4.2.2. By Vehicle Type

    13.5. Argentina

        13.5.1. Pricing Analysis

        13.5.2. Market Share Analysis, 2021

            13.5.2.1. By Application

            13.5.2.2. By Vehicle Type

    13.6. Chile

        13.6.1. Pricing Analysis

        13.6.2. Market Share Analysis, 2021

            13.6.2.1. By Application

            13.6.2.2. By Vehicle Type

    13.7. Peru

        13.7.1. Pricing Analysis

        13.7.2. Market Share Analysis, 2021

            13.7.2.1. By Application

            13.7.2.2. By Vehicle Type

    13.8. Germany

        13.8.1. Pricing Analysis

        13.8.2. Market Share Analysis, 2021

            13.8.2.1. By Application

            13.8.2.2. By Vehicle Type

    13.9. Italy

        13.9.1. Pricing Analysis

        13.9.2. Market Share Analysis, 2021

            13.9.2.1. By Application

            13.9.2.2. By Vehicle Type

    13.10. France

        13.10.1. Pricing Analysis

        13.10.2. Market Share Analysis, 2021

            13.10.2.1. By Application

            13.10.2.2. By Vehicle Type

    13.11. United Kingdom

        13.11.1. Pricing Analysis

        13.11.2. Market Share Analysis, 2021

            13.11.2.1. By Application

            13.11.2.2. By Vehicle Type

    13.12. Spain

        13.12.1. Pricing Analysis

        13.12.2. Market Share Analysis, 2021

            13.12.2.1. By Application

            13.12.2.2. By Vehicle Type

    13.13. Russia

        13.13.1. Pricing Analysis

        13.13.2. Market Share Analysis, 2021

            13.13.2.1. By Application

            13.13.2.2. By Vehicle Type

    13.14. BENELUX

        13.14.1. Pricing Analysis

        13.14.2. Market Share Analysis, 2021

            13.14.2.1. By Application

            13.14.2.2. By Vehicle Type

    13.15. China

        13.15.1. Pricing Analysis

        13.15.2. Market Share Analysis, 2021

            13.15.2.1. By Application

            13.15.2.2. By Vehicle Type

    13.16. Japan

        13.16.1. Pricing Analysis

        13.16.2. Market Share Analysis, 2021

            13.16.2.1. By Application

            13.16.2.2. By Vehicle Type

    13.17. South Korea

        13.17.1. Pricing Analysis

        13.17.2. Market Share Analysis, 2021

            13.17.2.1. By Application

            13.17.2.2. By Vehicle Type

    13.18. GCC Countries

        13.18.1. Pricing Analysis

        13.18.2. Market Share Analysis, 2021

            13.18.2.1. By Application

            13.18.2.2. By Vehicle Type

    13.19. South Africa

        13.19.1. Pricing Analysis

        13.19.2. Market Share Analysis, 2021

            13.19.2.1. By Application

            13.19.2.2. By Vehicle Type

    13.20. Turkey

        13.20.1. Pricing Analysis

        13.20.2. Market Share Analysis, 2021

            13.20.2.1. By Application

            13.20.2.2. By Vehicle Type

14. Market Structure Analysis

    14.1. Competition Dashboard

    14.2. Competition Benchmarking

    14.3. Market Share Analysis of Top Players

        14.3.1. By Regional

        14.3.2. By Application

        14.3.3. By Vehicle Type

15. Competition Analysis

    15.1. Competition Deep Dive

        15.1.1. Ford Motor Company Ltd

            15.1.1.1. Overview

            15.1.1.2. Product Portfolio

            15.1.1.3. Profitability by Market Segments

            15.1.1.4. Sales Footprint

            15.1.1.5. Strategy Overview

                15.1.1.5.1. Marketing Strategy

                15.1.1.5.2. Product Strategy

                15.1.1.5.3. Channel Strategy

        15.1.2. DENSO CORPORATION

            15.1.2.1. Overview

            15.1.2.2. Product Portfolio

            15.1.2.3. Profitability by Market Segments

            15.1.2.4. Sales Footprint

            15.1.2.5. Strategy Overview

                15.1.2.5.1. Marketing Strategy

                15.1.2.5.2. Product Strategy

                15.1.2.5.3. Channel Strategy

        15.1.3. ZF Friedrichshafen AG

            15.1.3.1. Overview

            15.1.3.2. Product Portfolio

            15.1.3.3. Profitability by Market Segments

            15.1.3.4. Sales Footprint

            15.1.3.5. Strategy Overview

                15.1.3.5.1. Marketing Strategy

                15.1.3.5.2. Product Strategy

                15.1.3.5.3. Channel Strategy

        15.1.4. Robert Bosch GmbH

            15.1.4.1. Overview

            15.1.4.2. Product Portfolio

            15.1.4.3. Profitability by Market Segments

            15.1.4.4. Sales Footprint

            15.1.4.5. Strategy Overview

                15.1.4.5.1. Marketing Strategy

                15.1.4.5.2. Product Strategy

                15.1.4.5.3. Channel Strategy

        15.1.5. TOSHIBA ELECTRONIC DEVICES & STORAGE CORPORATION

            15.1.5.1. Overview

            15.1.5.2. Product Portfolio

            15.1.5.3. Profitability by Market Segments

            15.1.5.4. Sales Footprint

            15.1.5.5. Strategy Overview

                15.1.5.5.1. Marketing Strategy

                15.1.5.5.2. Product Strategy

                15.1.5.5.3. Channel Strategy

        15.1.6. Daimler AG

            15.1.6.1. Overview

            15.1.6.2. Product Portfolio

            15.1.6.3. Profitability by Market Segments

            15.1.6.4. Sales Footprint

            15.1.6.5. Strategy Overview

                15.1.6.5.1. Marketing Strategy

                15.1.6.5.2. Product Strategy

                15.1.6.5.3. Channel Strategy

        15.1.7. HELLA Aglaia Mobile Vision GmbH

            15.1.7.1. Overview

            15.1.7.2. Product Portfolio

            15.1.7.3. Profitability by Market Segments

            15.1.7.4. Sales Footprint

            15.1.7.5. Strategy Overview

                15.1.7.5.1. Marketing Strategy

                15.1.7.5.2. Product Strategy

                15.1.7.5.3. Channel Strategy

        15.1.8. Continental AG

            15.1.8.1. Overview

            15.1.8.2. Product Portfolio

            15.1.8.3. Profitability by Market Segments

            15.1.8.4. Sales Footprint

            15.1.8.5. Strategy Overview

                15.1.8.5.1. Marketing Strategy

                15.1.8.5.2. Product Strategy

                15.1.8.5.3. Channel Strategy

        15.1.9. Škoda Auto a.s.

            15.1.9.1. Overview

            15.1.9.2. Product Portfolio

            15.1.9.3. Profitability by Market Segments

            15.1.9.4. Sales Footprint

            15.1.9.5. Strategy Overview

                15.1.9.5.1. Marketing Strategy

                15.1.9.5.2. Product Strategy

                15.1.9.5.3. Channel Strategy

        15.1.10. dSPACE GmbH

            15.1.10.1. Overview

            15.1.10.2. Product Portfolio

            15.1.10.3. Profitability by Market Segments

            15.1.10.4. Sales Footprint

            15.1.10.5. Strategy Overview

                15.1.10.5.1. Marketing Strategy

                15.1.10.5.2. Product Strategy

                15.1.10.5.3. Channel Strategy

        15.1.11. Magna International Inc.

            15.1.11.1. Overview

            15.1.11.2. Product Portfolio

            15.1.11.3. Profitability by Market Segments

            15.1.11.4. Sales Footprint

            15.1.11.5. Strategy Overview

                15.1.11.5.1. Marketing Strategy

                15.1.11.5.2. Product Strategy

                15.1.11.5.3. Channel Strategy

        15.1.12. ELBIT

            15.1.12.1. Overview

            15.1.12.2. Product Portfolio

            15.1.12.3. Profitability by Market Segments

            15.1.12.4. Sales Footprint

            15.1.12.5. Strategy Overview

                15.1.12.5.1. Marketing Strategy

                15.1.12.5.2. Product Strategy

                15.1.12.5.3. Channel Strategy

        15.1.13. Elektrobit

            15.1.13.1. Overview

            15.1.13.2. Product Portfolio

            15.1.13.3. Profitability by Market Segments

            15.1.13.4. Sales Footprint

            15.1.13.5. Strategy Overview

                15.1.13.5.1. Marketing Strategy

                15.1.13.5.2. Product Strategy

                15.1.13.5.3. Channel Strategy

16. Assumptions & Acronyms Used

17. Research Methodology

Don't pay for what you don't need

Customize your report by selecting specific countries or regions and save 30%!

List of Tables

Table 1: Global Market Value (US$ Million) Forecast by Region, 2017 to 2032

Table 2: Global Market Volume (Units) Forecast by Region, 2017 to 2032

Table 3: Global Market Value (US$ Million) Forecast by Application, 2017 to 2032

Table 4: Global Market Volume (Units) Forecast by Application, 2017 to 2032

Table 5: Global Market Value (US$ Million) Forecast by Vehicle Type, 2017 to 2032

Table 6: Global Market Volume (Units) Forecast by Vehicle Type, 2017 to 2032

Table 7: North America Market Value (US$ Million) Forecast by Country, 2017 to 2032

Table 8: North America Market Volume (Units) Forecast by Country, 2017 to 2032

Table 9: North America Market Value (US$ Million) Forecast by Application, 2017 to 2032

Table 10: North America Market Volume (Units) Forecast by Application, 2017 to 2032

Table 11: North America Market Value (US$ Million) Forecast by Vehicle Type, 2017 to 2032

Table 12: North America Market Volume (Units) Forecast by Vehicle Type, 2017 to 2032

Table 13: Latin America Market Value (US$ Million) Forecast by Country, 2017 to 2032

Table 14: Latin America Market Volume (Units) Forecast by Country, 2017 to 2032

Table 15: Latin America Market Value (US$ Million) Forecast by Application, 2017 to 2032

Table 16: Latin America Market Volume (Units) Forecast by Application, 2017 to 2032

Table 17: Latin America Market Value (US$ Million) Forecast by Vehicle Type, 2017 to 2032

Table 18: Latin America Market Volume (Units) Forecast by Vehicle Type, 2017 to 2032

Table 19: Europe Market Value (US$ Million) Forecast by Country, 2017 to 2032

Table 20: Europe Market Volume (Units) Forecast by Country, 2017 to 2032

Table 21: Europe Market Value (US$ Million) Forecast by Application, 2017 to 2032

Table 22: Europe Market Volume (Units) Forecast by Application, 2017 to 2032

Table 23: Europe Market Value (US$ Million) Forecast by Vehicle Type, 2017 to 2032

Table 24: Europe Market Volume (Units) Forecast by Vehicle Type, 2017 to 2032

Table 25: Asia Pacific Market Value (US$ Million) Forecast by Country, 2017 to 2032

Table 26: Asia Pacific Market Volume (Units) Forecast by Country, 2017 to 2032

Table 27: Asia Pacific Market Value (US$ Million) Forecast by Application, 2017 to 2032

Table 28: Asia Pacific Market Volume (Units) Forecast by Application, 2017 to 2032

Table 29: Asia Pacific Market Value (US$ Million) Forecast by Vehicle Type, 2017 to 2032

Table 30: Asia Pacific Market Volume (Units) Forecast by Vehicle Type, 2017 to 2032

Table 31: Middle East and Africa Market Value (US$ Million) Forecast by Country, 2017 to 2032

Table 32: Middle East and Africa Market Volume (Units) Forecast by Country, 2017 to 2032

Table 33: Middle East and Africa Market Value (US$ Million) Forecast by Application, 2017 to 2032

Table 34: Middle East and Africa Market Volume (Units) Forecast by Application, 2017 to 2032

Table 35: Middle East and Africa Market Value (US$ Million) Forecast by Vehicle Type, 2017 to 2032

Table 36: Middle East and Africa Market Volume (Units) Forecast by Vehicle Type, 2017 to 2032
Nikhil Kaitwade
Nikhil Kaitwade

Principal Consultant

Talk to Analyst

Find your sweet spots for generating winning opportunities in this market.

List of Charts

Figure 1: Global Market Value (US$ Million) by Application, 2022 to 2032

Figure 2: Global Market Value (US$ Million) by Vehicle Type, 2022 to 2032

Figure 3: Global Market Value (US$ Million) by Region, 2022 to 2032

Figure 4: Global Market Value (US$ Million) Analysis by Region, 2017 to 2032

Figure 5: Global Market Volume (Units) Analysis by Region, 2017 to 2032

Figure 6: Global Market Value Share (%) and BPS Analysis by Region, 2022 to 2032

Figure 7: Global Market Y-o-Y Growth (%) Projections by Region, 2022 to 2032

Figure 8: Global Market Value (US$ Million) Analysis by Application, 2017 to 2032

Figure 9: Global Market Volume (Units) Analysis by Application, 2017 to 2032

Figure 10: Global Market Value Share (%) and BPS Analysis by Application, 2022 to 2032

Figure 11: Global Market Y-o-Y Growth (%) Projections by Application, 2022 to 2032

Figure 12: Global Market Value (US$ Million) Analysis by Vehicle Type, 2017 to 2032

Figure 13: Global Market Volume (Units) Analysis by Vehicle Type, 2017 to 2032

Figure 14: Global Market Value Share (%) and BPS Analysis by Vehicle Type, 2022 to 2032

Figure 15: Global Market Y-o-Y Growth (%) Projections by Vehicle Type, 2022 to 2032

Figure 16: Global Market Attractiveness by Application, 2022 to 2032

Figure 17: Global Market Attractiveness by Vehicle Type, 2022 to 2032

Figure 18: Global Market Attractiveness by Region, 2022 to 2032

Figure 19: North America Market Value (US$ Million) by Application, 2022 to 2032

Figure 20: North America Market Value (US$ Million) by Vehicle Type, 2022 to 2032

Figure 21: North America Market Value (US$ Million) by Country, 2022 to 2032

Figure 22: North America Market Value (US$ Million) Analysis by Country, 2017 to 2032

Figure 23: North America Market Volume (Units) Analysis by Country, 2017 to 2032

Figure 24: North America Market Value Share (%) and BPS Analysis by Country, 2022 to 2032

Figure 25: North America Market Y-o-Y Growth (%) Projections by Country, 2022 to 2032

Figure 26: North America Market Value (US$ Million) Analysis by Application, 2017 to 2032

Figure 27: North America Market Volume (Units) Analysis by Application, 2017 to 2032

Figure 28: North America Market Value Share (%) and BPS Analysis by Application, 2022 to 2032

Figure 29: North America Market Y-o-Y Growth (%) Projections by Application, 2022 to 2032

Figure 30: North America Market Value (US$ Million) Analysis by Vehicle Type, 2017 to 2032

Figure 31: North America Market Volume (Units) Analysis by Vehicle Type, 2017 to 2032

Figure 32: North America Market Value Share (%) and BPS Analysis by Vehicle Type, 2022 to 2032

Figure 33: North America Market Y-o-Y Growth (%) Projections by Vehicle Type, 2022 to 2032

Figure 34: North America Market Attractiveness by Application, 2022 to 2032

Figure 35: North America Market Attractiveness by Vehicle Type, 2022 to 2032

Figure 36: North America Market Attractiveness by Country, 2022 to 2032

Figure 37: Latin America Market Value (US$ Million) by Application, 2022 to 2032

Figure 38: Latin America Market Value (US$ Million) by Vehicle Type, 2022 to 2032

Figure 39: Latin America Market Value (US$ Million) by Country, 2022 to 2032

Figure 40: Latin America Market Value (US$ Million) Analysis by Country, 2017 to 2032

Figure 41: Latin America Market Volume (Units) Analysis by Country, 2017 to 2032

Figure 42: Latin America Market Value Share (%) and BPS Analysis by Country, 2022 to 2032

Figure 43: Latin America Market Y-o-Y Growth (%) Projections by Country, 2022 to 2032

Figure 44: Latin America Market Value (US$ Million) Analysis by Application, 2017 to 2032

Figure 45: Latin America Market Volume (Units) Analysis by Application, 2017 to 2032

Figure 46: Latin America Market Value Share (%) and BPS Analysis by Application, 2022 to 2032

Figure 47: Latin America Market Y-o-Y Growth (%) Projections by Application, 2022 to 2032

Figure 48: Latin America Market Value (US$ Million) Analysis by Vehicle Type, 2017 to 2032

Figure 49: Latin America Market Volume (Units) Analysis by Vehicle Type, 2017 to 2032

Figure 50: Latin America Market Value Share (%) and BPS Analysis by Vehicle Type, 2022 to 2032

Figure 51: Latin America Market Y-o-Y Growth (%) Projections by Vehicle Type, 2022 to 2032

Figure 52: Latin America Market Attractiveness by Application, 2022 to 2032

Figure 53: Latin America Market Attractiveness by Vehicle Type, 2022 to 2032

Figure 54: Latin America Market Attractiveness by Country, 2022 to 2032

Figure 55: Europe Market Value (US$ Million) by Application, 2022 to 2032

Figure 56: Europe Market Value (US$ Million) by Vehicle Type, 2022 to 2032

Figure 57: Europe Market Value (US$ Million) by Country, 2022 to 2032

Figure 58: Europe Market Value (US$ Million) Analysis by Country, 2017 to 2032

Figure 59: Europe Market Volume (Units) Analysis by Country, 2017 to 2032

Figure 60: Europe Market Value Share (%) and BPS Analysis by Country, 2022 to 2032

Figure 61: Europe Market Y-o-Y Growth (%) Projections by Country, 2022 to 2032

Figure 62: Europe Market Value (US$ Million) Analysis by Application, 2017 to 2032

Figure 63: Europe Market Volume (Units) Analysis by Application, 2017 to 2032

Figure 64: Europe Market Value Share (%) and BPS Analysis by Application, 2022 to 2032

Figure 65: Europe Market Y-o-Y Growth (%) Projections by Application, 2022 to 2032

Figure 66: Europe Market Value (US$ Million) Analysis by Vehicle Type, 2017 to 2032

Figure 67: Europe Market Volume (Units) Analysis by Vehicle Type, 2017 to 2032

Figure 68: Europe Market Value Share (%) and BPS Analysis by Vehicle Type, 2022 to 2032

Figure 69: Europe Market Y-o-Y Growth (%) Projections by Vehicle Type, 2022 to 2032

Figure 70: Europe Market Attractiveness by Application, 2022 to 2032

Figure 71: Europe Market Attractiveness by Vehicle Type, 2022 to 2032

Figure 72: Europe Market Attractiveness by Country, 2022 to 2032

Figure 73: Asia Pacific Market Value (US$ Million) by Application, 2022 to 2032

Figure 74: Asia Pacific Market Value (US$ Million) by Vehicle Type, 2022 to 2032

Figure 75: Asia Pacific Market Value (US$ Million) by Country, 2022 to 2032

Figure 76: Asia Pacific Market Value (US$ Million) Analysis by Country, 2017 to 2032

Figure 77: Asia Pacific Market Volume (Units) Analysis by Country, 2017 to 2032

Figure 78: Asia Pacific Market Value Share (%) and BPS Analysis by Country, 2022 to 2032

Figure 79: Asia Pacific Market Y-o-Y Growth (%) Projections by Country, 2022 to 2032

Figure 80: Asia Pacific Market Value (US$ Million) Analysis by Application, 2017 to 2032

Figure 81: Asia Pacific Market Volume (Units) Analysis by Application, 2017 to 2032

Figure 82: Asia Pacific Market Value Share (%) and BPS Analysis by Application, 2022 to 2032

Figure 83: Asia Pacific Market Y-o-Y Growth (%) Projections by Application, 2022 to 2032

Figure 84: Asia Pacific Market Value (US$ Million) Analysis by Vehicle Type, 2017 to 2032

Figure 85: Asia Pacific Market Volume (Units) Analysis by Vehicle Type, 2017 to 2032

Figure 86: Asia Pacific Market Value Share (%) and BPS Analysis by Vehicle Type, 2022 to 2032

Figure 87: Asia Pacific Market Y-o-Y Growth (%) Projections by Vehicle Type, 2022 to 2032

Figure 88: Asia Pacific Market Attractiveness by Application, 2022 to 2032

Figure 89: Asia Pacific Market Attractiveness by Vehicle Type, 2022 to 2032

Figure 90: Asia Pacific Market Attractiveness by Country, 2022 to 2032

Figure 91: Middle East and Africa Market Value (US$ Million) by Application, 2022 to 2032

Figure 92: Middle East and Africa Market Value (US$ Million) by Vehicle Type, 2022 to 2032

Figure 93: Middle East and Africa Market Value (US$ Million) by Country, 2022 to 2032

Figure 94: Middle East and Africa Market Value (US$ Million) Analysis by Country, 2017 to 2032

Figure 95: Middle East and Africa Market Volume (Units) Analysis by Country, 2017 to 2032

Figure 96: Middle East and Africa Market Value Share (%) and BPS Analysis by Country, 2022 to 2032

Figure 97: Middle East and Africa Market Y-o-Y Growth (%) Projections by Country, 2022 to 2032

Figure 98: Middle East and Africa Market Value (US$ Million) Analysis by Application, 2017 to 2032

Figure 99: Middle East and Africa Market Volume (Units) Analysis by Application, 2017 to 2032

Figure 100: Middle East and Africa Market Value Share (%) and BPS Analysis by Application, 2022 to 2032

Figure 101: Middle East and Africa Market Y-o-Y Growth (%) Projections by Application, 2022 to 2032

Figure 102: Middle East and Africa Market Value (US$ Million) Analysis by Vehicle Type, 2017 to 2032

Figure 103: Middle East and Africa Market Volume (Units) Analysis by Vehicle Type, 2017 to 2032

Figure 104: Middle East and Africa Market Value Share (%) and BPS Analysis by Vehicle Type, 2022 to 2032

Figure 105: Middle East and Africa Market Y-o-Y Growth (%) Projections by Vehicle Type, 2022 to 2032

Figure 106: Middle East and Africa Market Attractiveness by Application, 2022 to 2032

Figure 107: Middle East and Africa Market Attractiveness by Vehicle Type, 2022 to 2032

Figure 108: Middle East and Africa Market Attractiveness by Country, 2022 to 2032

Recommendations

Technology

Traffic Management System Market

Published : April 2023

Industrial Automation

Traffic Signal Controller Market

Published : March 2023

Technology

Traffic Sensor Market

Published : October 2022

Packaging

Traffic Control Device Tape Market

Published : August 2022

Explore Automotive Insights

View Reports

Traffic Sign Recognition System Market