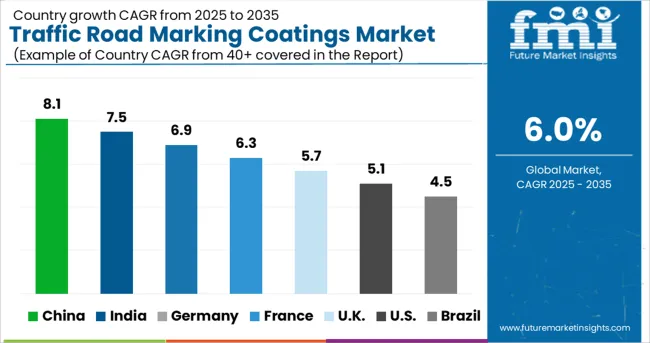
The Traffic Road Marking Coatings Market is estimated to be valued at USD 6.2 billion in 2025 and is projected to reach USD 11.1 billion by 2035, registering a compound annual growth rate (CAGR) of 6.0% over the forecast period.
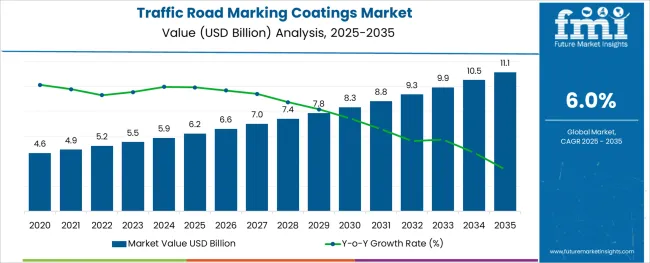
The traffic road marking coatings market is expanding steadily as urbanization and road infrastructure development accelerate worldwide. The need for durable and visible road markings to improve traffic safety and manage growing vehicle volumes has driven demand. Advances in coating technologies have enhanced durability and reflectivity, making road markings more effective under various weather and lighting conditions.
Increasing government investments in road maintenance and smart city initiatives support widespread application. Environmental regulations have also encouraged the adoption of coatings with lower volatile organic compound emissions.
Looking forward, growth is expected to be propelled by innovations in eco-friendly materials and expanding road networks in developing regions. Segment growth is anticipated to be led by thermoplastic coatings, the permanent type category, and road marking lines as the primary application.
The market is segmented by Product, Type, and Application and region. By Product, the market is divided into Thermoplastic, Paint, Preformed Polymer Tape, and Epoxy. In terms of Type, the market is classified into Permanent and Removable. Based on Application, the market is segmented into Road Marking Lines and Road Marking Labels. Regionally, the market is classified into North America, Latin America, Western Europe, Eastern Europe, Balkan & Baltic Countries, Russia & Belarus, Central Asia, East Asia, South Asia & Pacific, and the Middle East & Africa.
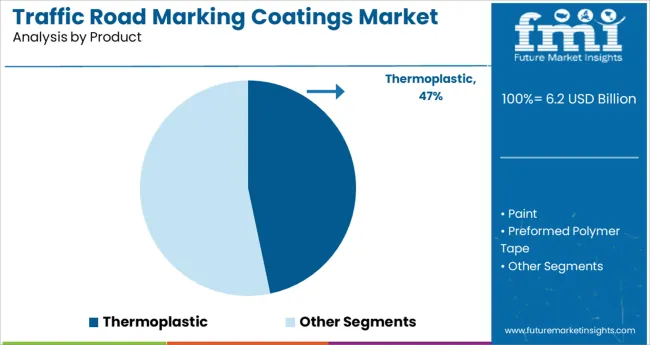
The thermoplastic product segment is projected to contribute 46.7% of the market revenue in 2025. This segment is favored for its quick application, fast drying time, and excellent durability. Thermoplastic coatings provide high visibility and strong adhesion to various road surfaces.
Their ability to withstand heavy traffic and harsh environmental conditions has made them the preferred choice for long-lasting road markings. Additionally, thermoplastic materials are recyclable and environmentally friendly compared to traditional paints.
The growing demand for sustainable infrastructure solutions further supports this segment’s expansion. As road safety standards tighten globally, thermoplastic coatings are expected to maintain their market dominance.
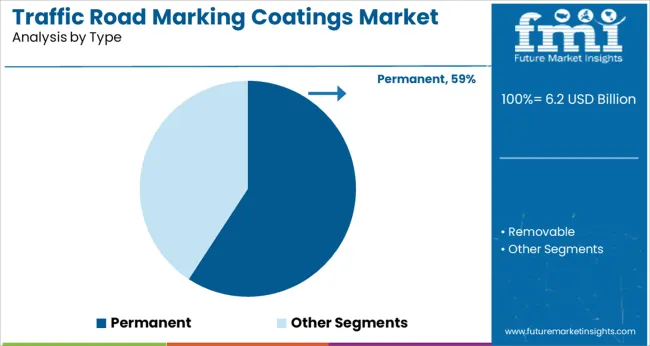
The permanent type segment holds 59.2% of the market revenue share in 2025, reflecting its broad use in long-term road marking applications. Permanent coatings are valued for their resistance to wear, weather, and UV exposure, ensuring that markings remain visible for extended periods.
Road authorities prefer permanent solutions to reduce maintenance costs and minimize traffic disruptions caused by frequent repainting. The segment’s growth has been reinforced by advancements that improve coating longevity without compromising application efficiency.
As infrastructure projects focus on sustainability and lifecycle cost savings, the demand for permanent road marking coatings is expected to grow steadily.
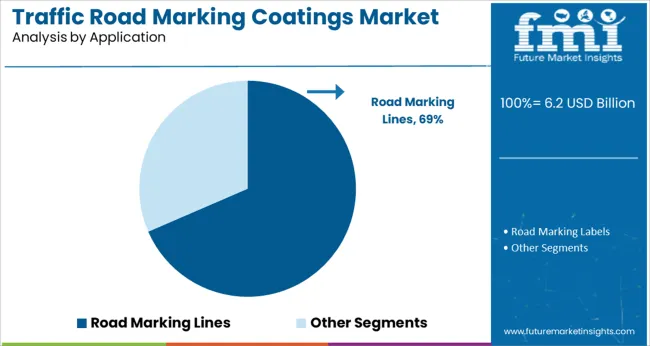
The road marking lines application segment is projected to account for 68.5% of the market revenue in 2025, establishing it as the dominant use case. Road marking lines are critical for traffic management, lane delineation, and pedestrian safety.
Increasing vehicular traffic and urban expansion have heightened the need for clear, durable lane markings. Investments in highway modernization and smart transportation systems have accelerated the application of advanced marking solutions.
The segment’s importance is further highlighted by regulatory mandates requiring high-visibility markings on public roads. With ongoing infrastructure upgrades worldwide, the road marking lines segment is poised to sustain its leading market position.
To ensure safe driving habits, sturdy and safe road constructions are crucial. The traffic road marking coatings market will develop as a result of rising government spending in creating better roads that are perfect for vulnerable road users and other factors. Plans to improve road connectivity between urban and rural areas are also anticipated to have a positive effect on the traffic road marking coatings market expansion.
Furthermore, the demand for improved and effective roofing and paving solutions has been greatly increased by the growing construction activity worldwide. One of the most effective and economical solutions for consumers in such situations is the use of thermoplastic coatings. The rise in sales of traffic road marking coatings is due to their excellent thermal stability, water-borne nature, and comparably cheaper price.
The traffic road marking coatings market's expansion is anticipated to be constrained by strict rules implemented by governmental bodies and organizations to regulate VOC emissions. To restrict VOC emissions from commercial items and businesses, for instance, France, Germany, and Belgium have passed rules and created ecolabel and grading systems as EMICODE, Blue Angel, M1, and others. The demand for traffic road marking coatings is anticipated to be hampered by this.
Due to its environmental friendliness, the traffic road marking coatings market's largest share belongs to the water-based coatings category. As per the traffic road marking coatings market study, these paints are also used extensively in building and infrastructure because they promote sustainability and energy efficiency. In public places, signs and boards are painted using standard paints. For instance, red signs are used to convey important information like speed restrictions and accident-prone regions, whereas temporary cautions are shown with yellow and orange paint.
Road marking lines were the most popular application category in 2024, accounting for a traffic road marking coatings market share of 55.1 percent. The need for road marking lines is anticipated to increase in the upcoming years due to the increasing use of these lines to direct vehicles on the road.
The marker designates the driving lane and the lateral space needed to move safely and without interruption on the road. It also functions as a tool for informing, directing, and cautioning drivers. This has changed the traffic road marking coatings market outlook.
While the Asia Pacific region is anticipated to experience the maximum growth during the projection period, Europe has emerged as the largest traffic road marking coatings market. The European Union Road Federation is actively doing research to create standardized guidelines as part of its ongoing efforts to reduce traffic fatalities.
In the upcoming years, it is anticipated that increased demand will result from the use of high-quality construction materials, safety precautions, training, and improved contractor oversight and increase the sales of traffic road marking coatings.
By 2035, the Middle East and Africa traffic road marking coatings market will experience significant growth as a consequence of the execution of significant highway projects and the region's keen focus on infrastructure development.
Under the leadership of SABIC, Saudi Aramco, and the Saudi Contractors Authority, important road projects in Saudi Arabia include the Dhahran-Al Batha route, which will be built to connect the Jubail and Dammam roads. These new developments are also expected to have a favorable impact on the regional traffic road marking coatings market dynamics throughout the foreseeable future, along with the country's rising runway construction for new airports.
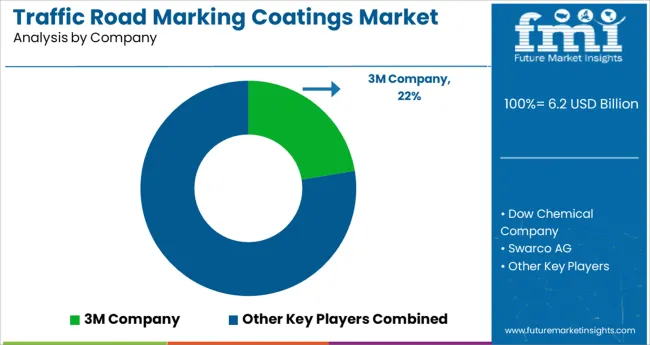
Manufacturers in the traffic road marking coatings market prioritize creating cutting-edge goods, such temperature-sensitive, durable, reflective paints. Manufacturers expect the traffic road marking coatings market to exhibit a high degree of forwarding integration in order to strengthen their position in the global market.
These companies use a variety of techniques to diversify their product offerings across the traffic road marking coatings market, including strategic product releases, acquisitions, and corporate expansions.
Following its acquisition of Ennis-Flint in January 2024, PPG developed the Traffic Solutions segment to manufacture and supply pavement-marking materials, including thermoplastics and paint, for clients in the commercial infrastructure and other sectors.
There have been many new innovations in the traffic road marking coatings market. The road marking sector will show off how much it is working on roads for the future at Traffex next month with a knee-high robot that marks white lines accurately and quickly, innovative paint that can deal with the road surface at level crossings, a ride-on road marker that resembles a Harley Davidson - but is silent, and new treatments that are durable, skid-resistant, and highly visible even on a wet night.
The process of "pre-marking" for road markings has not altered from the beginning; it is labor-intensive, hazardous, sluggish, and back-breaking. Here comes Roberta, the world's fastest pre-marking robot and a WJ PreMarker. It can fit in the boot of a vehicle or van because it only weighs 18kg. It can create centre lines and parking bays, and via a USB, it can mark out any other shape, including arrows, text, numbers, and even logos. It is entirely autonomous and uses GPS for navigation.
The global traffic road marking coatings market is estimated to be valued at USD 6.2 billion in 2025.
It is projected to reach USD 11.1 billion by 2035.
The market is expected to grow at a 6.0% CAGR between 2025 and 2035.
The key product types are thermoplastic, paint, preformed polymer tape and epoxy.
permanent segment is expected to dominate with a 59.2% industry share in 2025.


Full Research Suite comprises of:
Market outlook & trends analysis
Interviews & case studies
Strategic recommendations
Vendor profiles & capabilities analysis
5-year forecasts
8 regions and 60+ country-level data splits
Market segment data splits
12 months of continuous data updates
DELIVERED AS:
PDF EXCEL ONLINE
Traffic Sign Recognition System Market Size and Share Forecast Outlook 2025 to 2035
Traffic Control Device Tape Market Size and Share Forecast Outlook 2025 to 2035
Traffic Management System Market Analysis – Demand, Growth & Forecast 2025–2035
Traffic Sensors Market Growth – Trends & Forecast through 2034
Traffic Signal Controller Market
Air Traffic Management Market Size and Share Forecast Outlook 2025 to 2035
Air Traffic Industry Analysis in the Kingdom of Saudi Arabia 2025 to 2035
Air Traffic Control Equipment Market
Vessel Traffic Management Market Size and Share Forecast Outlook 2025 to 2035
Network Traffic Analytics Market Size and Share Forecast Outlook 2025 to 2035
Network Traffic Analysis Solutions Market Size and Share Forecast Outlook 2025 to 2035
Integrated Traffic System Market Size and Share Forecast Outlook 2025 to 2035
Intelligent Traffic Management Market Trends – Growth & Forecast 2024 to 2034
Automotive Rear Cross Traffic Alert Market Size and Share Forecast Outlook 2025 to 2035
Road Milling Machine Market Analysis and Opportunity Assessment in India Size and Share Forecast Outlook 2025 to 2035
Road Profile Laser Sensor Market Size and Share Forecast Outlook 2025 to 2035
Road Haulage Market Size and Share Forecast Outlook 2025 to 2035
Road Safety Market Size and Share Forecast Outlook 2025 to 2035
Road and Highway Infrastructure Market Size and Share Forecast Outlook 2025 to 2035
Road Speed Limiter Market Analysis - Size, Share, and Forecast Outlook 2025 to 2035

Thank you!
You will receive an email from our Business Development Manager. Please be sure to check your SPAM/JUNK folder too.
Chat With
MaRIA