Road Speed Limiter Market Outlook and Forecast 2025 to 2035

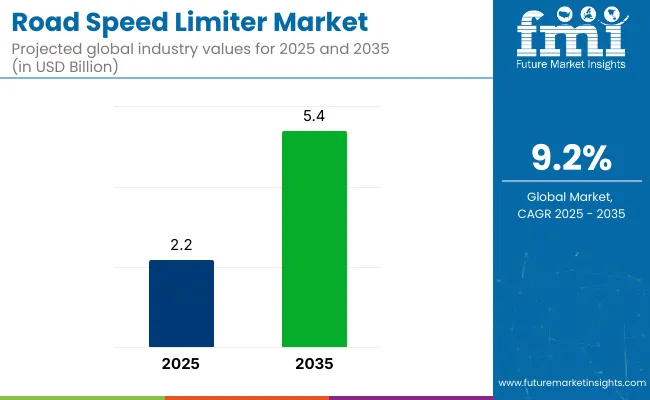
The global road speed limiter market is valued at USD 2.2 billion in 2025 and is slated to be worth USD 5.4 billion by 2035, reflecting a CAGR of 9.2%. Growth has been attributed to stricter speed-control regulations across major automotive regions, rising retrofit activities within commercial-fleet operators, and continuous technological upgrades particularly AI-enabled sign recognition, GPS geofencing, and over-the-air calibration, that enhanced compliance and reduced accident liability. Demand has further been supported by insurance incentives, national Vision-Zero road-safety programmes, and the broad integration of limiter modules into advanced driver-assistance system (ADAS) platforms at the OEM level.
Quick Stats of Road Speed Limiter Market

  • Market Value (2025): USD 2.2 billion
  • Forecast Value (2035): USD 5.4 billion
  • Forecast CAGR: 9.2%
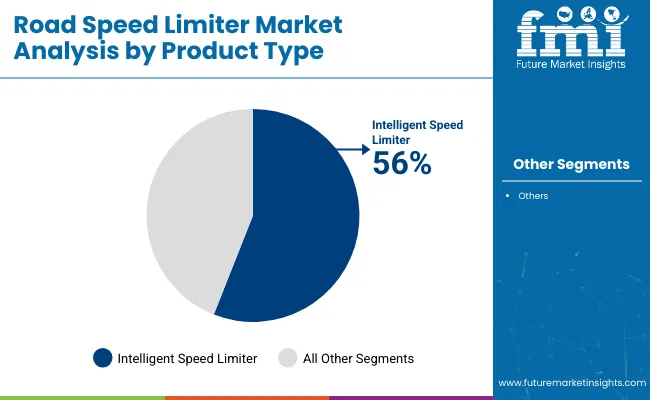
  • Product Leader in 2025: Intelligent Speed Limiters (56% market share)
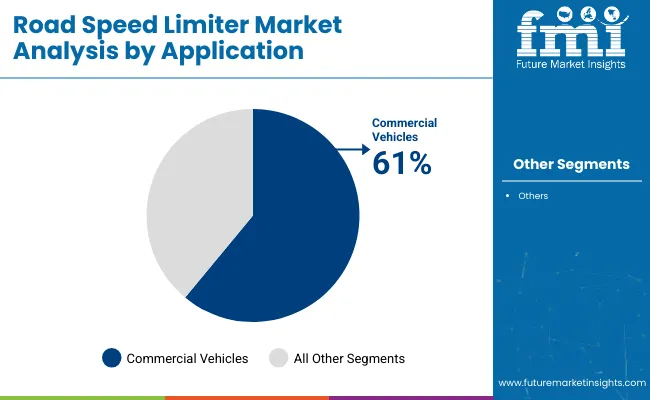
  • Top Application: Commercial Vehicles (61% share)
  • Key Growth Region: North America (USA is the fastest-growing market with 9.3% CAGR)

Road Speed Limiter Market

Metric Value
Market Size (2025) USD 2.2 Billion
Market Size (2035) USD 5.4 Billion
CAGR (2025 to 2035) 9.2%

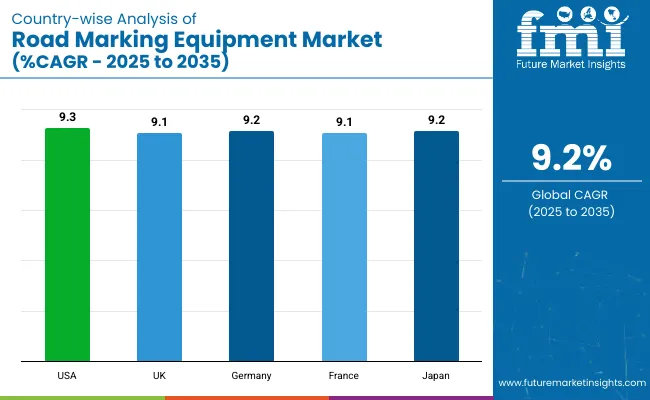
The USA is estimated to command the highest CAGR of 9.3%, underpinned by extensive trucking fleets and an early rollout of intelligent speed assistance regulations. The UK has been projected to expand at an estimated CAGR of approximately 9.1% over the 2025 to 2035 forecast period. Japanese market is set to grow at a 9.2% CAGR attributed to aggressive smart-mobility incentives. The commercial vehicles segment is estimated to command 61% of total installations in 2025.

AI-powered adaptive limiters that blend machine-learning analytics with IoT telemetry have been rolled out to predictively modulate speed in changing traffic and weather conditions. In addition, the ISA-FIT retrofit kit, combining camera-based sign recognition with a cloud-fed digital map layer, has been launched to upgrade legacy fleets cost-effectively to Intelligent Speed Assistance standards.

Analyzing Road Speed Limiter Market by Top Investment Segments

The road speed limiter market is segmented based on product type, application, sales channel, and region. By product type, the market is segmented into adjustable speed limiter and intelligent speed limiter. Based on application, the market is bifurcated into passenger vehicle (hatchback, sedan, SUV) and commercial vehicle (light commercial vehicle, heavy commercial vehicle, buses & coaches).

By sales channel, it is categorized into OEM and aftermarket. Regionally, the market is analyzed across North America, Latin America, Western Europe, Eastern Europe, East Asia, South Asia Pacific, Middle East and Africa.

Intelligent Speed Limiter to Lead the Product Type Segment with 56% Market Share

Intelligent speed limiters have been projected to lead the product-type segment, accounting for 56% of global market share in 2025. Demand has been driven by regulations that have mandated intelligent speed assistance (ISA), by OEM integration with advanced driver-assistance systems, and by fleet operators’ preference for telematics-ready devices that enable real-time compliance monitoring and data analytics.
  • Real-time road-sign recognition and GPS geofencing have been embedded, ensuring automatic speed adjustment without driver intervention.
  • Fleet telematics platforms have been integrated, allowing remote limiter calibration and performance reporting across large commercial fleets.
  • Over-the-air firmware updates have been enabled, keeping limiter algorithms aligned with evolving regulatory thresholds and improving long-term cost efficiency.

Road Speed Limiter Market Analysis By Product Type

Commercial Vehicles to Lead the Application Segment with 61% Market Share

Commercial vehicles have been projected to dominate the application landscape, securing approximately 61% of global road-speed-limiter demand by 2025 and reinforcing their revenue leadership through 2035.
  • Fleet-safety regulations and insurance incentives have been emphasised, resulting in mandatory limiter installation across heavy trucks, delivery vans, and public buses.
  • Integrated telematics platforms have been leveraged, enabling real-time monitoring of speed thresholds, limiter overrides, and driver behaviour across large commercial fleets.
  • Extended daily operating hours and higher accident-liability exposure have been recognised, making commercial vehicles the priority target for adaptive, data-driven speed-control solutions.

Road Speed Limiter Market Analysis By Application Type

OEM to Lead the Sales Channel with 70% Market Share

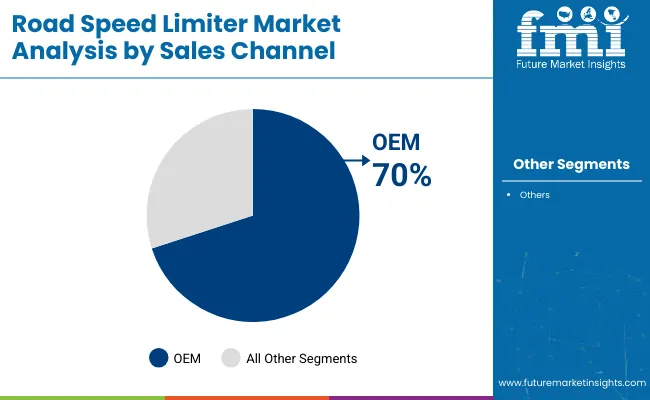
The OEM channel has been projected to secure about 70% of global revenue in 2025, because speed-limiter hardware is increasingly being embedded during vehicle assembly, ensuring immediate regulatory compliance and lowering lifecycle costs.
  • Factory integration with ADAS suites is being utilized, allowing seamless coupling of speed-limiter modules with lane-keeping and collision-avoidance functions.
  • Long-term service contracts and over-the-air firmware maintenance have been embedded, extending revenue streams beyond initial hardware installation.

Road Speed Limiter Market Analysis By Sales Channel

Road Speed Limiter Market Dynamics

Steady growth has been witnessed in the road speed limiter market, driven by increasingly stringent speed-control regulations, heightened fleet-safety initiatives, and the rapid integration of AI-enabled limiter modules with telematics platforms, which together have enhanced compliance monitoring and reduced accident liability while supporting cost-effective vehicle operation.

Recent Trends in the Road Speed Limiter Market

  • Mandatory EU Intelligent Speed Assistance adoption from July 2024 has been accelerating OEM-level limiter integration across new vehicle platforms.
  • A federal FMCSA rule slated for 2025 has been expected to impose speed limiters on USA heavy trucks, stimulating a sizeable retrofit wave.
  • AI-powered adaptive limiters blending camera input, HD maps, and IoT telemetry have been introduced, enabling predictive speed modulation under dynamic road conditions.
  • Comprehensive telematics suites have been intertwined with limiter hardware, providing fleets with real-time calibration, compliance dashboards, and analytics-driven fuel savings.

Challenges in the Road Speed Limiter Market
  • Installation outlays of USD 500-1,500 per vehicle have been cited as a deterrent for cost-sensitive operators.
  • Divergent regional standards have been complicating global certification and prolonging market entry cycles.
  • Driver push-back over perceived autonomy loss and privacy concerns has been slowing voluntary adoption in certain segments.
  • EU accuracy requirements mandating ≥ 90 % ISA precision have been raising R&D complexity and project budgets.

Analyzing Top Countries Manufacturing and Exporting Road Speed Limiters

Road Speed Limiter Market Country Wise Analysis

USA Road Speed Limiter Market Analysis

The USA road speed limiter market is expected to grow at a CAGR of 9.3% during the forecast period. Fleet-wide safety mandates, pending federal speed-limiter rulings, and rapid telematics penetration have been considered major growth catalysts.

  • Fleet-compliance investment has been amplified by national carriers.
  • Federal rulemaking has been anticipated by industry lobbyists.
  • Insurance premiums have been reduced for limiter-equipped trucks.
  • Real-time data analytics has been leveraged by telematics providers.
  • Class-8 production lines have been retrofitted with ISA modules.

Road Speed Limiter Sales Analysis in the UK

The UK road-speed-limiter revenues are projected to grow at a CAGR of 9.1% during 2025 to 2035. Post-Brexit regulatory alignment with EU ISA standards are being pursued and smart-city initiatives have been accelerated by local councils.

  • ISA retrofitting grants have been offered by local authorities.
  • Urban low-emission zones have been strengthened with speed caps.
  • Telematics dashboards have been standardized by national fleets.
  • Road-safety charities have been engaged for driver training.
  • Supply-chain delays have been mitigated by domestic electronics firms.

Germany Road Speed Limiter Market Analysis

German road speed limiter market is poised to grow at a CAGR of 9.2% during 2025 to 2035. Federal Vision-Zero targets have been embedded within transport policy, and OEM headquarters in Bavaria and Baden-Württemberg have integrated intelligent limiters into forthcoming model years.

  • Production capacity has been expanded by Tier-1 suppliers.
  • Automotive unions have been consulted on installer training.
  • Autobahn telematics infrastructure has been upgraded for geofencing.
  • Subsidised loans have been provided for bus retrofits.
  • Data-sharing standards have been codified by federal agencies.

Road Speed Limiter Demand Analysis in France

Sales of road speed limiter in France have been anticipated to grow at a CAGR of 9.1% during 2025 to 2035. National mobility orientation law provisions have mandated ISA adoption, and a broad school-zone speed-safety programme has been implemented. Public-transport operator RATP has commenced fleet-wide limiter retrofits, while regional agricultural cooperatives have embraced limiter technology to reduce accident-related downtime on rural distribution routes and bolster insurance cost-containment measures.

  • Government purchase rebates have been directed toward municipal fleets.
  • Data-privacy guidelines have been clarified for telematics exports.
  • Domestic Tier-2 suppliers have been consolidated for scale.
  • High-speed rail corridors have been targeted for geofencing trials.
  • Driver unions have been engaged to ease adoption concerns.

Road Speed Limiter Market Analysis in Japan

Japan road speed limiter industry has been estimated to grow at a CAGR of 9.2% during 2025 to 2035. Ageing-driver safety policies have spurred rapid adoption, and the Ministry of Land, Infrastructure, Transport and Tourism has issued guidance for ISA integration in new passenger vehicles.

  • Elderly-driver insurance surcharges have been softened via limiter adoption.
  • Smart-city pilots have been expanded in Osaka and Fukuoka.
  • High-resolution HD maps have been deployed for geofenced control.
  • Export opportunities have been leveraged by Tier-1 electronics integrators.
  • School-bus operators have been mandated to install ISA modules.

Leading Road Limiter Suppliers and Manufacturers

The competitive landscape of the road speed limiter industry has been assessed as moderately fragmented, because no single vendor has been able to command more than a 15% revenue share, although tier-one electronics majors such as Continental A.G. and Vodafone Automotive have been positioned ahead of a broad field of regional specialists.

Across the tier-one cohort, cost-per-vehicle has been compressed through platform standardization, whereas differentiation has been pursued by embedding intelligent-speed-assistance (ISA) algorithms, cloud analytics, and over-the-air calibration services. Continental has prioritized regulatory-compliant ISA stacks for EU General Safety Regulation II vehicles, Vodafone Automotive has leveraged its cellular footprint to bundle connectivity and stolen-vehicle recovery with limiter hardware, and Autograde International has focused on government-approved kits for high-growth African and Asian markets.

Recent Road Speed Limiter Industry News

  • In June 2025, Vodafone automotive entered a strategic alliance with Roadzen to launch a telematics-plus-GAP-insurance bundle across UK dealerships, with phased EU rollout planned.
  • In January 2024, Continental A.G. inked a deal with Aurora, finalizing design validation for an ISA-ready fallback system for autonomous trucks.

Road Speed Limiter Market Analysis by Top Investment Segments

Report Attributes Details
Current Total Market Size (2025) USD 2.2 billion
Projected Market Size (2035) USD 5.4 billion
CAGR (2025 to 2035) 9.2%
Base Year for Estimation 2024
Historical Period 2020 to 2024
Projections Period 2025 to 2035
Market Analysis Parameters Revenue in USD billions/Installations in million units
By Product Type Analyzed Adjustable Speed Limiter, Intelligent Speed Limiter
By Application Analyzed Passenger Vehicle, (Hatchback, Sedan, SUV), Commercial Vehicle, (Light Commercial Vehicle, Heavy Commercial Vehicle, Buses & Coaches)
By Sales Channel Analyzed OEM, Aftermarket
Regions Covered North America, Latin America, Western Europe, Eastern Europe, East Asia, South Asia Pacific, Middle East & Africa
Countries Covered United States, Canada, United Kingdom, Germany, France, China, Japan, South Korea, Brazil, Australia
Key Players Continental A.G., Vodafone Automotive, Autokontrol, AVS LTD., Elson GmbH, Highway Digital, SABO Electronic Technology, Autograde International, IMPCO Technologies, Pricol Ltd.
Additional Attributes Dollar sales by value, market share analysis by region, and country-wise analysis.

Key Segmentation

By Product Type:

  • Adjustable Speed Limiter
  • Intelligent Speed Limiter

By Application:

  • Passenger vehicle
    • Hatchback
    • Sedan
    • SUV
  • Commercial vehicle
    • Light commercial vehicle
    • Heavy commercial vehicle
    • Buses & coaches

By Sales Channel:

  • OEM
  • Aftermarket

By Region:

  • North America
  • Latin America
  • Western Europe
  • Eastern Europe
  • East Asia
  • South Asia Pacific
  • Middle East and Africa

Table of Content

  1. Executive Summary
    • Global Market Outlook
    • Demand-side Trends
    • Supply-side Trends
    • Technology Roadmap Analysis
    • Analysis and Recommendations
  2. Market Overview
    • Market Coverage / Taxonomy
    • Market Definition / Scope / Limitations
  3. Market Background
    • Market Dynamics
      • Drivers
      • Restraints
      • Opportunity
      • Trends
    • Scenario Forecast
      • Demand in Optimistic Scenario
      • Demand in Likely Scenario
      • Demand in Conservative Scenario
    • Opportunity Map Analysis
    • Product Life Cycle Analysis
    • Supply Chain Analysis
      • Supply Side Participants and their Roles
        • Producers
        • Mid-Level Participants (Traders/ Agents/ Brokers)
        • Wholesalers and Distributors
      • Value Added and Value Created at Node in the Supply Chain
      • List of Raw Material Suppliers
      • List of Existing and Potential Buyer’s
    • Investment Feasibility Matrix
    • Value Chain Analysis
      • Profit Margin Analysis
      • Wholesalers and Distributors
      • Retailers
    • PESTLE and Porter’s Analysis
    • Regulatory Landscape
      • By Key Regions
      • By Key Countries
    • Regional Parent Market Outlook
    • Production and Consumption Statistics
    • Import and Export Statistics
  4. Global Market Analysis 2020 to 2024 and Forecast, 2025 to 2035
    • Historical Market Size Value (USD Billion) & Volume (Units) Analysis, 2020 to 2024
    • Current and Future Market Size Value (USD Billion) & Volume (Units) Projections, 2025 to 2035
      • Y-o-Y Growth Trend Analysis
      • Absolute $ Opportunity Analysis
  5. Global Market Pricing Analysis 2020 to 2024 and Forecast 2025 to 2035
  6. Global Market Analysis 2020 to 2024 and Forecast 2025 to 2035, By Product Type
    • Introduction / Key Findings
    • Historical Market Size Value (USD Billion) & Volume (Units) Analysis By Product Type, 2020 to 2024
    • Current and Future Market Size Value (USD Billion) & Volume (Units) Analysis and Forecast By Product Type, 2025 to 2035
      • Adjustable Speed Limiter
      • Intelligent Speed Limiter
    • Y-o-Y Growth Trend Analysis By Product Type, 2020 to 2024
    • Absolute $ Opportunity Analysis By Product Type, 2025 to 2035
  7. Global Market Analysis 2020 to 2024 and Forecast 2025 to 2035, By Application
    • Introduction / Key Findings
    • Historical Market Size Value (USD Billion) & Volume (Units) Analysis By Application, 2020 to 2024
    • Current and Future Market Size Value (USD Billion) & Volume (Units) Analysis and Forecast By Application, 2025 to 2035
      • Passenger Vehicle
        • Hatchback
        • Sedan
        • SUV
      • Commercial vehicle
        • Light Commercial Vehicle
        • Heavy Commercial Vehicle
        • Buses & Coaches
    • Y-o-Y Growth Trend Analysis By Application, 2020 to 2024
    • Absolute $ Opportunity Analysis By Application, 2025 to 2035
  8. Global Market Analysis 2020 to 2024 and Forecast 2025 to 2035, By Sales Channel
    • Introduction / Key Findings
    • Historical Market Size Value (USD Billion) & Volume (Units) Analysis By Sales Channel, 2020 to 2024
    • Current and Future Market Size Value (USD Billion) & Volume (Units) Analysis and Forecast By Sales Channel, 2025 to 2035
      • OEM
      • Aftermarket
    • Y-o-Y Growth Trend Analysis By Sales Channel, 2020 to 2024
    • Absolute $ Opportunity Analysis By Sales Channel, 2025 to 2035
  9. Global Market Analysis 2020 to 2024 and Forecast 2025 to 2035, By Region
    • Introduction
    • Historical Market Size Value (USD Billion) & Volume (Units) Analysis By Region, 2020 to 2024
    • Current Market Size Value (USD Billion) & Volume (Units) Analysis and Forecast By Region, 2025 to 2035
      • North America
      • Latin America
      • Western Europe
      • Eastern Europe
      • East Asia
      • South Asia & Pacific
      • Middle East and Africa
    • Market Attractiveness Analysis By Region
  10. North America Market Analysis 2020 to 2024 and Forecast 2025 to 2035, By Country
    • Historical Market Size Value (USD Billion) & Volume (Units) Trend Analysis By Market Taxonomy, 2020 to 2024
    • Market Size Value (USD Billion) & Volume (Units) Forecast By Market Taxonomy, 2025 to 2035
      • By Country
        • USA
        • Canada
        • Mexico
      • By Product Type
      • By Application
      • By Sales Channel
    • Market Attractiveness Analysis
      • By Country
      • By Product Type
      • By Application
      • By Sales Channel
    • Key Takeaways
  11. Latin America Market Analysis 2020 to 2024 and Forecast 2025 to 2035, By Country
    • Historical Market Size Value (USD Billion) & Volume (Units) Trend Analysis By Market Taxonomy, 2020 to 2024
    • Market Size Value (USD Billion) & Volume (Units) Forecast By Market Taxonomy, 2025 to 2035
      • By Country
        • Brazil
        • Argentina
        • Rest of LATAM
      • By Product Type
      • By Application
      • By Sales Channel
    • Market Attractiveness Analysis
      • By Country
      • By Product Type
      • By Application
      • By Sales Channel
    • Key Takeaways
  12. Western Europe Market Analysis 2020 to 2024 and Forecast 2025 to 2035, By Country
    • Historical Market Size Value (USD Billion) & Volume (Units) Trend Analysis By Market Taxonomy, 2020 to 2024
    • Market Size Value (USD Billion) & Volume (Units) Forecast By Market Taxonomy, 2025 to 2035
      • By Country
        • Germany
        • Italy
        • France
        • UK
        • Spain
        • BENELUX
        • Nordic
        • Rest of W.Europe
      • By Product Type
      • By Application
      • By Sales Channel
    • Market Attractiveness Analysis
      • By Country
      • By Product Type
      • By Application
      • By Sales Channel
    • Key Takeaways
  13. Eastern Europe Market Analysis 2020 to 2024 and Forecast 2025 to 2035, By Country
    • Historical Market Size Value (USD Billion) & Volume (Units) Trend Analysis By Market Taxonomy, 2020 to 2024
    • Market Size Value (USD Billion) & Volume (Units) Forecast By Market Taxonomy, 2025 to 2035
      • By Country
        • Russia
        • Hungary
        • Poland
        • Balkan & Baltics
        • Rest of E. Europe
      • By Product Type
      • By Application
      • By Sales Channel
    • Market Attractiveness Analysis
      • By Country
      • By Product Type
      • By Application
      • By Sales Channel
    • Key Takeaways
  14. East Asia Market Analysis 2020 to 2024 and Forecast 2025 to 2035, By Country
    • Historical Market Size Value (USD Billion) & Volume (Units) Trend Analysis By Market Taxonomy, 2020 to 2024
    • Market Size Value (USD Billion) & Volume (Units) Forecast By Market Taxonomy, 2025 to 2035
      • By Country
        • China
        • Japan
        • South Korea
      • By Product Type
      • By Application
      • By Sales Channel
    • Market Attractiveness Analysis
      • By Country
      • By Product Type
      • By Application
      • By Sales Channel
    • Key Takeaways
  15. South Asia & Pacific Market Analysis 2020 to 2024 and Forecast 2025 to 2035, By Country
    • Historical Market Size Value (USD Billion) & Volume (Units) Trend Analysis By Market Taxonomy, 2020 to 2024
    • Market Size Value (USD Billion) & Volume (Units) Forecast By Market Taxonomy, 2025 to 2035
      • By Country
        • India
        • Australia & New Zealand
        • ASEAN
        • Rest of SAP
      • By Product Type
      • By Application
      • By Sales Channel
    • Market Attractiveness Analysis
      • By Country
      • By Product Type
      • By Application
      • By Sales Channel
    • Key Takeaways
  16. Middle East and Africa Market Analysis 2020 to 2024 and Forecast 2025 to 2035, By Country
    • Historical Market Size Value (USD Billion) & Volume (Units) Trend Analysis By Market Taxonomy, 2020 to 2024
    • Market Size Value (USD Billion) & Volume (Units) Forecast By Market Taxonomy, 2025 to 2035
      • By Country
        • GCC Countries
        • Northern Africa
        • South Africa
        • Turkiye
        • Rest of MEA
      • By Product Type
      • By Application
      • By Sales Channel
    • Market Attractiveness Analysis
      • By Country
      • By Product Type
      • By Application
      • By Sales Channel
    • Key Takeaways
  17. Key Countries Market Analysis
    • USA
      • Pricing Analysis
      • Market Share Analysis, 2024
        • By Product Type
        • By Application
        • By Sales Channel
    • Canada
      • Pricing Analysis
      • Market Share Analysis, 2024
        • By Product Type
        • By Application
        • By Sales Channel
    • Brazil
      • Pricing Analysis
      • Market Share Analysis, 2024
        • By Product Type
        • By Application
        • By Sales Channel
    • Mexico
      • Pricing Analysis
      • Market Share Analysis, 2024
        • By Product Type
        • By Application
        • By Sales Channel
    • Argentina
      • Pricing Analysis
      • Market Share Analysis, 2024
        • By Product Type
        • By Application
        • By Sales Channel
  18. Market Structure Analysis
    • Competition Dashboard
    • Competition Benchmarking
    • Market Share Analysis of Top Players
      • By Regional
      • By Product Type
      • By Application
      • By Sales Channel
  19. Competition Analysis
    • Competition Deep Dive
      • Continental A.G.
        • Overview
        • Product Portfolio
        • Profitability by Market Segments (Product/Age /Sales Channel/Region)
        • Sales Footprint
        • Strategy Overview
          • Marketing Strategy
          • Product Strategy
          • Channel Strategy
      • Vodafone Automotive
        • Overview
        • Product Portfolio
        • Profitability by Market Segments (Product/Age /Sales Channel/Region)
        • Sales Footprint
        • Strategy Overview
          • Marketing Strategy
          • Product Strategy
          • Channel Strategy
      • Autokontrol
        • Overview
        • Product Portfolio
        • Profitability by Market Segments (Product/Age /Sales Channel/Region)
        • Sales Footprint
        • Strategy Overview
          • Marketing Strategy
          • Product Strategy
          • Channel Strategy
      • AVS LTD.
        • Overview
        • Product Portfolio
        • Profitability by Market Segments (Product/Age /Sales Channel/Region)
        • Sales Footprint
        • Strategy Overview
          • Marketing Strategy
          • Product Strategy
          • Channel Strategy
      • Elson GmbH
        • Overview
        • Product Portfolio
        • Profitability by Market Segments (Product/Age /Sales Channel/Region)
        • Sales Footprint
        • Strategy Overview
          • Marketing Strategy
          • Product Strategy
          • Channel Strategy
      • Highway Digital
        • Overview
        • Product Portfolio
        • Profitability by Market Segments (Product/Age /Sales Channel/Region)
        • Sales Footprint
        • Strategy Overview
          • Marketing Strategy
          • Product Strategy
          • Channel Strategy
      • SABO Electronic Technology
        • Overview
        • Product Portfolio
        • Profitability by Market Segments (Product/Age /Sales Channel/Region)
        • Sales Footprint
        • Strategy Overview
          • Marketing Strategy
          • Product Strategy
          • Channel Strategy
      • Autograde International
        • Overview
        • Product Portfolio
        • Profitability by Market Segments (Product/Age /Sales Channel/Region)
        • Sales Footprint
        • Strategy Overview
          • Marketing Strategy
          • Product Strategy
          • Channel Strategy
      • IMPCO Technologies
        • Overview
        • Product Portfolio
        • Profitability by Market Segments (Product/Age /Sales Channel/Region)
        • Sales Footprint
        • Strategy Overview
          • Marketing Strategy
          • Product Strategy
          • Channel Strategy
      • Pricol Ltd.
        • Overview
        • Product Portfolio
        • Profitability by Market Segments (Product/Age /Sales Channel/Region)
        • Sales Footprint
        • Strategy Overview
          • Marketing Strategy
          • Product Strategy
          • Channel Strategy
  20. Assumptions & Acronyms Used
  21. Research Methodology

List of Tables

  • Table 1: Global Market Value (USD Billion) Forecast by Region, 2020-2035
  • Table 2: Global Market Volume (Units) Forecast by Region, 2020-2035
  • Table 3: Global Market Value (USD Billion) Forecast by Product Type, 2020-2035
  • Table 4: Global Market Volume (Units) Forecast by Product Type, 2020-2035
  • Table 5: Global Market Value (USD Billion) Forecast by Application, 2020-2035
  • Table 6: Global Market Volume (Units) Forecast by Application, 2020-2035
  • Table 7: Global Market Value (USD Billion) Forecast by Sales Channel, 2020-2035
  • Table 8: Global Market Volume (Units) Forecast by Sales Channel, 2020-2035
  • Table 9: North America Market Value (USD Billion) Forecast by Country, 2020-2035
  • Table 10: North America Market Volume (Units) Forecast by Country, 2020-2035
  • Table 11: North America Market Value (USD Billion) Forecast by Product Type, 2020-2035
  • Table 12: North America Market Volume (Units) Forecast by Product Type, 2020-2035
  • Table 13: North America Market Value (USD Billion) Forecast by Application, 2020-2035
  • Table 14: North America Market Volume (Units) Forecast by Application, 2020-2035
  • Table 15: North America Market Value (USD Billion) Forecast by Sales Channel, 2020-2035
  • Table 16: North America Market Volume (Units) Forecast by Sales Channel, 2020-2035
  • Table 17: Latin America Market Value (USD Billion) Forecast by Country, 2020-2035
  • Table 18: Latin America Market Volume (Units) Forecast by Country, 2020-2035
  • Table 19: Latin America Market Value (USD Billion) Forecast by Product Type, 2020-2035
  • Table 20: Latin America Market Volume (Units) Forecast by Product Type, 2020-2035
  • Table 21: Latin America Market Value (USD Billion) Forecast by Application, 2020-2035
  • Table 22: Latin America Market Volume (Units) Forecast by Application, 2020-2035
  • Table 23: Latin America Market Value (USD Billion) Forecast by Sales Channel, 2020-2035
  • Table 24: Latin America Market Volume (Units) Forecast by Sales Channel, 2020-2035
  • Table 25: Western Europe Market Value (USD Billion) Forecast by Country, 2020-2035
  • Table 26: Western Europe Market Volume (Units) Forecast by Country, 2020-2035
  • Table 27: Western Europe Market Value (USD Billion) Forecast by Product Type, 2020-2035
  • Table 28: Western Europe Market Volume (Units) Forecast by Product Type, 2020-2035
  • Table 29: Western Europe Market Value (USD Billion) Forecast by Application, 2020-2035
  • Table 30: Western Europe Market Volume (Units) Forecast by Application, 2020-2035
  • Table 31: Western Europe Market Value (USD Billion) Forecast by Sales Channel, 2020-2035
  • Table 32: Western Europe Market Volume (Units) Forecast by Sales Channel, 2020-2035
  • Table 33: Eastern Europe Market Value (USD Billion) Forecast by Country, 2020-2035
  • Table 34: Eastern Europe Market Volume (Units) Forecast by Country, 2020-2035
  • Table 35: Eastern Europe Market Value (USD Billion) Forecast by Product Type, 2020-2035
  • Table 36: Eastern Europe Market Volume (Units) Forecast by Product Type, 2020-2035
  • Table 37: Eastern Europe Market Value (USD Billion) Forecast by Application, 2020-2035
  • Table 38: Eastern Europe Market Volume (Units) Forecast by Application, 2020-2035
  • Table 39: Eastern Europe Market Value (USD Billion) Forecast by Sales Channel, 2020-2035
  • Table 40: Eastern Europe Market Volume (Units) Forecast by Sales Channel, 2020-2035
  • Table 41: East Asia Market Value (USD Billion) Forecast by Country, 2020-2035
  • Table 42: East Asia Market Volume (Units) Forecast by Country, 2020-2035
  • Table 43: East Asia Market Value (USD Billion) Forecast by Product Type, 2020-2035
  • Table 44: East Asia Market Volume (Units) Forecast by Product Type, 2020-2035
  • Table 45: East Asia Market Value (USD Billion) Forecast by Application, 2020-2035
  • Table 46: East Asia Market Volume (Units) Forecast by Application, 2020-2035
  • Table 47: East Asia Market Value (USD Billion) Forecast by Sales Channel, 2020-2035
  • Table 48: East Asia Market Volume (Units) Forecast by Sales Channel, 2020-2035
  • Table 49: South Asia & Pacific Market Value (USD Billion) Forecast by Country, 2020-2035
  • Table 50: South Asia & Pacific Market Volume (Units) Forecast by Country, 2020-2035
  • Table 51: South Asia & Pacific Market Value (USD Billion) Forecast by Product Type, 2020-2035
  • Table 52: South Asia & Pacific Market Volume (Units) Forecast by Product Type, 2020-2035
  • Table 53: South Asia & Pacific Market Value (USD Billion) Forecast by Application, 2020-2035
  • Table 54: South Asia & Pacific Market Volume (Units) Forecast by Application, 2020-2035
  • Table 55: South Asia & Pacific Market Value (USD Billion) Forecast by Sales Channel, 2020-2035
  • Table 56: South Asia & Pacific Market Volume (Units) Forecast by Sales Channel, 2020-2035
  • Table 57: Middle East and Africa Market Value (USD Billion) Forecast by Country, 2020-2035
  • Table 58: Middle East and Africa Market Volume (Units) Forecast by Country, 2020-2035
  • Table 59: Middle East and Africa Market Value (USD Billion) Forecast by Product Type, 2020-2035
  • Table 60: Middle East and Africa Market Volume (Units) Forecast by Product Type, 2020-2035
  • Table 61: Middle East and Africa Market Value (USD Billion) Forecast by Application, 2020-2035
  • Table 62: Middle East and Africa Market Volume (Units) Forecast by Application, 2020-2035
  • Table 63: Middle East and Africa Market Value (USD Billion) Forecast by Sales Channel, 2020-2035
  • Table 64: Middle East and Africa Market Volume (Units) Forecast by Sales Channel, 2020-2035

List of Figures

  • Figure 1: Global Market Volume (Units) Forecast 2020-2035
  • Figure 2: Global Market Pricing Analysis
  • Figure 3: Global Market Value (USD Billion) Forecast 2020-2035
  • Figure 4: Global Market Value Share and BPS Analysis by Product Type, 2025 and 2035
  • Figure 5: Global Market Y-o-Y Growth Comparison by Product Type, 2025-2035
  • Figure 6: Global Market Attractiveness Analysis by Product Type
  • Figure 7: Global Market Value Share and BPS Analysis by Application, 2025 and 2035
  • Figure 8: Global Market Y-o-Y Growth Comparison by Application, 2025-2035
  • Figure 9: Global Market Attractiveness Analysis by Application
  • Figure 10: Global Market Value Share and BPS Analysis by Sales Channel, 2025 and 2035
  • Figure 11: Global Market Y-o-Y Growth Comparison by Sales Channel, 2025-2035
  • Figure 12: Global Market Attractiveness Analysis by Sales Channel
  • Figure 13: Global Market Value (USD Billion) Share and BPS Analysis by Region, 2025 and 2035
  • Figure 14: Global Market Y-o-Y Growth Comparison by Region, 2025-2035
  • Figure 15: Global Market Attractiveness Analysis by Region
  • Figure 16: North America Market Incremental $ Opportunity, 2025-2035
  • Figure 17: Latin America Market Incremental $ Opportunity, 2025-2035
  • Figure 18: Western Europe Market Incremental $ Opportunity, 2025-2035
  • Figure 19: Eastern Europe Market Incremental $ Opportunity, 2025-2035
  • Figure 20: East Asia Market Incremental $ Opportunity, 2025-2035
  • Figure 21: South Asia & Pacific Market Incremental $ Opportunity, 2025-2035
  • Figure 22: Middle East and Africa Market Incremental $ Opportunity, 2025-2035
  • Figure 23: North America Market Value Share and BPS Analysis by Country, 2025 and 2035
  • Figure 24: North America Market Value Share and BPS Analysis by Product Type, 2025 and 2035
  • Figure 25: North America Market Y-o-Y Growth Comparison by Product Type, 2025-2035
  • Figure 26: North America Market Attractiveness Analysis by Product Type
  • Figure 27: North America Market Value Share and BPS Analysis by Application, 2025 and 2035
  • Figure 28: North America Market Y-o-Y Growth Comparison by Application, 2025-2035
  • Figure 29: North America Market Attractiveness Analysis by Application
  • Figure 30: North America Market Value Share and BPS Analysis by Sales Channel, 2025 and 2035
  • Figure 31: North America Market Y-o-Y Growth Comparison by Sales Channel, 2025-2035
  • Figure 32: North America Market Attractiveness Analysis by Sales Channel
  • Figure 33: Latin America Market Value Share and BPS Analysis by Country, 2025 and 2035
  • Figure 34: Latin America Market Value Share and BPS Analysis by Product Type, 2025 and 2035
  • Figure 35: Latin America Market Y-o-Y Growth Comparison by Product Type, 2025-2035
  • Figure 36: Latin America Market Attractiveness Analysis by Product Type
  • Figure 37: Latin America Market Value Share and BPS Analysis by Application, 2025 and 2035
  • Figure 38: Latin America Market Y-o-Y Growth Comparison by Application, 2025-2035
  • Figure 39: Latin America Market Attractiveness Analysis by Application
  • Figure 40: Latin America Market Value Share and BPS Analysis by Sales Channel, 2025 and 2035
  • Figure 41: Latin America Market Y-o-Y Growth Comparison by Sales Channel, 2025-2035
  • Figure 42: Latin America Market Attractiveness Analysis by Sales Channel
  • Figure 43: Western Europe Market Value Share and BPS Analysis by Country, 2025 and 2035
  • Figure 44: Western Europe Market Value Share and BPS Analysis by Product Type, 2025 and 2035
  • Figure 45: Western Europe Market Y-o-Y Growth Comparison by Product Type, 2025-2035
  • Figure 46: Western Europe Market Attractiveness Analysis by Product Type
  • Figure 47: Western Europe Market Value Share and BPS Analysis by Application, 2025 and 2035
  • Figure 48: Western Europe Market Y-o-Y Growth Comparison by Application, 2025-2035
  • Figure 49: Western Europe Market Attractiveness Analysis by Application
  • Figure 50: Western Europe Market Value Share and BPS Analysis by Sales Channel, 2025 and 2035
  • Figure 51: Western Europe Market Y-o-Y Growth Comparison by Sales Channel, 2025-2035
  • Figure 52: Western Europe Market Attractiveness Analysis by Sales Channel
  • Figure 53: Eastern Europe Market Value Share and BPS Analysis by Country, 2025 and 2035
  • Figure 54: Eastern Europe Market Value Share and BPS Analysis by Product Type, 2025 and 2035
  • Figure 55: Eastern Europe Market Y-o-Y Growth Comparison by Product Type, 2025-2035
  • Figure 56: Eastern Europe Market Attractiveness Analysis by Product Type
  • Figure 57: Eastern Europe Market Value Share and BPS Analysis by Application, 2025 and 2035
  • Figure 58: Eastern Europe Market Y-o-Y Growth Comparison by Application, 2025-2035
  • Figure 59: Eastern Europe Market Attractiveness Analysis by Application
  • Figure 60: Eastern Europe Market Value Share and BPS Analysis by Sales Channel, 2025 and 2035
  • Figure 61: Eastern Europe Market Y-o-Y Growth Comparison by Sales Channel, 2025-2035
  • Figure 62: Eastern Europe Market Attractiveness Analysis by Sales Channel
  • Figure 63: East Asia Market Value Share and BPS Analysis by Country, 2025 and 2035
  • Figure 64: East Asia Market Value Share and BPS Analysis by Product Type, 2025 and 2035
  • Figure 65: East Asia Market Y-o-Y Growth Comparison by Product Type, 2025-2035
  • Figure 66: East Asia Market Attractiveness Analysis by Product Type
  • Figure 67: East Asia Market Value Share and BPS Analysis by Application, 2025 and 2035
  • Figure 68: East Asia Market Y-o-Y Growth Comparison by Application, 2025-2035
  • Figure 69: East Asia Market Attractiveness Analysis by Application
  • Figure 70: East Asia Market Value Share and BPS Analysis by Sales Channel, 2025 and 2035
  • Figure 71: East Asia Market Y-o-Y Growth Comparison by Sales Channel, 2025-2035
  • Figure 72: East Asia Market Attractiveness Analysis by Sales Channel
  • Figure 73: South Asia & Pacific Market Value Share and BPS Analysis by Country, 2025 and 2035
  • Figure 74: South Asia & Pacific Market Value Share and BPS Analysis by Product Type, 2025 and 2035
  • Figure 75: South Asia & Pacific Market Y-o-Y Growth Comparison by Product Type, 2025-2035
  • Figure 76: South Asia & Pacific Market Attractiveness Analysis by Product Type
  • Figure 77: South Asia & Pacific Market Value Share and BPS Analysis by Application, 2025 and 2035
  • Figure 78: South Asia & Pacific Market Y-o-Y Growth Comparison by Application, 2025-2035
  • Figure 79: South Asia & Pacific Market Attractiveness Analysis by Application
  • Figure 80: South Asia & Pacific Market Value Share and BPS Analysis by Sales Channel, 2025 and 2035
  • Figure 81: South Asia & Pacific Market Y-o-Y Growth Comparison by Sales Channel, 2025-2035
  • Figure 82: South Asia & Pacific Market Attractiveness Analysis by Sales Channel
  • Figure 83: Middle East and Africa Market Value Share and BPS Analysis by Country, 2025 and 2035
  • Figure 84: Middle East and Africa Market Value Share and BPS Analysis by Product Type, 2025 and 2035
  • Figure 85: Middle East and Africa Market Y-o-Y Growth Comparison by Product Type, 2025-2035
  • Figure 86: Middle East and Africa Market Attractiveness Analysis by Product Type
  • Figure 87: Middle East and Africa Market Value Share and BPS Analysis by Application, 2025 and 2035
  • Figure 88: Middle East and Africa Market Y-o-Y Growth Comparison by Application, 2025-2035
  • Figure 89: Middle East and Africa Market Attractiveness Analysis by Application
  • Figure 90: Middle East and Africa Market Value Share and BPS Analysis by Sales Channel, 2025 and 2035
  • Figure 91: Middle East and Africa Market Y-o-Y Growth Comparison by Sales Channel, 2025-2035
  • Figure 92: Middle East and Africa Market Attractiveness Analysis by Sales Channel
  • Figure 93: Global Market - Tier Structure Analysis
  • Figure 94: Global Market - Company Share Analysis

Frequently Asked Questions

What is the global road speed limiter market size in 2025?

The market is valued at USD 2.2 billion in 2025.

How large is the road speed limiter market expected to be by 2035?

The market has been projected to reach USD 5.4 billion by 2035.

What CAGR will the road speed limiter market register between 2025 and 2035?

A CAGR of 9.2% has been projected for the road speed limiter market over the 2025-2035 period.

Which product type is anticipated to lead road speed limiter market by revenue in 2025?

The intelligent speed limiter segment has been expected to command 56% of the highest share.

Which application is projected to generate the greatest demand in road speed limiter market?

Commercial vehicles have been forecast to contribute the largest installation base.

Explore Similar Insights

Future Market Insights

Road Speed Limiter Market