Road Marking Equipment Market Outlook and Forecast 2025 to 2035

The global road marking equipment market is valued at USD 1.5 billion in 2025 and is anticipated to grow to USD 2.6 billion by 2035, which shows a CAGR of 5.9% during the forecast period. Market expansion is expected to be underpinned by rising public-sector outlays on highway upgrades, stringent visibility mandates embedded in traffic-safety legislation, accelerated urbanisation that is intensifying lane-capacity projects. The ongoing rollout of smart-city programmes in which machine-readable road markings are specified as foundational infrastructure.
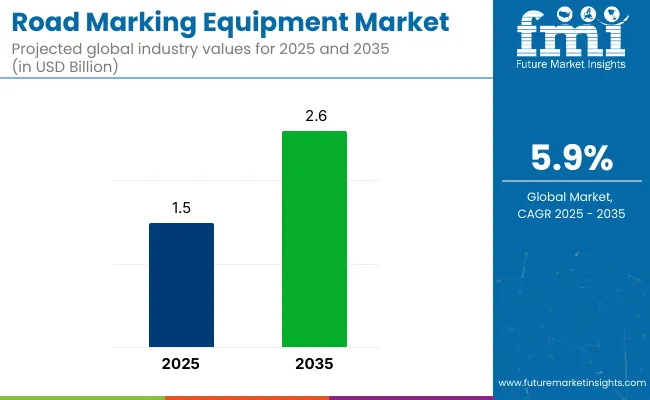
Quick Stats of Road Marking Equipment Market

  • Market Value (2025): USD 1.5 billion
  • Forecast Value (2035): USD 2.6 billion
  • Forecast CAGR: 5.9%
  • Type Leader in 2025: Truck Mounted (80% market share)
  • Top End Use Segment: Road Construction Contractors (64.6% market share)
  • Key Growth Region: East Asia (Japan is the fastest-growing market with 6.7% CAGR)

Road Marking Equipment Market

Metric Value
Market Value (2025) USD 1.5 billion
Forecast Value (2035) USD 2.6 billion
CAGR (2025 to 2035) 5.9%

Adoption is being further encouraged by contractor preference for truck-mounted and laser-guided stripers that shorten lane-closure windows, while maintenance budgets are being supported by performance-based tendering that rewards higher retro-reflectivity retention. In parallel, eco-label requirements are being strengthened, so demand is being shifted toward low-VOC thermoplastic and cold-spray systems, and regional manufacturing incentives are being applied to offset raw-material volatility and stabilise equipment pricing.

Government regulations in this market focus on safety, visibility, and environmental standards. These regulations include stringent visibility mandates, such as the Manual on Uniform Traffic Control Devices (MUTCD) in the USA, which sets standards for retro reflectivity and lane markings.

In Europe, the EU enforces eco-label requirements, promoting low-VOC thermoplastic and cold-spray systems. Additionally, governments are emphasizing sustainability, pushing for reduced emissions and compliance with road safety standards.

The USA is expected to be one of the fastest-growing markets for road marking equipment, with a projected CAGR of 5.5% from 2025 to 2035. Truck-mounted equipment will dominate the type segment, capturing 80% of the market share in 2025.

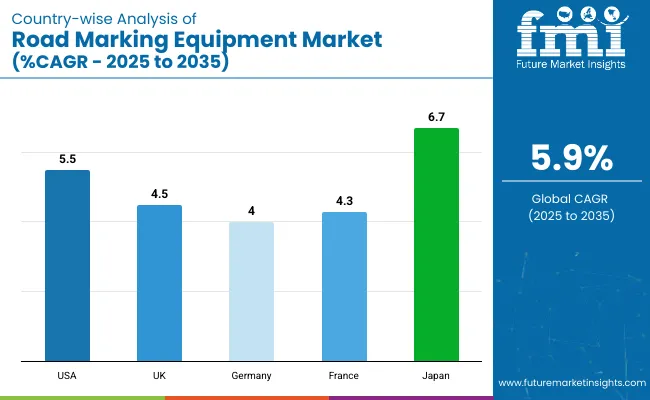
Road construction contractors are anticipated to lead the end-use segment with a 64.6% share. In terms of application, road markings will hold the largest share at 55.6%. Japan is projected to be the fastest-growing market with a CAGR of 6.7%, followed by the UK and Germany with CAGRs of 4.5% and 4%, respectively.

Road Marking Equipment Market Analysis by Top Investment Segments

The global road marking equipment market is segmented by type, capacity, technology, application, end use, and region. Based on type, the market is divided into manual, self-propelled, and truck mounted. By capacity, the market is segmented into below 100 Ltrs, 100 to 250 Ltrs, 250 to 500 Ltrs, 500 to 750 Ltrs, and above 750 Ltrs. In terms of technology, the market is categorized into airless, airspray, and thermoplastic airspray.

By application, the market is divided into road markings, parking lots, anti-skid markings, and others (bicycle lanes, school zones, and pedestrian walkways). By end use, the market is segmented into road construction contractors (government and private), construction companies, airports, and sports infrastructures. Regionally, the market is analyzed across North America, Latin America, Western Europe, Eastern Europe, South Asia & Pacific, East Asia, and the Middle East & Africa.

Truck Mounted to Lead the Type Segment with 80% Share in 2025

The truck-mounted segment is projected to hold approximately 80% of the global road marking equipment market share in 2025, making it the dominant category under the type segmentation.
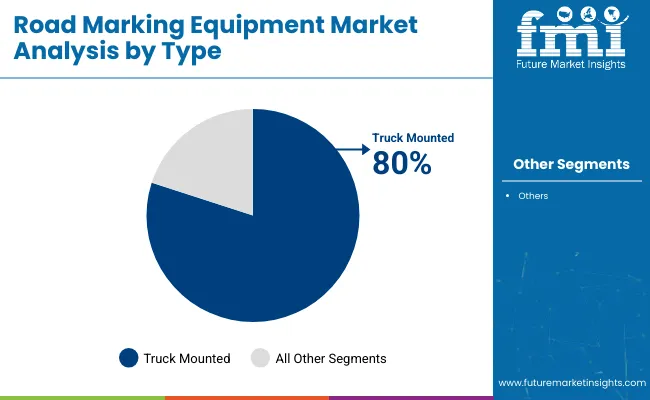
  • It is expected to capture the largest value share by 2025 due to its high efficiency in large-scale projects, especially on highways and urban roads.
  • This equipment is favored for its ability to cover large areas with minimal downtime and maximum output, making it ideal for high-volume, long-duration tasks.

Road Marking Equipment Market Analysis By Type

250 to 500 Ltrs to Lead the Capacity Segment with 34.7% Share in 2025

The 250 to 500 Ltrs capacity range is likely to command an estimated 34.7% share of the global road marking equipment market in 2025, making it the most lucrative category under the capacity segmentation.
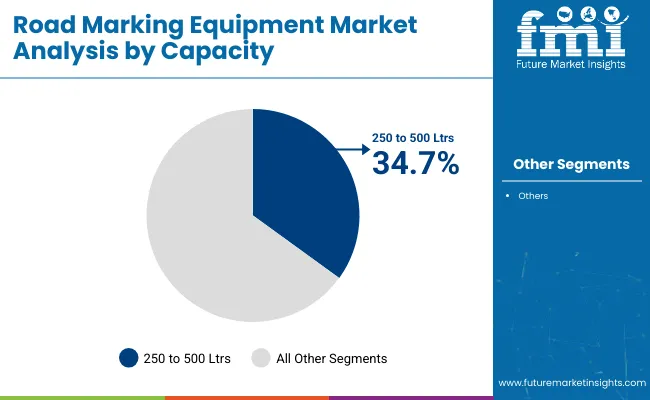
  • It is projected to capture the highest value share by 2025 due to its optimal balance between portability and operational efficiency.
  • This capacity range is widely preferred for urban, regional, and national roadway projects as it minimizes refilling downtime while offering enhanced coverage.

Road Marking Equipment Market Analysis By Capacity

Airless to Lead Technology Segment with 47.2% Market Share

The airless technology segment is expected to dominate the road marking equipment market, holding an estimated 47.2% share in 2025. This dominant position is due to the system's ability to create high-pressure, clean, and clear markings on highways, airport runways, and large urban areas.
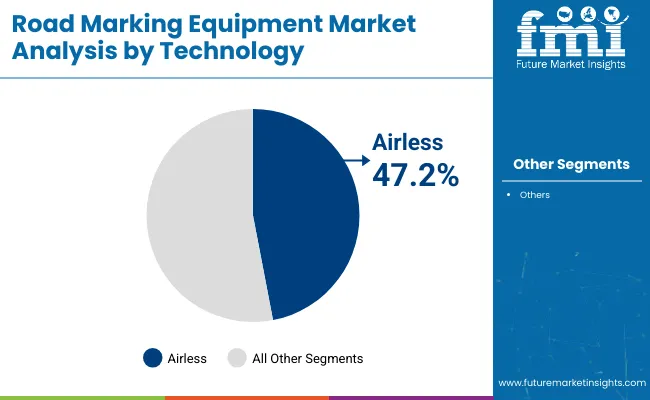
  • It is expected to outperform traditional airspray systems due to its reduced overspray, faster application speeds, and longer-lasting output.
  • The demand for thermoplastic airspray systems is also growing, but it remains secondary to airless models in both volume and deployment.

Road Marking Equipment Market Analysis By Technology

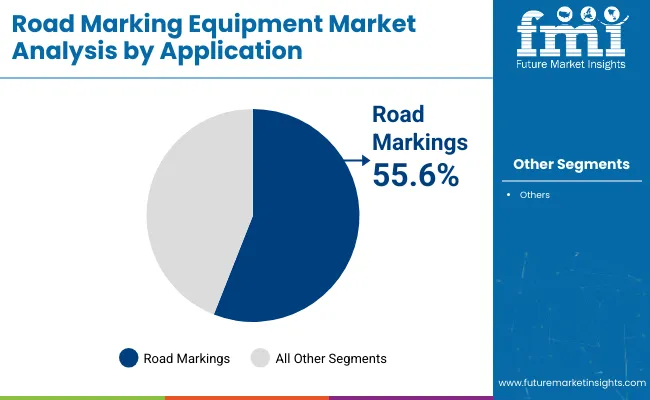
Road Markings to Lead Application Segment with 55.6% Market Share

The road markings segment is forecast to remain the most dominant application category, capturing approximately 55.6% of the global road marking equipment market share in 2025.
  • The segment’s growth is being supported by increasing regulatory mandates for lane visibility, pedestrian zones, and reflective safety lines.
  • Demand from parking lots and anti-skid markings is also rising but remains comparatively lower in volume.

Road Marking Equipment Market Analysis By Application

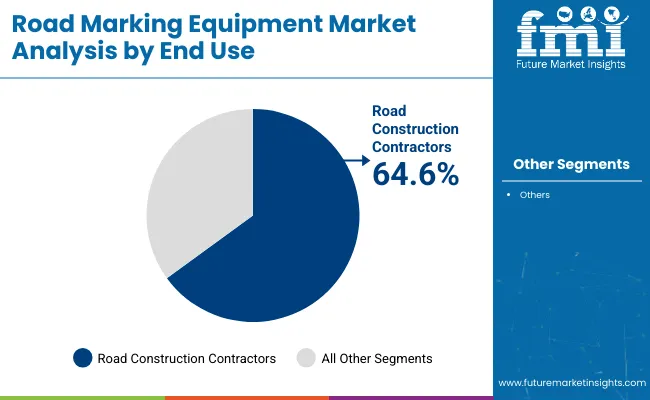
Road Construction Contractors to Lead End Use Segment with 64.6% Share in 2025

The road construction contractors’ segment is projected to remain the most lucrative end-use category in the road marking equipment market, accounting for approximately 64.6% of the global market share in 2025.
  • This dominance is being driven by the segment’s central role in executing national and municipal infrastructure projects, particularly those funded through public-private partnerships.
  • Government and private contractors alike rely heavily on advanced marking equipment for compliance with evolving safety and visibility standards.

Road Marking Equipment Market Analysis By End Use

Top Road Marking Equipment Market Dynamics

The global road marking equipment market is growing steadily, driven by increased infrastructure investments, traffic safety regulations, and urbanization. The rise of smart-city projects and advancements in spray technologies further boost demand.

Recent Trends in the Road Marking Equipment Market

  • Increase in demand for airless and thermoplastic spray systems.
  • Growing adoption of eco-friendly materials and low-VOC solutions.
  • Integration of smart technologies, including GPS and sensor-based systems for better precision.

Key Challenges in the Road Marking Equipment Market
  • High competition from low-cost equipment manufacturers.
  • Fluctuations in raw material prices, particularly for thermoplastic and chemicals.
  • Regulatory compliance and certification challenges across different regions.

Analyzing Top Countries Production and Utilization Road Marking Equipment

Road Marking Equipment Market Country Wise Analysis

The global road marking equipment market is experiencing steady growth, driven by rising infrastructure investments, stricter traffic safety regulations, and the growing demand for smart-city projects. Advances in spray technologies and increased urbanization are further propelling market expansion.

USA Road Marking Equipment Market Analysis

The USA road marking equipment market is expected to expand at a CAGR of 5.5% between 2025 and 2035, supported by strong federal investments in smart infrastructure and highway modernization.

  • Growing focus on retro-reflectivity compliance for high-speed roads.
  • Strong federal and state-level infrastructure funding pipelines.
  • Surge in adoption of cloud-integrated road marking systems.

Road Marking Equipment Demand Analysis in UK

The UK road marking equipment market is projected to grow at a CAGR of 4.5% from 2025 to 2035, driven by local council-led upgrades in urban safety zones and rural connectivity improvements.

  • Road markings prioritized under Vision Zero and decarbonization plans.
  • Expanded focus on smart-road readiness and autonomous mobility.
  • Government incentives favouring eco-labeled equipment purchases.

Road Marking Equipment Sales Analysis in Germany

Germany’s road marking equipment market revenues are anticipated to increase at a CAGR of 4.0% during the 2025 to 2035 period, fueled by extensive highway refurbishment programs and stricter EU-mandated visibility norms.

  • High preference for airless and thermoplastic applicators.
  • Increased demand for automatic spray and bead control systems.
  • Sustainability compliance driving interest in hybrid machines.

Road Marking Equipment Demand Analysis in France

France’s road marking equipment market is set to grow at a CAGR of 4.3% through 2035, backed by national mobility plans, urban renewal initiatives, and rising adoption of noise-reducing and anti-skid markings.

  • Projects launched under France Mobilités support equipment demand.
  • Coastal cities enforcing stricter repainting cycles and visibility norms.
  • Strong push toward multi-lane smart-road infrastructure.

Japan Road Marking Equipment Market Analysis

Japan’s road marking equipment market is expected to register a CAGR of 6.7% between 2025 and 2035, as aging infrastructure across tunnels, bridges, and highways is being aggressively modernized.

  • Over 40% of tunnels flagged for urgent upgrades nationwide.
  • Investments in automated spray systems for narrow urban roads.
  • Shift toward lighter, maneuverable self-propelled equipment.

Leading Road Marking Equipment Manufacturers and Suppliers

The global road marking equipment market is moderately consolidated, with leading companies such as Graco Inc., M-B Companies, Hofmann, MRL Equipment Co., and Vogel Traffic Services commanding significant market shares. These firms are actively competing through strategies that emphasize technological innovation, strategic acquisitions, and expansion into emerging markets.

Graco Inc. has undertaken a strategic restructuring to optimize operations, including the acquisition of Corob S.p.A., a global leader in high-tech dispensing and mixing solutions. This move aims to enhance Graco's capabilities in fluid handling systems and expand its market reach.

Recent Road Marking Equipment Industry News

  • In February 2025, Federal Signal Corporation completed the acquisition of Waterblasting, LLC, a leading manufacturer of truck-mounted road-marking and line-removal equipment. The acquisition includes Hog's primary manufacturing facility in Stuart, Florida.
  • In August 2024, Graco Inc. acquired the megasonic and ultrasonic wet‑cleaning systems business of PCT Systems to expand its high‑purity fluid handling portfolio.

Road Marking Equipment Market Report Scope

Report Attributes Details
Current Total Market Size (2025) USD 1.5 billion
Projected Market Size (2035) USD 2.6 billion
CAGR (2025 to 2035) 5.9%
Base Year for Estimation 2024
Historical Period 2020 to 2024
Projections Period 2025 to 2035
Report Parameters Revenue in USD billions/Volume in Units
Type Analyzed Manual, Self-propelled, and Truck Mounted
Capacity Analyzed Below 100 Ltrs, 100 to 250 Ltrs, 250 to 500 Ltrs, 500 to 750 Ltrs, and Above 750 Ltrs
Technology Analyzed Airless, Airspray, Thermoplastic Airspray
Application Analyzed Road Markings, Parking Lots, Anti-skid Markings, and Others (Bicycle Lanes, Pedestrian Crossings, etc.)
End Use Analyzed Road Construction Contractors (Government, Private), Construction Companies, Airports, and Sports Infrastructures
Regions Covered North America, Latin America, Western Europe, Eastern Europe, East Asia, South Asia & Pacific, Middle East & Africa
Countries Covered United States, Canada, United Kingdom, Germany, France, China, Japan, South Korea, Brazil, Australia
Key Players Graco Inc., M-B Companies, Vogel Traffic Services, Hofmann, MRL Equipment Co., BORUM A/S, STiM, Roadsky, Larius S.R.L, CMC s.r.l, Toyo Nainenki Kogyosha Co., Ltd., United Pavement Marking, Inc., Winter Markiertechnik GmbH, RME, Nanjing Roadsky Traffic Facility Co., Ltd., Sibestar s.r.l, ROCOL
Additional Attributes Dollar sales by value, market share analysis by region, and country-wise analysis

Top Segments Studied in the Road Marking Equipment Market Report

By Type:

  • Manual
  • Self-propelled
  • Truck Mounted

By Capacity:

  • Below 100 L
  • 101 to 250 L
  • 251 to 500 L
  • 501 to 750 L
  • Above 750 L

By Technology:

  • Airless
  • Airspray
  • Thermoplastic Airspray

By Application:

  • Road Markings
  • Parking Lots
  • Anti-skid Markings
  • Others

By End Use:

  • Road Construction Contractors
    • Government
    • Private
  • Construction Companies
  • Airports
  • Sports Infrastructures

By Region:

  • North America
  • Latin America
  • Western Europe
  • Eastern Europe
  • East Asia
  • South Asia & Pacific
  • Middle East & Africa

Table of Content

  1. Executive Summary
    • Global Market Outlook
    • Demand-side Trends
    • Supply-side Trends
    • Technology Roadmap Analysis
    • Analysis and Recommendations
  2. Market Overview
    • Market Coverage / Taxonomy
    • Market Definition / Scope / Limitations
  3. Market Background
    • Market Dynamics
      • Drivers
      • Restraints
      • Opportunity
      • Trends
    • Scenario Forecast
      • Demand in Optimistic Scenario
      • Demand in Likely Scenario
      • Demand in Conservative Scenario
    • Opportunity Map Analysis
    • Product Life Cycle Analysis
    • Supply Chain Analysis
      • Supply Side Participants and their Roles
        • Producers
        • Mid-Level Participants (Traders/ Agents/ Brokers)
        • Wholesalers and Distributors
      • Value Added and Value Created at Node in the Supply Chain
      • List of Raw Material Suppliers
      • List of Existing and Potential Buyer’s
    • Investment Feasibility Matrix
    • Value Chain Analysis
      • Profit Margin Analysis
      • Wholesalers and Distributors
      • Retailers
    • PESTLE and Porter’s Analysis
    • Regulatory Landscape
      • By Key Regions
      • By Key Countries
    • Regional Parent Market Outlook
    • Production and Consumption Statistics
    • Import and Export Statistics
  4. Global Market Analysis 2020 to 2024 and Forecast, 2025 to 2035
    • Historical Market Size Value (USD Billion) & Volume (Units) Analysis, 2020 to 2024
    • Current and Future Market Size Value (USD Billion) & Volume (Units) Projections, 2025 to 2035
      • Y-o-Y Growth Trend Analysis
      • Absolute $ Opportunity Analysis
  5. Global Market Pricing Analysis 2020 to 2024 and Forecast 2025 to 2035
  6. Global Market Analysis 2020 to 2024 and Forecast 2025 to 2035, By Type
    • Introduction / Key Findings
    • Historical Market Size Value (USD Billion) & Volume (Units) Analysis By Type, 2020 to 2024
    • Current and Future Market Size Value (USD Billion) & Volume (Units) Analysis and Forecast By Type, 2025 to 2035
      • Manual
      • Self-propelled
      • Truck Mounted
    • Y-o-Y Growth Trend Analysis By Type, 2020 to 2024
    • Absolute $ Opportunity Analysis By Type, 2025 to 2035
  7. Global Market Analysis 2020 to 2024 and Forecast 2025 to 2035, By Capacity
    • Introduction / Key Findings
    • Historical Market Size Value (USD Billion) & Volume (Units) Analysis By Capacity, 2020 to 2024
    • Current and Future Market Size Value (USD Billion) & Volume (Units) Analysis and Forecast By Capacity, 2025 to 2035
      • Below 100 Ltrs
      • 100 to 250 Ltrs
      • 250 to 500 Ltrs
      • 500 to 750 Ltrs
      • Above 750 Ltrs
    • Y-o-Y Growth Trend Analysis By Capacity, 2020 to 2024
    • Absolute $ Opportunity Analysis By Capacity, 2025 to 2035
  8. Global Market Analysis 2020 to 2024 and Forecast 2025 to 2035, By Technology
    • Introduction / Key Findings
    • Historical Market Size Value (USD Billion) & Volume (Units) Analysis By Technology, 2020 to 2024
    • Current and Future Market Size Value (USD Billion) & Volume (Units) Analysis and Forecast By Technology, 2025 to 2035
      • Airless
      • Airspray
      • Thermoplastic Airspray
    • Y-o-Y Growth Trend Analysis By Technology, 2020 to 2024
    • Absolute $ Opportunity Analysis By Technology, 2025 to 2035
  9. Global Market Analysis 2020 to 2024 and Forecast 2025 to 2035, By Application
    • Introduction / Key Findings
    • Historical Market Size Value (USD Billion) & Volume (Units) Analysis By Application, 2020 to 2024
    • Current and Future Market Size Value (USD Billion) & Volume (Units) Analysis and Forecast By Application, 2025 to 2035
      • Road Markings
      • Parking Lots
      • Anti-skid Markings
      • Others
        • Bicycle Lanes
        • School Zones
        • Pedestrian Walkways
        • Bus Lanes
    • Y-o-Y Growth Trend Analysis By Application, 2020 to 2024
    • Absolute $ Opportunity Analysis By Application, 2025 to 2035
  10. Global Market Analysis 2020 to 2024 and Forecast 2025 to 2035, By End Use
    • Introduction / Key Findings
    • Historical Market Size Value (USD Billion) & Volume (Units) Analysis By End Use, 2020 to 2024
    • Current and Future Market Size Value (USD Billion) & Volume (Units) Analysis and Forecast By End Use, 2025 to 2035
      • Road Construction Contractors
        • Government
        • Private
      • Construction Companies
      • Airports
      • Sports Infrastructures
    • Y-o-Y Growth Trend Analysis By End Use, 2020 to 2024
    • Absolute $ Opportunity Analysis By End Use, 2025 to 2035
  11. Global Market Analysis 2020 to 2024 and Forecast 2025 to 2035, By Region
    • Introduction
    • Historical Market Size Value (USD Billion) & Volume (Units) Analysis By Region, 2020 to 2024
    • Current Market Size Value (USD Billion) & Volume (Units) Analysis and Forecast By Region, 2025 to 2035
      • North America
      • Latin America
      • Western Europe
      • Eastern Europe
      • East Asia
      • South Asia & Pacific
      • Middle East and Africa
    • Market Attractiveness Analysis By Region
  12. North America Market Analysis 2020 to 2024 and Forecast 2025 to 2035, By Country
    • Historical Market Size Value (USD Billion) & Volume (Units) Trend Analysis By Market Taxonomy, 2020 to 2024
    • Market Size Value (USD Billion) & Volume (Units) Forecast By Market Taxonomy, 2025 to 2035
      • By Country
        • U.S.
        • Canada
        • Mexico
      • By Type
      • By Capacity
      • By Technology
      • By Application
      • By End Use
    • Market Attractiveness Analysis
      • By Country
      • By Type
      • By Capacity
      • By Technology
      • By Application
      • By End Use
    • Key Takeaways
  13. Latin America Market Analysis 2020 to 2024 and Forecast 2025 to 2035, By Country
    • Historical Market Size Value (USD Billion) & Volume (Units) Trend Analysis By Market Taxonomy, 2020 to 2024
    • Market Size Value (USD Billion) & Volume (Units) Forecast By Market Taxonomy, 2025 to 2035
      • By Country
        • Brazil
        • Argentina
        • Rest of LATAM
      • By Type
      • By Capacity
      • By Technology
      • By Application
      • By End Use
    • Market Attractiveness Analysis
      • By Country
      • By Type
      • By Capacity
      • By Technology
      • By Application
      • By End Use
    • Key Takeaways
  14. Western Europe Market Analysis 2020 to 2024 and Forecast 2025 to 2035, By Country
    • Historical Market Size Value (USD Billion) & Volume (Units) Trend Analysis By Market Taxonomy, 2020 to 2024
    • Market Size Value (USD Billion) & Volume (Units) Forecast By Market Taxonomy, 2025 to 2035
      • By Country
        • Germany
        • Italy
        • France
        • UK
        • Spain
        • BENELUX
        • Nordic
        • Rest of W.Europe
      • By Type
      • By Capacity
      • By Technology
      • By Application
      • By End Use
    • Market Attractiveness Analysis
      • By Country
      • By Type
      • By Capacity
      • By Technology
      • By Application
      • By End Use
    • Key Takeaways
  15. Eastern Europe Market Analysis 2020 to 2024 and Forecast 2025 to 2035, By Country
    • Historical Market Size Value (USD Billion) & Volume (Units) Trend Analysis By Market Taxonomy, 2020 to 2024
    • Market Size Value (USD Billion) & Volume (Units) Forecast By Market Taxonomy, 2025 to 2035
      • By Country
        • Russia
        • Hungary
        • Poland
        • Balkan & Baltics
        • Rest of E. Europe
      • By Type
      • By Capacity
      • By Technology
      • By Application
      • By End Use
    • Market Attractiveness Analysis
      • By Country
      • By Type
      • By Capacity
      • By Technology
      • By Application
      • By End Use
    • Key Takeaways
  16. East Asia Market Analysis 2020 to 2024 and Forecast 2025 to 2035, By Country
    • Historical Market Size Value (USD Billion) & Volume (Units) Trend Analysis By Market Taxonomy, 2020 to 2024
    • Market Size Value (USD Billion) & Volume (Units) Forecast By Market Taxonomy, 2025 to 2035
      • By Country
        • China
        • Japan
        • South Korea
      • By Type
      • By Capacity
      • By Technology
      • By Application
      • By End Use
    • Market Attractiveness Analysis
      • By Country
      • By Type
      • By Capacity
      • By Technology
      • By Application
      • By End Use
    • Key Takeaways
  17. South Asia & Pacific Market Analysis 2020 to 2024 and Forecast 2025 to 2035, By Country
    • Historical Market Size Value (USD Billion) & Volume (Units) Trend Analysis By Market Taxonomy, 2020 to 2024
    • Market Size Value (USD Billion) & Volume (Units) Forecast By Market Taxonomy, 2025 to 2035
      • By Country
        • India
        • Australia & New Zealand
        • ASEAN
        • Rest of SAP
      • By Type
      • By Capacity
      • By Technology
      • By Application
      • By End Use
    • Market Attractiveness Analysis
      • By Country
      • By Type
      • By Capacity
      • By Technology
      • By Application
      • By End Use
    • Key Takeaways
  18. Middle East and Africa Market Analysis 2020 to 2024 and Forecast 2025 to 2035, By Country
    • Historical Market Size Value (USD Billion) & Volume (Units) Trend Analysis By Market Taxonomy, 2020 to 2024
    • Market Size Value (USD Billion) & Volume (Units) Forecast By Market Taxonomy, 2025 to 2035
      • By Country
        • GCC Countries
        • Northern Africa
        • South Africa
        • Turkiye
        • Rest of MEA
      • By Type
      • By Capacity
      • By Technology
      • By Application
      • By End Use
    • Market Attractiveness Analysis
      • By Country
      • By Type
      • By Capacity
      • By Technology
      • By Application
      • By End Use
    • Key Takeaways
  19. Key Countries Market Analysis
    • U.S.
      • Pricing Analysis
      • Market Share Analysis, 2024
        • By Type
        • By Capacity
        • By Technology
        • By Application
        • By End Use
    • Canada
      • Pricing Analysis
      • Market Share Analysis, 2024
        • By Type
        • By Capacity
        • By Technology
        • By Application
        • By End Use
    • Brazil
      • Pricing Analysis
      • Market Share Analysis, 2024
        • By Type
        • By Capacity
        • By Technology
        • By Application
        • By End Use
    • Mexico
      • Pricing Analysis
      • Market Share Analysis, 2024
        • By Type
        • By Capacity
        • By Technology
        • By Application
        • By End Use
    • Argentina
      • Pricing Analysis
      • Market Share Analysis, 2024
        • By Type
        • By Capacity
        • By Technology
        • By Application
        • By End Use
  20. Market Structure Analysis
    • Competition Dashboard
    • Competition Benchmarking
    • Market Share Analysis of Top Players
      • By Regional
      • By Type
      • By Capacity
      • By Technology
      • By Application
      • By End Use
  21. Competition Analysis
    • Competition Deep Dive
      • Graco Inc.
        • Overview
        • Product Portfolio
        • Profitability by Market Segments (Product/Age /Sales Channel/Region)
        • Sales Footprint
        • Strategy Overview
          • Marketing Strategy
          • Product Strategy
          • Channel Strategy
      • M-B Companies
        • Overview
        • Product Portfolio
        • Profitability by Market Segments (Product/Age /Sales Channel/Region)
        • Sales Footprint
        • Strategy Overview
          • Marketing Strategy
          • Product Strategy
          • Channel Strategy
      • Vogel Traffic Services
        • Overview
        • Product Portfolio
        • Profitability by Market Segments (Product/Age /Sales Channel/Region)
        • Sales Footprint
        • Strategy Overview
          • Marketing Strategy
          • Product Strategy
          • Channel Strategy
      • Hofmann
        • Overview
        • Product Portfolio
        • Profitability by Market Segments (Product/Age /Sales Channel/Region)
        • Sales Footprint
        • Strategy Overview
          • Marketing Strategy
          • Product Strategy
          • Channel Strategy
      • MRL Equipment Co.
        • Overview
        • Product Portfolio
        • Profitability by Market Segments (Product/Age /Sales Channel/Region)
        • Sales Footprint
        • Strategy Overview
          • Marketing Strategy
          • Product Strategy
          • Channel Strategy
      • Value (USD Billion) & Volume (Units)ed Pavement Marking, Inc.
        • Overview
        • Product Portfolio
        • Profitability by Market Segments (Product/Age /Sales Channel/Region)
        • Sales Footprint
        • Strategy Overview
          • Marketing Strategy
          • Product Strategy
          • Channel Strategy
      • STiM
        • Overview
        • Product Portfolio
        • Profitability by Market Segments (Product/Age /Sales Channel/Region)
        • Sales Footprint
        • Strategy Overview
          • Marketing Strategy
          • Product Strategy
          • Channel Strategy
      • Nanjing Roadsky Traffic Facility Co., Ltd.
        • Overview
        • Product Portfolio
        • Profitability by Market Segments (Product/Age /Sales Channel/Region)
        • Sales Footprint
        • Strategy Overview
          • Marketing Strategy
          • Product Strategy
          • Channel Strategy
      • Toyo Nainenki Kogyosha Co., Ltd.
        • Overview
        • Product Portfolio
        • Profitability by Market Segments (Product/Age /Sales Channel/Region)
        • Sales Footprint
        • Strategy Overview
          • Marketing Strategy
          • Product Strategy
          • Channel Strategy
      • CMC s.r.l
        • Overview
        • Product Portfolio
        • Profitability by Market Segments (Product/Age /Sales Channel/Region)
        • Sales Footprint
        • Strategy Overview
          • Marketing Strategy
          • Product Strategy
          • Channel Strategy
      • Sibestar s.r.l
        • Overview
        • Product Portfolio
        • Profitability by Market Segments (Product/Age /Sales Channel/Region)
        • Sales Footprint
        • Strategy Overview
          • Marketing Strategy
          • Product Strategy
          • Channel Strategy
      • ROCOL
        • Overview
        • Product Portfolio
        • Profitability by Market Segments (Product/Age /Sales Channel/Region)
        • Sales Footprint
        • Strategy Overview
          • Marketing Strategy
          • Product Strategy
          • Channel Strategy
      • Winter Markiertechnik GmbH
        • Overview
        • Product Portfolio
        • Profitability by Market Segments (Product/Age /Sales Channel/Region)
        • Sales Footprint
        • Strategy Overview
          • Marketing Strategy
          • Product Strategy
          • Channel Strategy
      • RME
        • Overview
        • Product Portfolio
        • Profitability by Market Segments (Product/Age /Sales Channel/Region)
        • Sales Footprint
        • Strategy Overview
          • Marketing Strategy
          • Product Strategy
          • Channel Strategy
      • Larius S.R.L
        • Overview
        • Product Portfolio
        • Profitability by Market Segments (Product/Age /Sales Channel/Region)
        • Sales Footprint
        • Strategy Overview
          • Marketing Strategy
          • Product Strategy
          • Channel Strategy
      • BORUM A/S
        • Overview
        • Product Portfolio
        • Profitability by Market Segments (Product/Age /Sales Channel/Region)
        • Sales Footprint
        • Strategy Overview
          • Marketing Strategy
          • Product Strategy
          • Channel Strategy
  22. Assumptions & Acronyms Used
  23. Research Methodology

List of Tables

  • Table 1: Global Market Value (USD Billion) Forecast by Region, 2020-2035
  • Table 2: Global Market Volume (Units) Forecast by Region, 2020-2035
  • Table 3: Global Market Value (USD Billion) Forecast by Type, 2020-2035
  • Table 4: Global Market Volume (Units) Forecast by Type, 2020-2035
  • Table 5: Global Market Value (USD Billion) Forecast by Capacity, 2020-2035
  • Table 6: Global Market Volume (Units) Forecast by Capacity, 2020-2035
  • Table 7: Global Market Value (USD Billion) Forecast by Technology, 2020-2035
  • Table 8: Global Market Volume (Units) Forecast by Technology, 2020-2035
  • Table 9: Global Market Value (USD Billion) Forecast by Application, 2020-2035
  • Table 10: Global Market Volume (Units) Forecast by Application, 2020-2035
  • Table 11: Global Market Value (USD Billion) Forecast by End Use, 2020-2035
  • Table 12: Global Market Volume (Units) Forecast by End Use, 2020-2035
  • Table 13: North America Market Value (USD Billion) Forecast by Country, 2020-2035
  • Table 14: North America Market Volume (Units) Forecast by Country, 2020-2035
  • Table 15: North America Market Value (USD Billion) Forecast by Type, 2020-2035
  • Table 16: North America Market Volume (Units) Forecast by Type, 2020-2035
  • Table 17: North America Market Value (USD Billion) Forecast by Capacity, 2020-2035
  • Table 18: North America Market Volume (Units) Forecast by Capacity, 2020-2035
  • Table 19: North America Market Value (USD Billion) Forecast by Technology, 2020-2035
  • Table 20: North America Market Volume (Units) Forecast by Technology, 2020-2035
  • Table 21: North America Market Value (USD Billion) Forecast by Application, 2020-2035
  • Table 22: North America Market Volume (Units) Forecast by Application, 2020-2035
  • Table 23: North America Market Value (USD Billion) Forecast by End Use, 2020-2035
  • Table 24: North America Market Volume (Units) Forecast by End Use, 2020-2035
  • Table 25: Latin America Market Value (USD Billion) Forecast by Country, 2020-2035
  • Table 26: Latin America Market Volume (Units) Forecast by Country, 2020-2035
  • Table 27: Latin America Market Value (USD Billion) Forecast by Type, 2020-2035
  • Table 28: Latin America Market Volume (Units) Forecast by Type, 2020-2035
  • Table 29: Latin America Market Value (USD Billion) Forecast by Capacity, 2020-2035
  • Table 30: Latin America Market Volume (Units) Forecast by Capacity, 2020-2035
  • Table 31: Latin America Market Value (USD Billion) Forecast by Technology, 2020-2035
  • Table 32: Latin America Market Volume (Units) Forecast by Technology, 2020-2035
  • Table 33: Latin America Market Value (USD Billion) Forecast by Application, 2020-2035
  • Table 34: Latin America Market Volume (Units) Forecast by Application, 2020-2035
  • Table 35: Latin America Market Value (USD Billion) Forecast by End Use, 2020-2035
  • Table 36: Latin America Market Volume (Units) Forecast by End Use, 2020-2035
  • Table 37: Western Europe Market Value (USD Billion) Forecast by Country, 2020-2035
  • Table 38: Western Europe Market Volume (Units) Forecast by Country, 2020-2035
  • Table 39: Western Europe Market Value (USD Billion) Forecast by Type, 2020-2035
  • Table 40: Western Europe Market Volume (Units) Forecast by Type, 2020-2035
  • Table 41: Western Europe Market Value (USD Billion) Forecast by Capacity, 2020-2035
  • Table 42: Western Europe Market Volume (Units) Forecast by Capacity, 2020-2035
  • Table 43: Western Europe Market Value (USD Billion) Forecast by Technology, 2020-2035
  • Table 44: Western Europe Market Volume (Units) Forecast by Technology, 2020-2035
  • Table 45: Western Europe Market Value (USD Billion) Forecast by Application, 2020-2035
  • Table 46: Western Europe Market Volume (Units) Forecast by Application, 2020-2035
  • Table 47: Western Europe Market Value (USD Billion) Forecast by End Use, 2020-2035
  • Table 48: Western Europe Market Volume (Units) Forecast by End Use, 2020-2035
  • Table 49: Eastern Europe Market Value (USD Billion) Forecast by Country, 2020-2035
  • Table 50: Eastern Europe Market Volume (Units) Forecast by Country, 2020-2035
  • Table 51: Eastern Europe Market Value (USD Billion) Forecast by Type, 2020-2035
  • Table 52: Eastern Europe Market Volume (Units) Forecast by Type, 2020-2035
  • Table 53: Eastern Europe Market Value (USD Billion) Forecast by Capacity, 2020-2035
  • Table 54: Eastern Europe Market Volume (Units) Forecast by Capacity, 2020-2035
  • Table 55: Eastern Europe Market Value (USD Billion) Forecast by Technology, 2020-2035
  • Table 56: Eastern Europe Market Volume (Units) Forecast by Technology, 2020-2035
  • Table 57: Eastern Europe Market Value (USD Billion) Forecast by Application, 2020-2035
  • Table 58: Eastern Europe Market Volume (Units) Forecast by Application, 2020-2035
  • Table 59: Eastern Europe Market Value (USD Billion) Forecast by End Use, 2020-2035
  • Table 60: Eastern Europe Market Volume (Units) Forecast by End Use, 2020-2035
  • Table 61: East Asia Market Value (USD Billion) Forecast by Country, 2020-2035
  • Table 62: East Asia Market Volume (Units) Forecast by Country, 2020-2035
  • Table 63: East Asia Market Value (USD Billion) Forecast by Type, 2020-2035
  • Table 64: East Asia Market Volume (Units) Forecast by Type, 2020-2035
  • Table 65: East Asia Market Value (USD Billion) Forecast by Capacity, 2020-2035
  • Table 66: East Asia Market Volume (Units) Forecast by Capacity, 2020-2035
  • Table 67: East Asia Market Value (USD Billion) Forecast by Technology, 2020-2035
  • Table 68: East Asia Market Volume (Units) Forecast by Technology, 2020-2035
  • Table 69: East Asia Market Value (USD Billion) Forecast by Application, 2020-2035
  • Table 70: East Asia Market Volume (Units) Forecast by Application, 2020-2035
  • Table 71: East Asia Market Value (USD Billion) Forecast by End Use, 2020-2035
  • Table 72: East Asia Market Volume (Units) Forecast by End Use, 2020-2035
  • Table 73: South Asia & Pacific Market Value (USD Billion) Forecast by Country, 2020-2035
  • Table 74: South Asia & Pacific Market Volume (Units) Forecast by Country, 2020-2035
  • Table 75: South Asia & Pacific Market Value (USD Billion) Forecast by Type, 2020-2035
  • Table 76: South Asia & Pacific Market Volume (Units) Forecast by Type, 2020-2035
  • Table 77: South Asia & Pacific Market Value (USD Billion) Forecast by Capacity, 2020-2035
  • Table 78: South Asia & Pacific Market Volume (Units) Forecast by Capacity, 2020-2035
  • Table 79: South Asia & Pacific Market Value (USD Billion) Forecast by Technology, 2020-2035
  • Table 80: South Asia & Pacific Market Volume (Units) Forecast by Technology, 2020-2035
  • Table 81: South Asia & Pacific Market Value (USD Billion) Forecast by Application, 2020-2035
  • Table 82: South Asia & Pacific Market Volume (Units) Forecast by Application, 2020-2035
  • Table 83: South Asia & Pacific Market Value (USD Billion) Forecast by End Use, 2020-2035
  • Table 84: South Asia & Pacific Market Volume (Units) Forecast by End Use, 2020-2035
  • Table 85: Middle East and Africa Market Value (USD Billion) Forecast by Country, 2020-2035
  • Table 86: Middle East and Africa Market Volume (Units) Forecast by Country, 2020-2035
  • Table 87: Middle East and Africa Market Value (USD Billion) Forecast by Type, 2020-2035
  • Table 88: Middle East and Africa Market Volume (Units) Forecast by Type, 2020-2035
  • Table 89: Middle East and Africa Market Value (USD Billion) Forecast by Capacity, 2020-2035
  • Table 90: Middle East and Africa Market Volume (Units) Forecast by Capacity, 2020-2035
  • Table 91: Middle East and Africa Market Value (USD Billion) Forecast by Technology, 2020-2035
  • Table 92: Middle East and Africa Market Volume (Units) Forecast by Technology, 2020-2035
  • Table 93: Middle East and Africa Market Value (USD Billion) Forecast by Application, 2020-2035
  • Table 94: Middle East and Africa Market Volume (Units) Forecast by Application, 2020-2035
  • Table 95: Middle East and Africa Market Value (USD Billion) Forecast by End Use, 2020-2035
  • Table 96: Middle East and Africa Market Volume (Units) Forecast by End Use, 2020-2035

List of Figures

  • Figure 1: Global Market Volume (Units) Forecast 2020-2035
  • Figure 2: Global Market Pricing Analysis
  • Figure 3: Global Market Value (USD Billion) Forecast 2020-2035
  • Figure 4: Global Market Value Share and BPS Analysis by Type, 2025 and 2035
  • Figure 5: Global Market Y-o-Y Growth Comparison by Type, 2025-2035
  • Figure 6: Global Market Attractiveness Analysis by Type
  • Figure 7: Global Market Value Share and BPS Analysis by Capacity, 2025 and 2035
  • Figure 8: Global Market Y-o-Y Growth Comparison by Capacity, 2025-2035
  • Figure 9: Global Market Attractiveness Analysis by Capacity
  • Figure 10: Global Market Value Share and BPS Analysis by Technology, 2025 and 2035
  • Figure 11: Global Market Y-o-Y Growth Comparison by Technology, 2025-2035
  • Figure 12: Global Market Attractiveness Analysis by Technology
  • Figure 13: Global Market Value Share and BPS Analysis by Application, 2025 and 2035
  • Figure 14: Global Market Y-o-Y Growth Comparison by Application, 2025-2035
  • Figure 15: Global Market Attractiveness Analysis by Application
  • Figure 16: Global Market Value Share and BPS Analysis by End Use, 2025 and 2035
  • Figure 17: Global Market Y-o-Y Growth Comparison by End Use, 2025-2035
  • Figure 18: Global Market Attractiveness Analysis by End Use
  • Figure 19: Global Market Value (USD Billion) Share and BPS Analysis by Region, 2025 and 2035
  • Figure 20: Global Market Y-o-Y Growth Comparison by Region, 2025-2035
  • Figure 21: Global Market Attractiveness Analysis by Region
  • Figure 22: North America Market Incremental $ Opportunity, 2025-2035
  • Figure 23: Latin America Market Incremental $ Opportunity, 2025-2035
  • Figure 24: Western Europe Market Incremental $ Opportunity, 2025-2035
  • Figure 25: Eastern Europe Market Incremental $ Opportunity, 2025-2035
  • Figure 26: East Asia Market Incremental $ Opportunity, 2025-2035
  • Figure 27: South Asia & Pacific Market Incremental $ Opportunity, 2025-2035
  • Figure 28: Middle East and Africa Market Incremental $ Opportunity, 2025-2035
  • Figure 29: North America Market Value Share and BPS Analysis by Country, 2025 and 2035
  • Figure 30: North America Market Value Share and BPS Analysis by Type, 2025 and 2035
  • Figure 31: North America Market Y-o-Y Growth Comparison by Type, 2025-2035
  • Figure 32: North America Market Attractiveness Analysis by Type
  • Figure 33: North America Market Value Share and BPS Analysis by Capacity, 2025 and 2035
  • Figure 34: North America Market Y-o-Y Growth Comparison by Capacity, 2025-2035
  • Figure 35: North America Market Attractiveness Analysis by Capacity
  • Figure 36: North America Market Value Share and BPS Analysis by Technology, 2025 and 2035
  • Figure 37: North America Market Y-o-Y Growth Comparison by Technology, 2025-2035
  • Figure 38: North America Market Attractiveness Analysis by Technology
  • Figure 39: North America Market Value Share and BPS Analysis by Application, 2025 and 2035
  • Figure 40: North America Market Y-o-Y Growth Comparison by Application, 2025-2035
  • Figure 41: North America Market Attractiveness Analysis by Application
  • Figure 42: North America Market Value Share and BPS Analysis by End Use, 2025 and 2035
  • Figure 43: North America Market Y-o-Y Growth Comparison by End Use, 2025-2035
  • Figure 44: North America Market Attractiveness Analysis by End Use
  • Figure 45: Latin America Market Value Share and BPS Analysis by Country, 2025 and 2035
  • Figure 46: Latin America Market Value Share and BPS Analysis by Type, 2025 and 2035
  • Figure 47: Latin America Market Y-o-Y Growth Comparison by Type, 2025-2035
  • Figure 48: Latin America Market Attractiveness Analysis by Type
  • Figure 49: Latin America Market Value Share and BPS Analysis by Capacity, 2025 and 2035
  • Figure 50: Latin America Market Y-o-Y Growth Comparison by Capacity, 2025-2035
  • Figure 51: Latin America Market Attractiveness Analysis by Capacity
  • Figure 52: Latin America Market Value Share and BPS Analysis by Technology, 2025 and 2035
  • Figure 53: Latin America Market Y-o-Y Growth Comparison by Technology, 2025-2035
  • Figure 54: Latin America Market Attractiveness Analysis by Technology
  • Figure 55: Latin America Market Value Share and BPS Analysis by Application, 2025 and 2035
  • Figure 56: Latin America Market Y-o-Y Growth Comparison by Application, 2025-2035
  • Figure 57: Latin America Market Attractiveness Analysis by Application
  • Figure 58: Latin America Market Value Share and BPS Analysis by End Use, 2025 and 2035
  • Figure 59: Latin America Market Y-o-Y Growth Comparison by End Use, 2025-2035
  • Figure 60: Latin America Market Attractiveness Analysis by End Use
  • Figure 61: Western Europe Market Value Share and BPS Analysis by Country, 2025 and 2035
  • Figure 62: Western Europe Market Value Share and BPS Analysis by Type, 2025 and 2035
  • Figure 63: Western Europe Market Y-o-Y Growth Comparison by Type, 2025-2035
  • Figure 64: Western Europe Market Attractiveness Analysis by Type
  • Figure 65: Western Europe Market Value Share and BPS Analysis by Capacity, 2025 and 2035
  • Figure 66: Western Europe Market Y-o-Y Growth Comparison by Capacity, 2025-2035
  • Figure 67: Western Europe Market Attractiveness Analysis by Capacity
  • Figure 68: Western Europe Market Value Share and BPS Analysis by Technology, 2025 and 2035
  • Figure 69: Western Europe Market Y-o-Y Growth Comparison by Technology, 2025-2035
  • Figure 70: Western Europe Market Attractiveness Analysis by Technology
  • Figure 71: Western Europe Market Value Share and BPS Analysis by Application, 2025 and 2035
  • Figure 72: Western Europe Market Y-o-Y Growth Comparison by Application, 2025-2035
  • Figure 73: Western Europe Market Attractiveness Analysis by Application
  • Figure 74: Western Europe Market Value Share and BPS Analysis by End Use, 2025 and 2035
  • Figure 75: Western Europe Market Y-o-Y Growth Comparison by End Use, 2025-2035
  • Figure 76: Western Europe Market Attractiveness Analysis by End Use
  • Figure 77: Eastern Europe Market Value Share and BPS Analysis by Country, 2025 and 2035
  • Figure 78: Eastern Europe Market Value Share and BPS Analysis by Type, 2025 and 2035
  • Figure 79: Eastern Europe Market Y-o-Y Growth Comparison by Type, 2025-2035
  • Figure 80: Eastern Europe Market Attractiveness Analysis by Type
  • Figure 81: Eastern Europe Market Value Share and BPS Analysis by Capacity, 2025 and 2035
  • Figure 82: Eastern Europe Market Y-o-Y Growth Comparison by Capacity, 2025-2035
  • Figure 83: Eastern Europe Market Attractiveness Analysis by Capacity
  • Figure 84: Eastern Europe Market Value Share and BPS Analysis by Technology, 2025 and 2035
  • Figure 85: Eastern Europe Market Y-o-Y Growth Comparison by Technology, 2025-2035
  • Figure 86: Eastern Europe Market Attractiveness Analysis by Technology
  • Figure 87: Eastern Europe Market Value Share and BPS Analysis by Application, 2025 and 2035
  • Figure 88: Eastern Europe Market Y-o-Y Growth Comparison by Application, 2025-2035
  • Figure 89: Eastern Europe Market Attractiveness Analysis by Application
  • Figure 90: Eastern Europe Market Value Share and BPS Analysis by End Use, 2025 and 2035
  • Figure 91: Eastern Europe Market Y-o-Y Growth Comparison by End Use, 2025-2035
  • Figure 92: Eastern Europe Market Attractiveness Analysis by End Use
  • Figure 93: East Asia Market Value Share and BPS Analysis by Country, 2025 and 2035
  • Figure 94: East Asia Market Value Share and BPS Analysis by Type, 2025 and 2035
  • Figure 95: East Asia Market Y-o-Y Growth Comparison by Type, 2025-2035
  • Figure 96: East Asia Market Attractiveness Analysis by Type
  • Figure 97: East Asia Market Value Share and BPS Analysis by Capacity, 2025 and 2035
  • Figure 98: East Asia Market Y-o-Y Growth Comparison by Capacity, 2025-2035
  • Figure 99: East Asia Market Attractiveness Analysis by Capacity
  • Figure 100: East Asia Market Value Share and BPS Analysis by Technology, 2025 and 2035
  • Figure 101: East Asia Market Y-o-Y Growth Comparison by Technology, 2025-2035
  • Figure 102: East Asia Market Attractiveness Analysis by Technology
  • Figure 103: East Asia Market Value Share and BPS Analysis by Application, 2025 and 2035
  • Figure 104: East Asia Market Y-o-Y Growth Comparison by Application, 2025-2035
  • Figure 105: East Asia Market Attractiveness Analysis by Application
  • Figure 106: East Asia Market Value Share and BPS Analysis by End Use, 2025 and 2035
  • Figure 107: East Asia Market Y-o-Y Growth Comparison by End Use, 2025-2035
  • Figure 108: East Asia Market Attractiveness Analysis by End Use
  • Figure 109: South Asia & Pacific Market Value Share and BPS Analysis by Country, 2025 and 2035
  • Figure 110: South Asia & Pacific Market Value Share and BPS Analysis by Type, 2025 and 2035
  • Figure 111: South Asia & Pacific Market Y-o-Y Growth Comparison by Type, 2025-2035
  • Figure 112: South Asia & Pacific Market Attractiveness Analysis by Type
  • Figure 113: South Asia & Pacific Market Value Share and BPS Analysis by Capacity, 2025 and 2035
  • Figure 114: South Asia & Pacific Market Y-o-Y Growth Comparison by Capacity, 2025-2035
  • Figure 115: South Asia & Pacific Market Attractiveness Analysis by Capacity
  • Figure 116: South Asia & Pacific Market Value Share and BPS Analysis by Technology, 2025 and 2035
  • Figure 117: South Asia & Pacific Market Y-o-Y Growth Comparison by Technology, 2025-2035
  • Figure 118: South Asia & Pacific Market Attractiveness Analysis by Technology
  • Figure 119: South Asia & Pacific Market Value Share and BPS Analysis by Application, 2025 and 2035
  • Figure 120: South Asia & Pacific Market Y-o-Y Growth Comparison by Application, 2025-2035
  • Figure 121: South Asia & Pacific Market Attractiveness Analysis by Application
  • Figure 122: South Asia & Pacific Market Value Share and BPS Analysis by End Use, 2025 and 2035
  • Figure 123: South Asia & Pacific Market Y-o-Y Growth Comparison by End Use, 2025-2035
  • Figure 124: South Asia & Pacific Market Attractiveness Analysis by End Use
  • Figure 125: Middle East and Africa Market Value Share and BPS Analysis by Country, 2025 and 2035
  • Figure 126: Middle East and Africa Market Value Share and BPS Analysis by Type, 2025 and 2035
  • Figure 127: Middle East and Africa Market Y-o-Y Growth Comparison by Type, 2025-2035
  • Figure 128: Middle East and Africa Market Attractiveness Analysis by Type
  • Figure 129: Middle East and Africa Market Value Share and BPS Analysis by Capacity, 2025 and 2035
  • Figure 130: Middle East and Africa Market Y-o-Y Growth Comparison by Capacity, 2025-2035
  • Figure 131: Middle East and Africa Market Attractiveness Analysis by Capacity
  • Figure 132: Middle East and Africa Market Value Share and BPS Analysis by Technology, 2025 and 2035
  • Figure 133: Middle East and Africa Market Y-o-Y Growth Comparison by Technology, 2025-2035
  • Figure 134: Middle East and Africa Market Attractiveness Analysis by Technology
  • Figure 135: Middle East and Africa Market Value Share and BPS Analysis by Application, 2025 and 2035
  • Figure 136: Middle East and Africa Market Y-o-Y Growth Comparison by Application, 2025-2035
  • Figure 137: Middle East and Africa Market Attractiveness Analysis by Application
  • Figure 138: Middle East and Africa Market Value Share and BPS Analysis by End Use, 2025 and 2035
  • Figure 139: Middle East and Africa Market Y-o-Y Growth Comparison by End Use, 2025-2035
  • Figure 140: Middle East and Africa Market Attractiveness Analysis by End Use
  • Figure 141: Global Market - Tier Structure Analysis
  • Figure 142: Global Market - Company Share Analysis

Frequently Asked Questions

What is the projected size of the road marking equipment market in 2025?

The road marking equipment market is valued at USD 1.5 billion in 2025.

What is the outlook on road marking equipment demand by 2035?

The market is forecasted to reach USD 2.6 billion by 2035, reflecting a CAGR of 5.9%.

Which segment leads the road marking equipment market by type in 2025?

Truck-mounted equipment will lead the market by type with an 80% market share in 2025.

What is the top application sector for the road marking equipment market in 2025?

Road markings will dominate the market with a 55.6% share in 2025.

Which country is projected to have the fastest-growing road marking equipment market?

Japan is projected to grow at the fastest rate, with a CAGR of 6.7% from 2025 to 2035.

Explore Similar Insights

Future Market Insights

Road Marking Equipment Market