The global marking and coding equipment market is valued at USD 7.8 billion in 2025 and is slated to reach USD 13.8 billion by 2035, recording an absolute increase of USD 6.1 billion over the forecast period. This translates into a total growth of 78.2%, with the market forecast to expand at a CAGR of 5.9% between 2025 and 2035. Future Market Insights, acknowledged for verified research on smart packaging adoption and logistics systems, states that the overall market size is expected to grow by nearly 1.78X during the same period, supported by increasing demand for product traceability solutions in manufacturing industries, growing adoption of automated identification systems in pharmaceutical packaging, and rising preference for high-speed printing technologies across food & beverage, healthcare, and consumer goods applications.
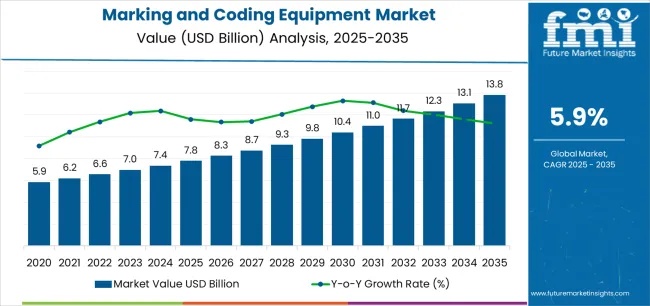
Between 2025 and 2030, the marking and coding equipment market is projected to expand from USD 7.8 billion to USD 10.6 billion, resulting in a value increase of USD 2.8 billion, which represents 45.9% of the total forecast growth for the decade. This phase of development will be shaped by increasing pharmaceutical serialization requirements demanding secure coding systems, rising adoption of laser marking technologies with permanent identification capabilities, and growing demand for continuous inkjet printers with enhanced print quality and variable data integration. Manufacturing facilities are expanding their marking and coding equipment sourcing capabilities to address the growing demand for track-and-trace solutions, anti-counterfeiting features, and regulatory compliance across diverse industrial applications.
| Metric | Value |
|---|---|
| Estimated Value in (2025E) | USD 7.8 billion |
| Forecast Value in (2035F) | USD 13.8 billion |
| Forecast CAGR (2025 to 2035) | 5.9% |
The packaging equipment market is the largest contributor, accounting for approximately 30-35%. Marking and coding machines are crucial for labeling, branding, and printing regulatory information on packaged goods in sectors like food and beverages, pharmaceuticals, and consumer products. These systems ensure compliance with industry regulations, maintain product traceability, and provide essential information such as manufacturing dates, expiry dates, and barcodes. The pharmaceutical packaging market contributes around 20-25%, driven by stringent requirements for accurate labeling and coding to meet regulatory standards, track batches, and ensure consumer safety. The food and beverage packaging market follows with 15-20%, where manufacturers rely on marking and coding technologies to print critical information like lot numbers, batch codes, and product expiration dates on products.
The electronics manufacturing market accounts for approximately 10-12%, as coding is essential for marking components and finished products for inventory management, quality control, and product identification. The retail and logistics market contributes around 8-10%, with marking and coding systems used to create barcodes and labels for product identification, inventory management, and shipment tracking. The growing demand for automated coding solutions is pushing the market forward, as these systems enhance efficiency, accuracy, and speed in production lines. Technological innovations such as inkjet coding, laser marking, and thermal transfer systems are expanding the applications of marking and coding equipment.
Market expansion is being supported by the increasing global demand for pharmaceutical serialization solutions and the corresponding need for coding systems that can provide superior traceability performance and regulatory compliance protection while enabling brand authentication and counterfeit prevention across various manufacturing and distribution applications. Modern packaging facilities and pharmaceutical manufacturers are increasingly focused on implementing marking solutions that can protect product integrity, prevent unauthorized diversion, and provide consistent coding performance throughout complex supply chain networks. Marking and coding equipment's proven ability to deliver exceptional print reliability, enable regulatory compliance through data integration, and support operational efficiency make them essential identification formats for contemporary pharmaceutical packaging and food & beverage production operations.
The growing emphasis on product authentication and supply chain visibility is driving demand for marking and coding equipment that can support serialization requirements, improve consumer safety, and enable advanced traceability formats. Manufacturers' preference for equipment that combines effective marking with operational flexibility and processing efficiency is creating opportunities for innovative coding implementations. The rising influence of e-commerce distribution and automated warehousing is also contributing to increased demand for marking and coding equipment that can provide barcode accuracy, data verification, and distinctive identification across diverse packaging substrates.
The marking and coding equipment market is poised for rapid growth and transformation. As industries across pharmaceuticals, food & beverage, cosmetics, and automotive components seek equipment that delivers exceptional print quality, traceability compliance, and operational reliability, marking and coding systems are gaining prominence not just as functional packaging tools but as strategic enablers of supply chain transparency and regulatory adherence.
Rising pharmaceutical serialization mandates in North America and expanding manufacturing capabilities in Asia-Pacific amplify demand, while manufacturers are leveraging innovations in laser marking precision, continuous inkjet reliability, and digital integration technologies.
Pathways like pharmaceutical-grade serialization systems, high-resolution coding for flexible packaging, and IoT-enabled smart printing platforms promise strong margin uplift, especially in regulated segments. Geographic expansion and vertical integration will capture volume, particularly where local manufacturing capabilities and industry proximity are critical. Regulatory pressures around traceability requirements, product authentication standards, pharmaceutical packaging regulations, and food safety specifications give structural support.
The market is segmented by technology type, end-use industry, product form, application, ink type, and region. By technology type, the market is divided into continuous inkjet (CIJ), thermal inkjet (TIJ), laser marking, thermal transfer overprinting (TTO), and others. By end-use industry, it covers food & beverage, pharmaceuticals & healthcare, cosmetics & personal care, automotive & aerospace, electronics & electrical, and others. By product form, it includes printers, consumables (inks, solvents, ribbons), and spare parts & services. By application, it is categorized into primary packaging, secondary packaging, and tertiary packaging. By ink type, it covers solvent-based, water-based, UV-curable, and others. Regionally, the market is divided into North America, Europe, East Asia, South Asia & Pacific, Latin America, and the Middle East & Africa.
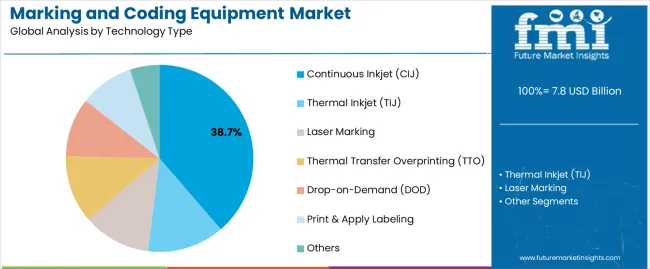
The continuous inkjet segment is projected to account for 38.7% of the marking and coding equipment market in 2025, reaffirming its position as the leading technology category. Food & beverage manufacturers and pharmaceutical packagers increasingly utilize CIJ printers for their non-contact printing capabilities, excellent high-speed performance characteristics, and widespread adoption in bottling, canning, and flexible packaging applications. The CIJ technology's established industry standardization and consistent ink formulation directly address the industrial requirements for reliable variable data printing in high-volume production environments.
This technology segment forms the foundation of modern packaging operations, as it represents the coding solution with the greatest market penetration and established demand across multiple industry verticals and global markets. Manufacturer investments in enhanced printhead precision and advanced solvent formulations continue to strengthen adoption among food producers and pharmaceutical packagers. With companies prioritizing operational uptime and print quality, CIJ printers align with both performance requirements and equipment compatibility objectives, making them the central component of comprehensive coding strategies.
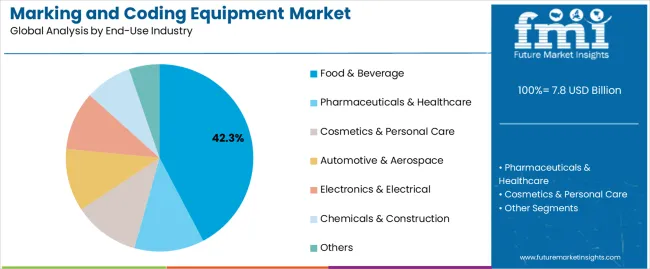
Food & beverage applications are projected to represent 42.3% of marking and coding equipment demand in 2025, underscoring their critical role as the primary industrial consumers of coding technologies for packaged food production, beverage bottling, and processed food distribution. Food manufacturers prefer marking and coding equipment for their exceptional traceability capabilities, superior print clarity, and ability to ensure regulatory compliance while enabling lot tracking with date coding formats. Positioned as essential coding platforms for modern food processing and beverage packaging operations, marking and coding systems offer both functional advantages and supply chain visibility benefits.
The segment is supported by continuous innovation in substrate compatibility technologies and the growing availability of specialized ink formulations that enable adhesion performance with enhanced resistance properties and variable data integration. Additionally, food & beverage producers are investing in high-speed automated lines to support large-volume marking and coding utilization and packaging efficiency. As food safety regulations become more stringent and consumer transparency demands increase, food & beverage applications will continue to dominate the end-use market while supporting advanced traceability coding and expiration date marking strategies.
The marking and coding equipment market is advancing rapidly due to increasing demand for traceability solutions in pharmaceutical industries and growing adoption of automated coding systems that provide superior identification performance and regulatory compliance while enabling counterfeit prevention across diverse manufacturing and distribution applications. The market faces challenges, including high initial capital investments, complexity of integration with existing production lines, and the need for specialized technical expertise for equipment maintenance. Innovation in digital printing capabilities and IoT connectivity continues to influence product development and market expansion patterns.
The growing adoption of connected equipment, cloud-based monitoring systems, and predictive maintenance technologies is enabling manufacturers to implement marking and coding solutions with superior operational intelligence, enhanced equipment performance, and remote diagnostics functionalities. Advanced IoT integration provides improved uptime monitoring while allowing more efficient production management and consistent quality across various manufacturing applications and facility locations. Manufacturers are increasingly recognizing the competitive advantages of smart equipment capabilities for operational efficiency and preventive maintenance optimization.
Modern marking and coding equipment producers are incorporating advanced serialization capabilities, unique product identifier generation, and aggregation technologies to enhance regulatory compliance, enable supply chain visibility, and deliver value-added authentication solutions to pharmaceutical companies and healthcare packaging operations. These technologies improve product security while enabling new operational capabilities, including real-time tracking, verification systems, and counterfeit detection. Advanced serialization integration also allows manufacturers to support pharmaceutical companies and regulatory compliance beyond traditional coding approaches.
| Country | CAGR (2025-2035) |
|---|---|
| China | 7.3% |
| India | 8.5% |
| USA | 5.2% |
| Germany | 4.9% |
| Japan | 4.6% |
| Brazil | 6.4% |
| United Kingdom | 5.1% |
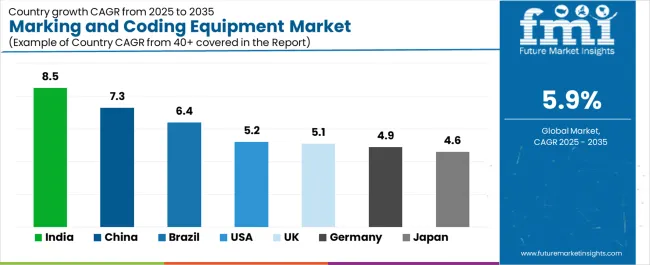
The marking and coding equipment market is experiencing strong growth globally, with India leading at an 8.5% CAGR through 2035, driven by the expanding pharmaceutical manufacturing sector, growing food processing industry, and significant investment in automated packaging infrastructure development. China follows at 7.3%, supported by rapid manufacturing sector expansion, increasing export packaging demand, and growing adoption of smart factory technologies. The USA shows growth at 5.2%, emphasizing pharmaceutical serialization compliance and advanced traceability system implementation. Brazil records 6.4%, focusing on food safety regulation compliance and growing beverage production capacity. Germany demonstrates 4.9% growth, prioritizing precision equipment manufacturing and Industry 4.0 integration excellence. Japan exhibits 4.6% growth, emphasizing quality control and pharmaceutical packaging innovation. The United Kingdom shows 5.1% growth, supported by pharmaceutical manufacturing concentration and food safety regulation advancement.
The report covers an in-depth analysis of 40+ countries, with top-performing countries highlighted below.
Revenue from marking and coding equipment in China is projected to exhibit exceptional growth with a CAGR of 7.3% through 2035, driven by expanding manufacturing capabilities and rapidly growing packaging demand supported by export-oriented production development. The country's strong position in pharmaceutical manufacturing and increasing investment in smart factory infrastructure are creating substantial demand for marking and coding equipment solutions. Major manufacturers and international packaging companies are establishing comprehensive equipment distribution capabilities to serve both domestic production demand and regional export markets.
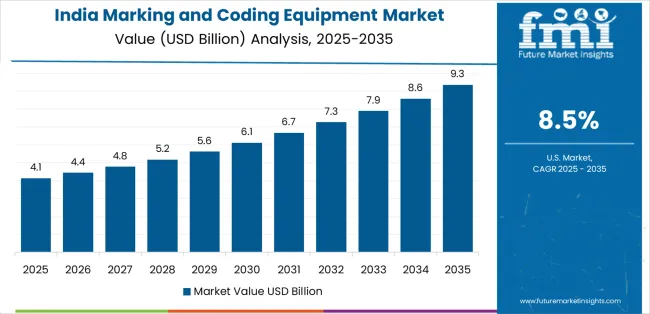
Demand for marking and coding equipment in India is expanding at a CAGR of 8.5%, supported by the country's position as a global pharmaceutical manufacturing hub, expanding food processing sector, and increasing adoption of automated packaging solutions. The country's government initiatives promoting quality standards and growing manufacturing capabilities are driving requirements for sophisticated coding equipment. International suppliers and domestic manufacturers are establishing extensive production and service capabilities to address the growing demand for marking and coding products.
Revenue from marking and coding equipment in the USA is growing at a CAGR of 5.2%, supported by the country's stringent pharmaceutical serialization requirements, strong emphasis on supply chain traceability, and robust demand for high-performance coding systems in regulated industries. The nation's advanced pharmaceutical sector and compliance-focused operations are driving sophisticated serialization equipment adoption throughout the supply chain. Leading manufacturers and technology providers are investing extensively in track-and-trace capabilities and data integration features to serve both domestic and international markets.
Demand for marking and coding equipment in Germany is growing at a CAGR of 4.9%, driven by the country's precision manufacturing leadership, advanced industrial automation capabilities, and strategic focus on Industry 4.0 integration. Germany's technical excellence and quality focus are supporting demand for marking and coding equipment in pharmaceutical packaging, automotive component marking, and food & beverage applications. Manufacturers are establishing comprehensive automation capabilities to serve both domestic producers and international specialty markets.
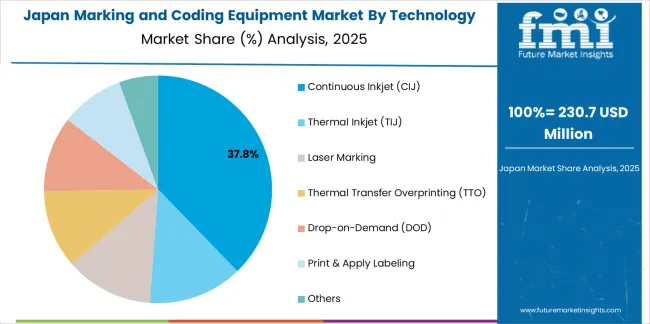
Revenue from marking and coding equipment in Japan is anticipated to grow at a CAGR of 4.6%, driven by the country's expertise in precision manufacturing, emphasis on quality standards, and strong position in pharmaceutical and electronics production. Japan's established equipment technology capabilities and commitment to manufacturing excellence are supporting investment in advanced marking technologies throughout major industrial centers. Industry leaders are establishing comprehensive quality systems to serve domestic pharmaceutical producers and electronics manufacturers.
Demand for marking and coding equipment in Brazil is expanding at a CAGR of 6.4%, supported by the country's large food processing industry, growing beverage production sector, and strategic position in Latin American markets. Brazil's agricultural processing capabilities and integrated packaging infrastructure are driving demand for reliable marking and coding equipment in food packaging, beverage bottling, and consumer goods applications. Leading manufacturers are investing in specialized capabilities to serve the diverse requirements of food safety and traceability regulations.
Revenue from marking and coding equipment in the United Kingdom is growing at a CAGR of 5.1%, driven by the country's pharmaceutical manufacturing concentration, stringent food safety regulations, and strategic focus on supply chain traceability. The UK's regulatory excellence and quality focus are supporting demand for marking and coding equipment in pharmaceutical packaging, food production, and specialty manufacturing applications. Manufacturers are establishing comprehensive compliance capabilities to serve both domestic producers and export markets.
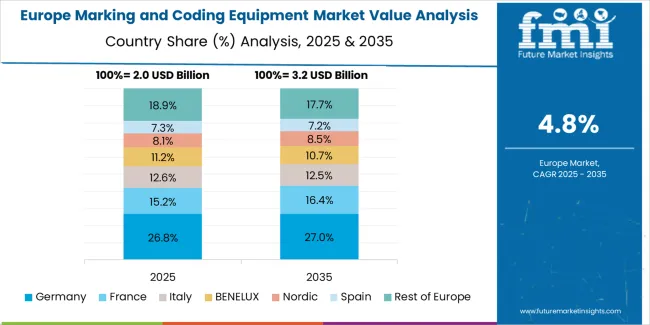
The marking and coding equipment market in Europe is projected to grow from USD 2.1 billion in 2025 to USD 3.8 billion by 2035, registering a CAGR of 6.1% over the forecast period. Germany is expected to maintain its leadership position with a 31.2% market share in 2025, declining slightly to 30.5% by 2035, supported by its strong precision manufacturing base, advanced automation capabilities, and comprehensive pharmaceutical and automotive production sector serving diverse marking and coding applications across Europe.
The United Kingdom follows with a 19.8% share in 2025, projected to reach 20.3% by 2035, driven by robust demand for marking and coding equipment in pharmaceutical packaging, food production applications, and consumer goods manufacturing, combined with established pharmaceutical infrastructure and export-oriented production expertise. France holds an 18.5% share in 2025, expected to reach 19.0% by 2035, supported by strong food & beverage production and pharmaceutical manufacturing activities. Italy commands a 13.2% share in 2025, projected to reach 13.8% by 2035, while Spain accounts for 8.7% in 2025, expected to reach 9.2% by 2035. The Netherlands maintains a 3.8% share in 2025, growing to 4.0% by 2035. The Rest of Europe region, including Nordic countries, Eastern Europe, Poland, Belgium, and other nations, is anticipated to maintain momentum, with its collective share moving from 4.8% to 3.2% by 2035, attributed to increasing pharmaceutical manufacturing in Eastern Europe and growing food processing activities in Nordic countries implementing advanced coding programs.
The marking and coding equipment market is characterized by competition among established equipment manufacturers, specialized technology providers, and integrated packaging solutions companies. Companies are investing in printhead technology research, ink formulation optimization, IoT connectivity development, and comprehensive product portfolios to deliver consistent, high-performance, and application-specific marking and coding equipment solutions. Innovation in laser technologies, serialization capabilities, and automation compatibility is central to strengthening market position and competitive advantage.
Domino Printing Sciences leads the market with a strong market share, offering comprehensive marking and coding equipment with a focus on pharmaceutical and food & beverage applications. Videojet Technologies (Danaher) provides specialized coding solutions with an emphasis on continuous inkjet systems and laser marking platforms. Markem-Imaje (Dover) delivers innovative equipment products with a focus on thermal transfer overprinting and industrial coding applications. Hitachi Industrial Equipment specializes in high-speed CIJ systems and automated coding solutions for diverse industries. KEYENCE Corporation focuses on laser marking systems and vision verification technologies. Illinois Tool Works Inc. offers integrated coding equipment through multiple subsidiaries with emphasis on packaging line integration.
| Items | Values |
|---|---|
| Quantitative Units (2025) | USD 7.8 billion |
| Technology Type | Continuous Inkjet (CIJ), Thermal Inkjet (TIJ), Laser Marking, Thermal Transfer Overprinting (TTO), Others |
| End-Use Industry | Food & Beverage, Pharmaceuticals & Healthcare, Cosmetics & Personal Care, Automotive & Aerospace, Electronics & Electrical, Others |
| Product Form | Printers, Consumables (Inks, Solvents, Ribbons), Spare Parts & Services |
| Application | Primary Packaging, Secondary Packaging, Tertiary Packaging |
| Ink Type | Solvent-Based, Water-Based, UV-Curable, Others |
| Regions Covered | North America, Europe, East Asia, South Asia & Pacific, Latin America, Middle East & Africa |
| Countries Covered | United States, Canada, United Kingdom, Germany, France, China, Japan, India, South Korea, Brazil, Australia and 40+ countries |
| Key Companies Profiled | Domino Printing Sciences, Videojet Technologies, Markem-Imaje, Hitachi Industrial Equipment, KEYENCE Corporation, and Illinois Tool Works Inc. |
| Additional Attributes | Dollar sales by technology type and end-use industry, regional demand trends, competitive landscape, technological advancements in printhead systems, ink formulation development, IoT integration innovation, and supply chain dynamics |
The global marking and coding equipment market is estimated to be valued at USD 7.8 billion in 2025.
The market size for the marking and coding equipment market is projected to reach USD 13.8 billion by 2035.
The marking and coding equipment market is expected to grow at a 5.9% CAGR between 2025 and 2035.
The key product types in marking and coding equipment market are continuous inkjet (cij) , thermal inkjet (tij), laser marking, thermal transfer overprinting (tto), drop-on-demand (dod), print & apply labeling and others.
In terms of end-use industry, food & beverage segment to command 42.3% share in the marking and coding equipment market in 2025.


Full Research Suite comprises of:
Market outlook & trends analysis
Interviews & case studies
Strategic recommendations
Vendor profiles & capabilities analysis
5-year forecasts
8 regions and 60+ country-level data splits
Market segment data splits
12 months of continuous data updates
DELIVERED AS:
PDF EXCEL ONLINE
Market Positioning & Share in Marking and Coding Equipment
Marking Coating Market Size and Share Forecast Outlook 2025 to 2035
Pin Marking Machine Market Growth - Trends & Forecast 2025 to 2035
Tire Marking Machine Market Size and Share Forecast Outlook 2025 to 2035
Road Marking Paint Market - Trends & Forecast 2025 to 2035
Pipe Marking Tapes Market Growth - Demand, Trends & Forecast 2024 to 2034
Road Marking Equipment Market Analysis - Size, Share, and Forecast Outlook 2025 to 2035
Road Marking Paints and Coatings Market Size and Share Forecast Outlook 2025 to 2035
Floor Marking Tape Market Analysis - Size and Share Forecast Outlook 2025 to 2035
Laser Marking Market Insights - Growth & Forecast 2025 to 2035
Laser Marking Machines Market
Laser Marking Equipment Market Size and Share Forecast Outlook 2025 to 2035
AI Watermarking Market Size and Share Forecast Outlook 2025 to 2035
Dot Peen Marking Machines Market Size and Share Forecast Outlook 2025 to 2035
Laser Wire Marking Systems Market Size and Share Forecast Outlook 2025 to 2035
Industrial Marking Equipment Market Growth - Trends & Forecast 2025 to 2035
Laser Cable Marking Market Size and Share Forecast Outlook 2025 to 2035
Traffic Road Marking Coatings Market Size and Share Forecast Outlook 2025 to 2035
Latin America Road Marking Paint & Coating Market Trends - Growth, Demand & Forecast 2025 to 2035
Content Protection and Watermarking Market

Thank you!
You will receive an email from our Business Development Manager. Please be sure to check your SPAM/JUNK folder too.
Chat With
MaRIA