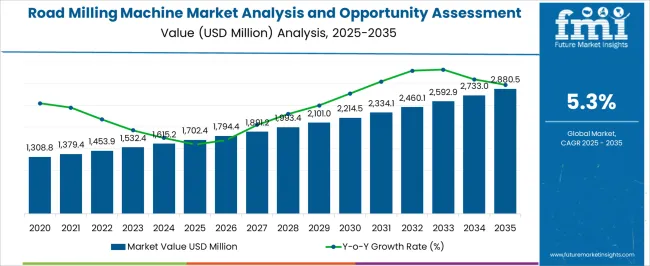
The Road Milling Machine Market Analysis and Opportunity Assessment in India is estimated to be valued at USD 1702.4 million in 2025 and is projected to reach USD 2880.5 million by 2035, registering a compound annual growth rate (CAGR) of 5.3% over the forecast period.
| Metric | Value |
|---|---|
| Road Milling Machine Market Analysis and Opportunity Assessment in India Estimated Value in (2025 E) | USD 1702.4 million |
| Road Milling Machine Market Analysis and Opportunity Assessment in India Forecast Value in (2035 F) | USD 2880.5 million |
| Forecast CAGR (2025 to 2035) | 5.3% |
The road milling machine market in India is experiencing significant growth, propelled by increasing investments in road infrastructure modernization, highway expansion, and urban development projects. Demand is strongly influenced by government-backed initiatives to improve connectivity and upgrade deteriorating road networks, creating sustained opportunities for advanced milling technologies. Tracked models dominate the landscape due to their superior performance on large-scale projects, while evolving technology trends are shifting focus toward automation and precision.
Rising urbanization and the need for efficient road repair solutions have further boosted adoption. The current outlook is reinforced by the push for cost-efficient, time-saving, and durable road rehabilitation methods.
With the integration of telematics and semi-autonomous functionalities, the market is transitioning toward higher productivity and operational safety. Looking forward, steady public and private sector investments are expected to drive consistent growth, establishing India as a key regional hub for milling equipment demand.
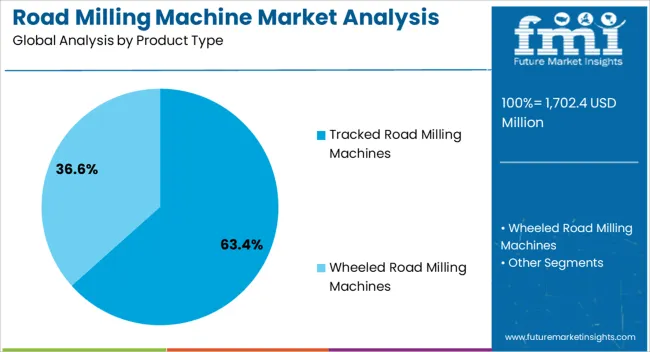
The tracked road milling machines segment dominates the product type category, accounting for approximately 63.40% share. This leadership is supported by the segment’s ability to deliver enhanced traction, stability, and productivity in large-scale highway and urban redevelopment projects.
Tracked machines are preferred for their capability to handle heavy-duty milling tasks, ensuring precise removal of asphalt and concrete layers under challenging conditions. Their adaptability to uneven surfaces and higher operational efficiency compared to wheeled variants has reinforced their dominance.
The segment further benefits from widespread use in government-funded infrastructure projects that demand high-performance equipment. With continuous advancements in durability and operator comfort, tracked road milling machines are expected to maintain a strong foothold in India’s expanding infrastructure market.
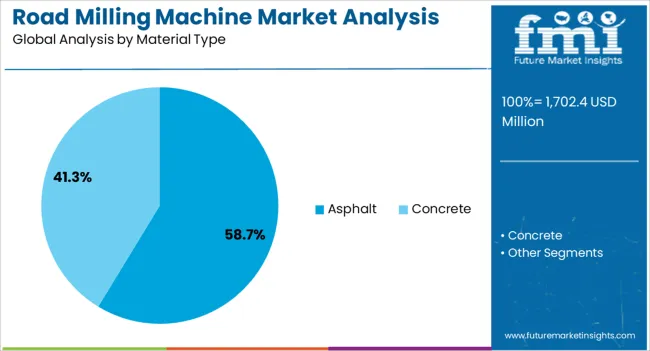
The asphalt segment leads the material type category, holding approximately 58.70% share. The segment’s dominance is driven by the extensive use of asphalt in India’s road construction and resurfacing projects.
Milling machines play a crucial role in asphalt removal, recycling, and surface preparation, making them indispensable in rehabilitation efforts. Increasing emphasis on asphalt recycling for cost and sustainability benefits has further strengthened demand.
Municipal bodies and contractors rely heavily on asphalt milling due to its efficiency and environmental advantages. With India’s growing focus on sustainable road development and improved quality standards, the asphalt segment is expected to continue commanding the majority share in the material type category.
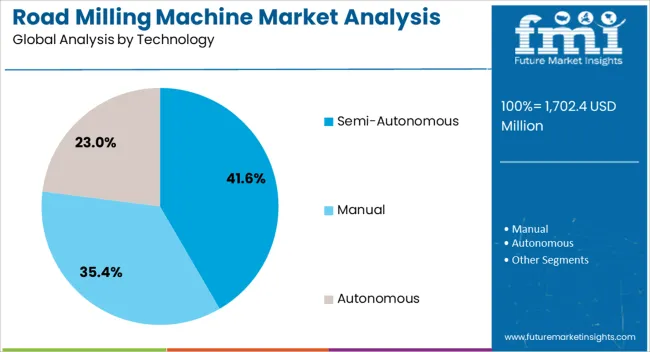
The semi-autonomous segment dominates the technology category with approximately 41.60% share. This dominance reflects the growing adoption of advanced milling systems equipped with GPS guidance, sensors, and automated depth control.
Semi-autonomous technologies enhance precision, reduce operator fatigue, and improve overall efficiency, aligning with the increasing demand for technologically advanced equipment in India’s road sector. Contractors are adopting semi-autonomous models to minimize errors, cut fuel consumption, and optimize time on-site.
Although fully autonomous technologies are emerging, semi-autonomous systems currently offer the best balance of cost, reliability, and operator oversight. As digital transformation accelerates in India’s construction sector, the semi-autonomous segment is expected to remain the most prominent technological choice in the near to medium term.
Revenue to Expand About 1.7X through 2035
The road milling machine industry is forecast to expand around 1.7X through 2035, amid a 4.2% increase in estimated CAGR compared to the historical one. This is due to several factors, including:
West India Takes the Lead in India with a Dominant Value Share
In the dynamic landscape of the Indian road milling machine industry, West India emerges as the frontrunner, boasting a prominent value share nationwide. Fueled by robust infrastructure development, urbanization, and governmental initiatives, the region demonstrates a remarkable demand for road milling machines.
The versatility and efficiency of road milling machines align seamlessly with the diverse construction needs in West India. As road safety and sustainability take center stage, the industry dominance of road milling machines in this region signifies a pivotal shift in construction practices.
Maharashtra, Gujarat, and Rajasthan, three states in West India, contribute significantly to the country's road network. These states, along with the rest of West India, account for a combined share of 41.4% of the road network in India.
As of 2020/2020, India has a total road network of over 58.98 lakh kilometers, with Maharashtra leading from the forefront. This expanding road network in these states will play a key role in improving West India’s road milling machine industry share through 2035.
Tracked Road Milling Machines Remain Top Selling Products
As per the latest report, tracked road milling machines are expected to remain the top-selling products globally. This is due to rising end user preference for these machines as they provide better stability and traction, particularly on uneven or soft surfaces.
Currently, the tracked road milling machines segment holds a value share of about 60.3%. In the assessment period, the target segment is set to record a CAGR of 5.7%.
Tracked road milling machines are designed with a tracked undercarriage system, utilizing rubber or steel tracks. This configuration provides enhanced traction and stability, making it well-suited for challenging terrains and uneven surfaces.
Tracked road milling machines excel in navigating diverse conditions with superior control. This is making them ideal for projects requiring mobility across varying terrains, such as road construction sites with rough or uneven surfaces.
The surge in demand for tracked road milling machines is fueled by their superior mobility, stability, and precision. Offering enhanced versatility across terrains, these machines ensure efficient milling operations, reduced ground pressure, and increased safety.
Ongoing technological advancements and industry recognition further contribute to their growing popularity in road construction and rehabilitation projects. Hence, the tracked road milling machines category is predicted to lead the global industry.
Road milling machines, also known as cold planners, are witnessing strong demand across nations like India, China, and the United States. This is due to the ability of these heavy-duty construction machines to quickly and efficiently remove old asphalt or concrete surfaces from roads, bridges, and other large concrete areas.
Several factors are expected to boost growth of the road milling machine market during the assessment period. These include rapid urbanization and rising road construction and maintenance activities.
There is a pressing need for road rehabilitation and maintenance due to aging road surfaces and increasing traffic demands. Road milling machines contribute significantly by removing worn-out layers, enhancing road smoothness, and ensuring safety. The market's vitality is underscored by the emphasis on infrastructure development, particularly in urbanizing regions.
Technological advancements are amplifying market dynamics, with innovations improving efficiency, precision, and environmental sustainability. The ability of road milling machines to recycle materials aligns with the growing preference for eco-friendly construction practices.
The market's future trajectory appears promising as global urbanization continues, necessitating advanced road construction and maintenance techniques. Road milling machines are positioned as indispensable tools in this evolving landscape, contributing to smoother roads, increased safety, and sustainable infrastructure development.
As the industry evolves, ongoing innovation and a focus on environmental considerations are expected to drive further advancements in road milling machine technology. This will benefit the target industry during the assessment period.
Sales of road milling machines recorded a CAGR of 1.2% between 2020 and 2025. Total market revenue reached about USD 1,615.2 million in 2025. In the assessment period, the road milling machine industry is set to thrive at a CAGR of 5.4%.
| Historical CAGR (2020 to 2025) | 1.2% |
|---|---|
| Forecast CAGR (2025 to 2035) | 5.4% |
The road milling machine industry witnessed slow growth between 2020 and 2025. This was due to the outbreak of the COVID-19 pandemic, which had widespread effects on global economies. Lockdowns, supply chain disruptions, and project delays due to the pandemic contributed to the slow growth in the road milling machine market during this timeframe.
Future Scope of the Road Milling Machine Market
Over the forecast period, the target market is set to record steady growth, totaling USD 2,863.0 million by 2035. This is due to increasing infrastructure investments, technological advancements, regulatory support, and recovering global economic conditions.
Increasing Demand for Road Maintenance and Repair
The increasing demand for road maintenance and repair serves as a significant driver for the road milling machine industry. As growing traffic volumes place strain on road networks, there is a heightened need for effective maintenance and repair activities to ensure road safety and longevity.
The demand for road maintenance and repair is further fueled by the emphasis on preserving existing road assets, reducing traffic disruptions, and enhancing overall transportation efficiency. Road milling machines play a crucial role in these efforts by facilitating the removal of deteriorated pavement layers and preparing surfaces for new overlays, thereby contributing to the smooth execution of maintenance and repair projects.
Nations like India are witnessing new road expansion and maintenance projects. This is expected to propel the adoption of road milling machines and boost sales growth during the forecast period.
According to the Basic Road Statistics of India 2020 to 2020, the total length of roads in India is 59.64 lakh km. Out of this, 4.7 lakh km are national highways, 2.59 lakh km are state highways, and 52.35 lakh km are rural roads. This expanding road infrastructure network is creating a conducive environment for the growth of the road milling machine industry.
India's National Highway Development Program focuses on maintaining and upgrading its vast roadway network. Similarly, the government is allocating enormous funds for road repair and maintenance activities. This will positively influence road milling machine sales through 2035.
Increasing Construction and Rapid Urbanization to Uplift Demand
The escalating pace of construction projects and the rapid expansion of urban areas have led to a significant surge in the demand for road milling machines. As cities grow and infrastructure development continues to accelerate, the need for efficient road construction and maintenance equipment has become increasingly pronounced.
The emphasis on infrastructure modernization and the construction of new roads to connect expanding urban areas further contributes to the escalating demand for road milling machines. As a result, manufacturers and suppliers of road milling machines are experiencing heightened interest and sales, driven by the imperative to support the ongoing construction and urbanization trends with advanced road construction equipment.
India is becoming a hotbed for road milling equipment manufacturers. This is due to expanding road infrastructure, increasing construction activities, and high government spending. As per the latest analysis, the road milling machine industry in India will likely exhibit steady growth through 2035.
Companies like Wirtgen are significantly expanding their presence across India to boost their revenue. They are focusing on increasing their customer base by launching new Wirtgen cold milling machines with enhanced features. Reduced Wirtgen cold milling machine price is also increasing their popularity across India.
Limited Accessibility in Remote Areas and Dependency on Construction Industry
The road milling machine industry faces significant restraints due to limited accessibility in remote areas and its dependency on the dynamics of the construction industry. Remote areas often lack the necessary infrastructure and support systems required for the efficient operation and maintenance of road milling machines, thereby limiting their widespread use and effectiveness.
The market's reliance on the construction industry dynamics, including funding, project timelines, and regulatory frameworks, introduces a level of uncertainty and vulnerability to external economic and policy fluctuations. This dependency can impact the demand for road milling machines, leading to inconsistent market conditions and potential challenges for industry stakeholders.
The table below highlights growth projection of the road milling machine industry in different regions. North America, East Asia, and Western Europe are projected to emerge as the leading consumers of road milling machines, with expected valuations of USD 2880.5 million, USD 783.2 million, and USD 515.4 million, respectively, in 2035.
| Region | Expected Road Milling Machine Market Revenue (2035) |
|---|---|
| North America | USD 2880.5 million |
| East Asia | USD 783.2 million |
| Western Europe | USD 515.4 million |
The table below predicts the road milling machine industry revenue in prominent areas across India. North India and West India are projected to lead with expected valuations of USD 47.0 million and USD 64.2 million, respectively, in 2035.
| Region | Road Milling Machine Market Revenue (2035) |
|---|---|
| North India | USD 47.0 million |
| East India | USD 34.5 million |
| South India | USD 45.4 million |
| West India | USD 64.2 million |
East Asia’s road milling machine industry size is projected to reach USD 783.2 million by 2035. Over the assessment period, demand for road milling machines in East Asia is set to rise at a 6.2% CAGR.
Rapid urbanization is emerging as a pivotal growth driver in East Asia. The region's pronounced urban development has propelled a surge in infrastructure projects, necessitating advanced road construction and maintenance processes.
Governments across East Asia allocate substantial budgets to infrastructure, fostering a robust construction sector and heightened demand for road milling equipment. This phenomenon is further fueled by the region's buoyant economic growth, encouraging sustained construction activities.
Robust economic growth in East Asia is leading to increasing construction activities. This is expected to further boost the demand for road milling machines as essential tools in the road construction process.
Strict adherence to regulatory standards, coupled with the adoption of cutting-edge technologies, underscores East Asia's commitment to efficient road milling processes. Further, the region's high population density and a concerted focus on transportation networks elucidate the dominance of road milling machines in East Asia's market landscape, positioning it as a key player in the global construction machinery sector.
North India is poised to exhibit strong growth during the forecast period. This is primarily due to extensive infrastructure development initiatives undertaken by governments and private entities. As North India experiences rapid urbanization, there is an escalating demand for enhanced road networks, prompting increased utilization of road milling machines.
Government investments in major projects, coupled with a focus on modernizing transportation networks, contribute to the sustained demand for road milling equipment. The region's strategic geographical location and economic significance further amplify its importance in the construction machinery sector.
Technological advancements play a crucial role, with North India embracing cutting-edge solutions to meet the evolving demands of road construction. This commitment to innovation positions the region as a hub for adopting high-performance road milling machines.
The stringent regulatory standards drive the need for precise and efficient milling processes, further fostering the prominence of road milling machines in North India. Demand in the region will also rise due to increased investments in highway and roadway reconstruction.
Sales of road milling machines in North India are projected to soar at a CAGR of around 7.2% during the assessment period. Total valuation in the country is anticipated to reach USD 47.0 million by 2035.
East India is predicted to create ample opportunities for road milling machine manufacturers, signaling a dynamic shift in the region's infrastructure landscape. The strategic positioning of East India, coupled with a burgeoning focus on development initiatives, positions the region as a key player in the road milling machine industry.
Government-driven projects and investments in East India fuel the demand for road construction and maintenance equipment, with road milling machines taking center stage in these endeavors. The region's commitment to enhancing connectivity and transportation networks amplifies the necessity for advanced machinery, offering lucrative opportunities for manufacturers.
Rapid urbanization and industrialization in East India contribute to the expansion of road networks, necessitating efficient milling processes. As the region embraces modernization, there is a discernible trend toward the adoption of cutting-edge technologies, making it an attractive market for manufacturers seeking to introduce innovative road milling solutions.
East India's proactive approach to regulatory compliance and quality standards further ensures a conducive environment for manufacturers aiming to provide high-performance road milling machines. The confluence of these factors creates a fertile ground for industry players, positioning East India as a significant growth center and a source of ample opportunities for road milling machine manufacturers.
The road milling machine market value in East India is anticipated to total USD 34.5 million by 2035. Over the forecast period, road milling machine demand in the region is set to increase at a robust CAGR of 7.7%.
The below section shows the asphalt segment dominating the industry based on material type. It is forecast to register a CAGR of 4.2% CAGR between 2025 and 2035. Based on end-use, the road construction segment is set to rise at a 5.1% CAGR through 2035.
| Top Segment (Material Type) | Asphalt |
|---|---|
| Predicted CAGR (2025 to 2035) | 4.2% |
As per the latest analysis, asphalt segment is expected to lead the road milling machine industry. It will likely expand at a CAGR of 4.2% during the assessment period. This can be attributed to the rising usage of road milling machines for removing asphalt layer from road surfaces.
Comprising bitumen and mineral aggregates, asphalt is a composite material commonly used for road surfaces. Road milling machines are instrumental in asphalt-related construction, involving the removal of worn or damaged asphalt layers.
The market for asphalt-centric milling machines revolves around equipment designed to extract existing asphalt surfaces efficiently and precisely during road maintenance and construction projects. These machines ensure optimal substrate preparation for subsequent treatments.
In asphalt road construction and maintenance, road milling machines play a fundamental role in removing deteriorated or worn-out asphalt layers effectively. This process, known as asphalt milling, is vital for preparing the surface for resurfacing, ensuring a smooth and structurally sound road.
The efficiency and precision offered by road milling machines in handling asphalt materials contribute significantly to the quality and longevity of road infrastructure. Rapid urbanization, increasing investment in road infrastructure, and the imperative for sustainable and high-performance road surfaces are expected to boost the target segment through 2035.
The versatility of road milling machines in handling various asphalt materials, including recycled asphalt pavement (RAP), further expands their utility, aligning with sustainability goals in the construction sector. Hence, demand for asphalt grinder machines is expected to remain high in the market.
| Top Segment (End-use) | Road Construction |
|---|---|
| Projected CAGR (2025 to 2035) | 5.1% |
The demand for road milling machines is expected to maintain a robust trajectory, driven by the perpetual need in the realm of road construction. As nations like India embark on ambitious infrastructure projects and urban development initiatives, the significance of road milling machines becomes increasingly pronounced.
Road milling machines play a pivotal role in the initial phases of road construction, efficiently removing worn-out or damaged road surfaces. One of the primary drivers sustaining the high demand is the continuous global urbanization trend.
The expansion of urban areas necessitates the construction and refurbishment of roads, creating an unceasing demand for road milling machines. Governments and private entities invest substantially in developing and upgrading transportation networks, further amplifying the requirement for these machines.
Road milling machines contribute significantly to project efficiency, enabling the swift and precise removal of old asphalt or concrete layers. This process is vital for preparing the roadbed for subsequent construction phases, ensuring the longevity and quality of the road infrastructure.
The machines' adaptability to various project scales, from small road repairs to extensive highway construction, underscores their versatility and relevance in the construction sector. As per the latest report, the road construction segment is projected to thrive at a 5.1% CAGR during the forecast period, totaling USD 1,870.5 million by 2035.
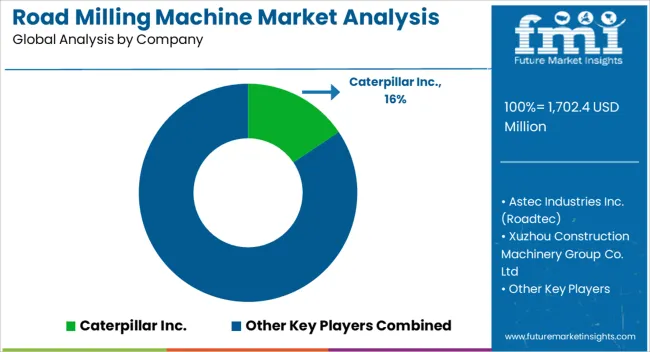
The road milling machine market is consolidated, with leading players accounting for about 45% to 50% of the share. Caterpillar Inc., Astec Industries Inc. (Roadtec), Xuzhou Construction Machinery Group Co. Ltd, Sakai Heavy Industries Ltd, Volvo Construction Equipment, BOMAG GmbH (FAYAT Group), Sany Heavy Industry Co. Ltd., Wirtgen Group, Guangxi Liugong Machinery Co Ltd, Shantui Construction Machinery Co. Ltd., and CMI Roadbuilding Limited are the leading manufacturers of road milling machines listed in the report.
Top road milling machine companies are constantly innovating to develop novel solutions with enhanced features. For instance, they are incorporating automation and other advanced technologies in their road milling equipment to increase their efficiency, precision, and productivity.
Several players are also concentrating on adopting strategies like partnerships, acquisitions, and collaborations to strengthen their footprint. They are also looking to get government contracts to maximize their profits.
Recent Developments in Road Milling Machine Market
| Attribute | Details |
|---|---|
| Estimated Value (2025) | USD 1702.4 million |
| Projected Value (2035) | USD 2880.5 million |
| Anticipated Growth Rate (2025 to 2035) | 5.3% |
| Historical Data | 2020 to 2025 |
| Forecast Period | 2025 to 2035 |
| Quantitative Units | Value (USD million) and Volume (Units) |
| Report Coverage | Revenue Forecast, Volume Forecast, Company Ranking, Competitive Landscape, Growth Factors, Trends, and Pricing Analysis |
| Market Segments Covered | Product Type, Material Type, Technology, Power, End-use, End User, Region |
| Regions Covered | India (North India; South India; East India; West India) |
| Key States Covered | Maharashtra, Gujarat, Rajasthan, Uttar Pradesh, Andhra Pradesh, Tamil Nadu, Karnataka, Bihar, Punjab, Haryana, Jharkhand, West Bengal, Telangana |
| Key Companies Profiled | Caterpillar Inc.; Astec Industries Inc. (Roadtec); Xuzhou Construction Machinery Group Co. Ltd; Sakai Heavy Industries Ltd; Volvo Construction Equipment; BOMAG GmbH (FAYAT Group); Sany Heavy Industry Co Ltd.; Wirtgen Group; Guangxi Liugong Machinery Co Ltd; Shantui Construction Machinery Co Ltd; CMI Roadbuilding Limited |
The global road milling machine market analysis and opportunity assessment in india is estimated to be valued at USD 1,702.4 million in 2025.
The market size for the road milling machine market analysis and opportunity assessment in india is projected to reach USD 2,880.5 million by 2035.
The road milling machine market analysis and opportunity assessment in india is expected to grow at a 5.3% CAGR between 2025 and 2035.
The key product types in road milling machine market analysis and opportunity assessment in india are tracked road milling machines and wheeled road milling machines.
In terms of material type, asphalt segment to command 58.7% share in the road milling machine market analysis and opportunity assessment in india in 2025.


Full Research Suite comprises of:
Market outlook & trends analysis
Interviews & case studies
Strategic recommendations
Vendor profiles & capabilities analysis
5-year forecasts
8 regions and 60+ country-level data splits
Market segment data splits
12 months of continuous data updates
DELIVERED AS:
PDF EXCEL ONLINE
Road Profile Laser Sensor Market Size and Share Forecast Outlook 2025 to 2035
Road Haulage Market Size and Share Forecast Outlook 2025 to 2035
Road Safety Market Size and Share Forecast Outlook 2025 to 2035
Road Speed Limiter Market Analysis - Size, Share, and Forecast Outlook 2025 to 2035
Road Aggregates Market Growth - Trends & Forecast 2025 to 2035
Road-Rail Vehicles Market
Road Marking Paint Market - Trends & Forecast 2025 to 2035
Road Marking Equipment Market Analysis - Size, Share, and Forecast Outlook 2025 to 2035
Road Side Drug Testing Devices Market
Road and Highway Infrastructure Market Size and Share Forecast Outlook 2025 to 2035
Road Marking Paints and Coatings Market Size and Share Forecast Outlook 2025 to 2035
Broadcast Switchers Market Size and Share Forecast Outlook 2025 to 2035
Broadcast Equipment Market Growth - Trends & Forecast 2025 to 2035
Broadband Network Gateway (BNG) Market by Component & Region Forecast till 2035
Railroad Market Size and Share Forecast Outlook 2025 to 2035
Off-road Tires Market Size and Share Forecast Outlook 2025 to 2035
Off Road Vehicles Market Size and Share Forecast Outlook 2025 to 2035
Railroad Ties Market Growth - Trends & Forecast 2025 to 2035
Off-road Motorcycle Market Growth – Trends & Forecast 2024 to 2034
Off-Road All Terrain E-Scooter Market Growth - Trends & Forecast 2024 to 2034

Thank you!
You will receive an email from our Business Development Manager. Please be sure to check your SPAM/JUNK folder too.
Chat With
MaRIA