Reports

- Global Locations -

Headquarters

Future Market Insights, Inc.

Christiana Corporate, 200
Continental Drive, Suite 401,
Newark, Delaware - 19713,
United States

T: +1-845-579-5705

Americas

Future Market Insights, Inc.

616 Corporate Way, Suite 2-9018,
Valley Cottage, NY 10989, United States

T: +1-347-918-3531

MEA

Future Market Insights

1602-6 Jumeirah Bay X2 Tower, Plot No: JLT-PH2-X2A,
Jumeirah Lakes Towers, Dubai,
United Arab Emirates

Europe

Future Market Insights

3rd Floor, 207 Regent Street,
W1B 3HH London
United Kingdom

T: + 44 (0) 20 8123 9659
D: +44 (0) 20 3287 4268

Asia Pacific

Future Market Insights

IndiaLand Global Tech Park, Unit UG-1, Behind Grand HighStreet, Phase 1, Hinjawadi, MH, Pune – 411057, India

Air Traffic Management Market Outlook (2023 to 2033)

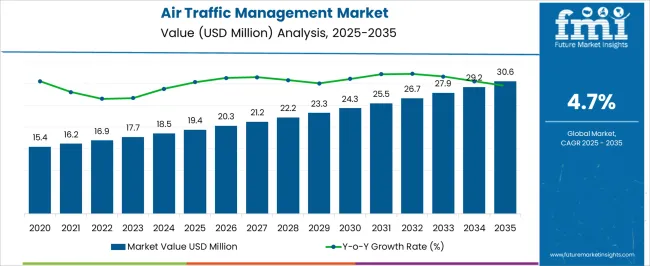
The air traffic management market is estimated to acquire US$ 10,889.2 million by 2023, with a CAGR of 4.9% during the forecast period. The market is likely to reach US$ 17,624.5 million by 2033.

Due to rapidly increasing modernization and the rise in airplanes, the adoption of air traffic management systems is anticipated to increase. Moreover, increasing traffic on the roads due to the increase in vehicles is likely to increase the demand for air traffic management during the forecast period.

The growth in travelers and increased international tourism have increased the demand for air traffic management systems in recent years. Moreover, the air traffic management industry share is expanding in the military & defense areas for managing and controlling the air traffic issues around the defense planes.

Report Attribute Details
Air Traffic Management Market Value (2023) US$ 10,889.2 million
Air Traffic Management Market Anticipated Value (2033) US$ 17,624.5 million
Air Traffic Management Industry Projected Growth Rate (2023 to 2033) 4.9%

For managing and controlling the air traffic concerns around the defense planes, the air traffic management industry share is growing in the military and defense sectors.

The airports are increasingly deploying air traffic management systems to generate alerts and alarms when any other aircraft gets closer to the airplanes. These factors are estimated to increase the demand for air traffic management in recent years. However, the vendors are focusing on technological developments in the systems to expand their product portfolios. This is expected to propel the air traffic management industry size during the forecast period.

Don't pay for what you don't need

Customize your report by selecting specific countries or regions and save 30%!

What are the Key Operator Factors in the Air Traffic Management Market?

Rising Airports

The demand for air traffic management is primarily driven by the increase in airports globally during the forecast period. In addition, there has been a constant increase in airports in developing regions such as India and China. This factor is likely to fuel the global air traffic management industry share in the coming future.

Investments

There has been an increase in the demand for smart ATM systems. Furthermore, governments have been increasingly investing in airports in the last decade. These pivotal factors are likely to support global market growth.

Remote & Virtual Towers

The deployment of remote and virtual towers has increased in the air traffic management sector. As a result, both developed and developing regions anticipate seeing an increase in the application of air traffic management.

Increased Competition

Due to increasing competition in airport traveling services, the need for efficient airspace management is further growing progressively. The airport management team is also looking to advance the technology, which provides their need for better requirements. These factors are anticipated to drive the air traffic management industry growth over the forecast period.

Safety Awareness

The air traffic management update about the plane or airplane movement, departure, and landing leads to improving the safety of the plane and the passengers. This factor is anticipated to increase the demand for air traffic management.

Along with this, the air traffic management systems are also actively contributing to maintaining the balance between the changing weather and airport activities.

Deleterious Factors that May be Holding Back the Air Traffic Management Market

The two main factors holding back the growth of the market for global air traffic management in the predicted term are higher deployment costs and a lack of awareness.

Sudip Saha
Sudip Saha

Principal Consultant

Talk to Analyst

Find your sweet spots for generating winning opportunities in this market.

Creative Opportunities that Support the Future Growth of the Air Traffic Management Market

Airlines and airport operators are constantly investing in the modernization of the air traffic management infrastructure. They are also focusing on improving the existing ATM equipment. This considerably aids in the probable acceleration of the market size.
How is North America Amplified with Advance Technology in the Air Traffic Management Market?

The North American region dominates the air traffic management industry share, acquiring 32.4% of the share during the forecast period.

Attributes Details
Advance Technology The North American air traffic management manufacturers are using unique & innovative advanced technology to generate maximum revenue in the market. This increased the adoption of air traffic management in this region in recent years.
Surge in Airports As a dominating region, North America houses several airports in various countries, another reason for the increase in the air traffic management market share.

Get the data you need at a Fraction of the cost

Personalize your report by choosing insights you need
and save 40%!

Overview of Europe Air Traffic Management Market

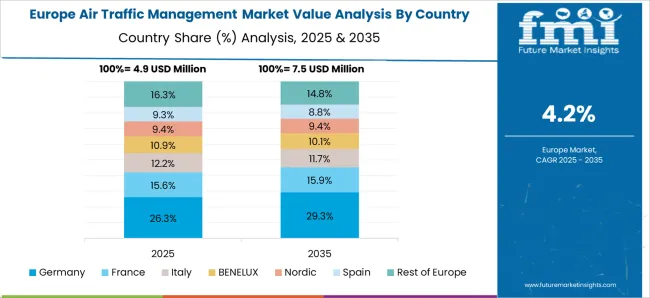
The Europe region is likely to hold the second position in the air traffic management industry share by acquiring more than 23.7% of the share during the forecast period.

Europe’s air traffic management market is rapidly increasing. The transportation industry has increased the production of air traffic management in recent years. In Europe, the increase in infrastructures, education, and tourism are leading to a rise in the market during the forecast period.

Top Air Traffic Management Start-ups v/s Established Key Players.

Air traffic start-up businesses are emphasizing cutting-edge technologies with their strategies to increase the adoption of air traffic management in a simple manner. Moreover, start-up businesses are identifying several opportunities to create new products and increase the market share for air traffic management.

The leading players operating globally have consolidated the air traffic management industry. To improve their product offerings, the key vendors continually concentrate on new technology developments in air traffic management.

Companies/ Start-ups Details
TrafficButter TrafficButter is a Nigerian-based start-up company that helps to reduce traffic congestion. Several cities and countries face traffic jams; hence, the start-up focuses on traffic management solutions with a real-time traffic information system.
Nedap Nedap is a Dutch-based company that provides smart parking solutions for vehicles in the city. It includes an automatic vehicle identification solution with IoT sensors which helps to monitor vacant parking spaces. They utilize RFID sensors and ANPR sensors to recognize the vehicle and pay parking fees automatically.
Thales Group They are a French multinational company that designs, develops, and manufactures electrical systems, devices, and equipment for the aerospace, defense, transportation, and security sectors.
FREQUENTIS AG They are an Austrian high-tech company that develops communication and information systems in air traffic management and public safety & transport.
Indra Sistemas They are a Spanish information technology and defense systems company. They are a world leader in providing proprietary solutions in Transport, Air Traffic, and Defense markets.

Recent Developments in the Air Traffic Management

  • Recently, the new 5G air-to-ground has been designed to manage air traffic seamlessly at airports. It is a wireless network that provides real-time analytics, boosting aircraft command and transferring data rapidly. Nokia Telecommunication also uses the same technology network at Brussels airport.
  • FAA is adopting TBO (Trajectory Based Operations), which is more flexible, throughput, efficient and predictable. The technology controls air traffic management and helps aircraft movement.

Other Key Participants in the Air Traffic Management Market :

  • Presagis
  • M3 Systems
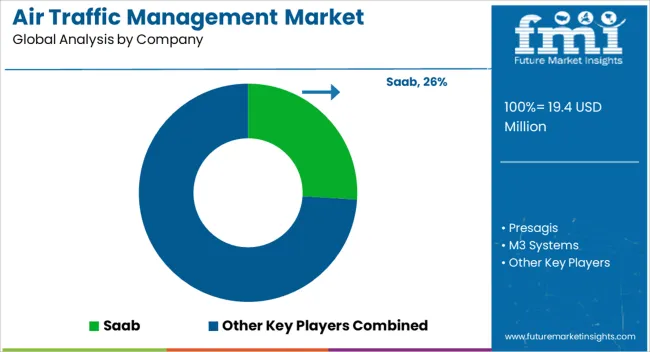
  • Saab
  • Croatia Control
  • AvitechGmbh

Report Scope

Report Attribute Details
Growth Rate CAGR of 4.9% from 2023 to 2033
Base Year for Estimation 2022
Historical Data 2018 to 2022
Forecast Period 2023 to 2033
Quantitative Units Revenue in US$ million and CAGR from 2023 to 2033
Report Coverage Revenue Forecast, Volume Forecast, Company Ranking, Competitive Landscape, Growth Factors, Trends, and Pricing Analysis
Segments Covered
  • Component
  • Application
  • Region
Regions Covered
  • North America
  • Latin America
  • Europe
  • East Asia
  • South Asia
  • Oceania
  • The Middle East and Africa
Key Countries Profiled
  • The United States
  • Canada
  • Brazil
  • Argentina
  • Germany
  • The United Kingdom
  • France
  • Spain
  • Italy
  • Nordics
  • BENELUX
  • Australia & New Zealand
  • China
  • India
  • ASEAN
  • GCC
  • South Africa
Key Companies Profiled
  • FREQUENTIS AG
  • Thales Group
  • Indra Sistemas
  • Lockheed Martin
  • Harris Corporation
  • Presagis
  • M3 Systems
  • Saab
  • Croatia Control
  • AvitechGmbh
Customization Available Upon Request

Key Segments

By Component :

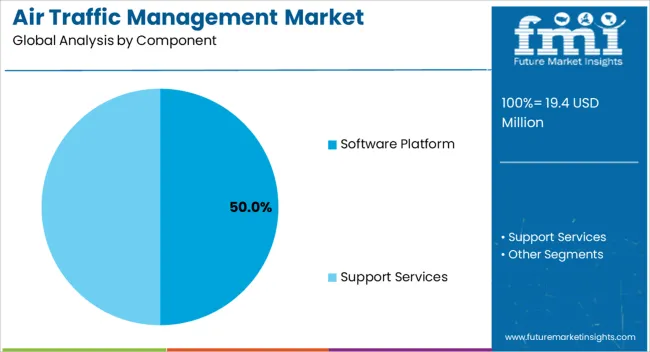
  • Software Platform
  • Support Services

By Application :

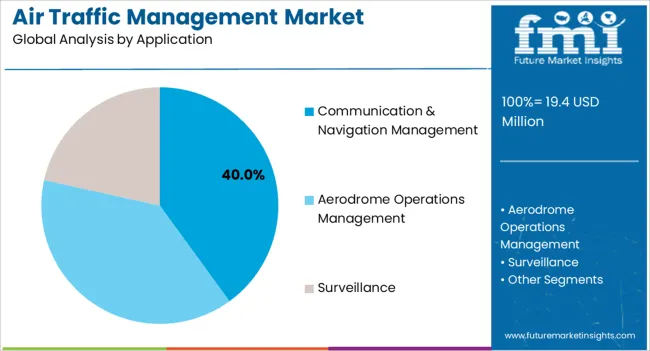
  • Communication & Navigation Management
  • Aerodrome Operations Management
  • Surveillance

By Region :

  • North America
  • Latin America
  • Europe
  • The Middle East and Africa
  • Asia Pacific

Frequently Asked Questions

What is the Growth Potential of the Market?

The growth potential of the market is 4.9% through 2033.

Which Region Holds High Lucrativeness?

North America holds high lucrativeness.

What Limits the Growth Potential of the Market?

Higher deployment costs limit the market growth.

Who are the Key Players in the Air Traffic Management Market?

Presagis, M3 Systems, and Saab are the key players in the market.

What Drives Sales in the Air Traffic Management Market?

Rising road traffic spurs demand for air traffic management.

Table of Content

1. Executive Summary

    1.1. Global Market Outlook

    1.2. Demand-side Trends

    1.3. Supply-side Trends

    1.4. Technology Roadmap Analysis

    1.5. Analysis and Recommendations

2. Market Overview

    2.1. Market Coverage / Taxonomy

    2.2. Market Definition / Scope / Limitations

3. Market Background

    3.1. Market Dynamics

        3.1.1. Drivers

        3.1.2. Restraints

        3.1.3. Opportunity

        3.1.4. Trends

    3.2. Scenario Forecast

        3.2.1. Demand in Optimistic Scenario

        3.2.2. Demand in Likely Scenario

        3.2.3. Demand in Conservative Scenario

    3.3. Opportunity Map Analysis

    3.4. Investment Feasibility Matrix

    3.5. PESTLE and Porter’s Analysis

    3.6. Regulatory Landscape

        3.6.1. By Key Regions

        3.6.2. By Key Countries

    3.7. Regional Parent Market Outlook

4. Global Market Analysis 2018 to 2022 and Forecast, 2023 to 2033

    4.1. Historical Market Size Value (US$ Million) Analysis, 2018 to 2022

    4.2. Current and Future Market Size Value (US$ Million) Projections, 2023 to 2033

        4.2.1. Y-o-Y Growth Trend Analysis

        4.2.2. Absolute $ Opportunity Analysis

5. Global Market Analysis 2018 to 2022 and Forecast 2023 to 2033, By Component

    5.1. Introduction / Key Findings

    5.2. Historical Market Size Value (US$ Million) Analysis By Component, 2018 to 2022

    5.3. Current and Future Market Size Value (US$ Million) Analysis and Forecast By Component, 2023 to 2033

        5.3.1. Software Platform

        5.3.2. Support Services

    5.4. Y-o-Y Growth Trend Analysis By Component, 2018 to 2022

    5.5. Absolute $ Opportunity Analysis By Component, 2023 to 2033

6. Global Market Analysis 2018 to 2022 and Forecast 2023 to 2033, By Application

    6.1. Introduction / Key Findings

    6.2. Historical Market Size Value (US$ Million) Analysis By Application, 2018 to 2022

    6.3. Current and Future Market Size Value (US$ Million) Analysis and Forecast By Application, 2023 to 2033

        6.3.1. Communication & Navigation Management

        6.3.2. Aerodrome Operations Management

        6.3.3. Surveillance

    6.4. Y-o-Y Growth Trend Analysis By Application, 2018 to 2022

    6.5. Absolute $ Opportunity Analysis By Application, 2023 to 2033

7. Global Market Analysis 2018 to 2022 and Forecast 2023 to 2033, By Region

    7.1. Introduction

    7.2. Historical Market Size Value (US$ Million) Analysis By Region, 2018 to 2022

    7.3. Current Market Size Value (US$ Million) Analysis and Forecast By Region, 2023 to 2033

        7.3.1. North America

        7.3.2. Latin America

        7.3.3. Western Europe

        7.3.4. Eastern Europe

        7.3.5. South Asia and Pacific

        7.3.6. East Asia

        7.3.7. Middle East and Africa

    7.4. Market Attractiveness Analysis By Region

8. North America Market Analysis 2018 to 2022 and Forecast 2023 to 2033, By Country

    8.1. Historical Market Size Value (US$ Million) Trend Analysis By Market Taxonomy, 2018 to 2022

    8.2. Market Size Value (US$ Million) Forecast By Market Taxonomy, 2023 to 2033

        8.2.1. By Country

            8.2.1.1. USA

            8.2.1.2. Canada

        8.2.2. By Component

        8.2.3. By Application

    8.3. Market Attractiveness Analysis

        8.3.1. By Country

        8.3.2. By Component

        8.3.3. By Application

    8.4. Key Takeaways

9. Latin America Market Analysis 2018 to 2022 and Forecast 2023 to 2033, By Country

    9.1. Historical Market Size Value (US$ Million) Trend Analysis By Market Taxonomy, 2018 to 2022

    9.2. Market Size Value (US$ Million) Forecast By Market Taxonomy, 2023 to 2033

        9.2.1. By Country

            9.2.1.1. Brazil

            9.2.1.2. Mexico

            9.2.1.3. Rest of Latin America

        9.2.2. By Component

        9.2.3. By Application

    9.3. Market Attractiveness Analysis

        9.3.1. By Country

        9.3.2. By Component

        9.3.3. By Application

    9.4. Key Takeaways

10. Western Europe Market Analysis 2018 to 2022 and Forecast 2023 to 2033, By Country

    10.1. Historical Market Size Value (US$ Million) Trend Analysis By Market Taxonomy, 2018 to 2022

    10.2. Market Size Value (US$ Million) Forecast By Market Taxonomy, 2023 to 2033

        10.2.1. By Country

            10.2.1.1. Germany

            10.2.1.2. UK

            10.2.1.3. France

            10.2.1.4. Spain

            10.2.1.5. Italy

            10.2.1.6. Rest of Western Europe

        10.2.2. By Component

        10.2.3. By Application

    10.3. Market Attractiveness Analysis

        10.3.1. By Country

        10.3.2. By Component

        10.3.3. By Application

    10.4. Key Takeaways

11. Eastern Europe Market Analysis 2018 to 2022 and Forecast 2023 to 2033, By Country

    11.1. Historical Market Size Value (US$ Million) Trend Analysis By Market Taxonomy, 2018 to 2022

    11.2. Market Size Value (US$ Million) Forecast By Market Taxonomy, 2023 to 2033

        11.2.1. By Country

            11.2.1.1. Poland

            11.2.1.2. RUSAa

            11.2.1.3. Czech Republic

            11.2.1.4. Romania

            11.2.1.5. Rest of Eastern Europe

        11.2.2. By Component

        11.2.3. By Application

    11.3. Market Attractiveness Analysis

        11.3.1. By Country

        11.3.2. By Component

        11.3.3. By Application

    11.4. Key Takeaways

12. South Asia and Pacific Market Analysis 2018 to 2022 and Forecast 2023 to 2033, By Country

    12.1. Historical Market Size Value (US$ Million) Trend Analysis By Market Taxonomy, 2018 to 2022

    12.2. Market Size Value (US$ Million) Forecast By Market Taxonomy, 2023 to 2033

        12.2.1. By Country

            12.2.1.1. India

            12.2.1.2. Bangladesh

            12.2.1.3. Australia

            12.2.1.4. New Zealand

            12.2.1.5. Rest of South Asia and Pacific

        12.2.2. By Component

        12.2.3. By Application

    12.3. Market Attractiveness Analysis

        12.3.1. By Country

        12.3.2. By Component

        12.3.3. By Application

    12.4. Key Takeaways

13. East Asia Market Analysis 2018 to 2022 and Forecast 2023 to 2033, By Country

    13.1. Historical Market Size Value (US$ Million) Trend Analysis By Market Taxonomy, 2018 to 2022

    13.2. Market Size Value (US$ Million) Forecast By Market Taxonomy, 2023 to 2033

        13.2.1. By Country

            13.2.1.1. China

            13.2.1.2. Japan

            13.2.1.3. South Korea

        13.2.2. By Component

        13.2.3. By Application

    13.3. Market Attractiveness Analysis

        13.3.1. By Country

        13.3.2. By Component

        13.3.3. By Application

    13.4. Key Takeaways

14. Middle East and Africa Market Analysis 2018 to 2022 and Forecast 2023 to 2033, By Country

    14.1. Historical Market Size Value (US$ Million) Trend Analysis By Market Taxonomy, 2018 to 2022

    14.2. Market Size Value (US$ Million) Forecast By Market Taxonomy, 2023 to 2033

        14.2.1. By Country

            14.2.1.1. GCC Countries

            14.2.1.2. South Africa

            14.2.1.3. Israel

            14.2.1.4. Rest of MEA

        14.2.2. By Component

        14.2.3. By Application

    14.3. Market Attractiveness Analysis

        14.3.1. By Country

        14.3.2. By Component

        14.3.3. By Application

    14.4. Key Takeaways

15. Key Countries Market Analysis

    15.1. USA

        15.1.1. Pricing Analysis

        15.1.2. Market Share Analysis, 2022

            15.1.2.1. By Component

            15.1.2.2. By Application

    15.2. Canada

        15.2.1. Pricing Analysis

        15.2.2. Market Share Analysis, 2022

            15.2.2.1. By Component

            15.2.2.2. By Application

    15.3. Brazil

        15.3.1. Pricing Analysis

        15.3.2. Market Share Analysis, 2022

            15.3.2.1. By Component

            15.3.2.2. By Application

    15.4. Mexico

        15.4.1. Pricing Analysis

        15.4.2. Market Share Analysis, 2022

            15.4.2.1. By Component

            15.4.2.2. By Application

    15.5. Germany

        15.5.1. Pricing Analysis

        15.5.2. Market Share Analysis, 2022

            15.5.2.1. By Component

            15.5.2.2. By Application

    15.6. UK

        15.6.1. Pricing Analysis

        15.6.2. Market Share Analysis, 2022

            15.6.2.1. By Component

            15.6.2.2. By Application

    15.7. France

        15.7.1. Pricing Analysis

        15.7.2. Market Share Analysis, 2022

            15.7.2.1. By Component

            15.7.2.2. By Application

    15.8. Spain

        15.8.1. Pricing Analysis

        15.8.2. Market Share Analysis, 2022

            15.8.2.1. By Component

            15.8.2.2. By Application

    15.9. Italy

        15.9.1. Pricing Analysis

        15.9.2. Market Share Analysis, 2022

            15.9.2.1. By Component

            15.9.2.2. By Application

    15.10. Poland

        15.10.1. Pricing Analysis

        15.10.2. Market Share Analysis, 2022

            15.10.2.1. By Component

            15.10.2.2. By Application

    15.11. RUSAa

        15.11.1. Pricing Analysis

        15.11.2. Market Share Analysis, 2022

            15.11.2.1. By Component

            15.11.2.2. By Application

    15.12. Czech Republic

        15.12.1. Pricing Analysis

        15.12.2. Market Share Analysis, 2022

            15.12.2.1. By Component

            15.12.2.2. By Application

    15.13. Romania

        15.13.1. Pricing Analysis

        15.13.2. Market Share Analysis, 2022

            15.13.2.1. By Component

            15.13.2.2. By Application

    15.14. India

        15.14.1. Pricing Analysis

        15.14.2. Market Share Analysis, 2022

            15.14.2.1. By Component

            15.14.2.2. By Application

    15.15. Bangladesh

        15.15.1. Pricing Analysis

        15.15.2. Market Share Analysis, 2022

            15.15.2.1. By Component

            15.15.2.2. By Application

    15.16. Australia

        15.16.1. Pricing Analysis

        15.16.2. Market Share Analysis, 2022

            15.16.2.1. By Component

            15.16.2.2. By Application

    15.17. New Zealand

        15.17.1. Pricing Analysis

        15.17.2. Market Share Analysis, 2022

            15.17.2.1. By Component

            15.17.2.2. By Application

    15.18. China

        15.18.1. Pricing Analysis

        15.18.2. Market Share Analysis, 2022

            15.18.2.1. By Component

            15.18.2.2. By Application

    15.19. Japan

        15.19.1. Pricing Analysis

        15.19.2. Market Share Analysis, 2022

            15.19.2.1. By Component

            15.19.2.2. By Application

    15.20. South Korea

        15.20.1. Pricing Analysis

        15.20.2. Market Share Analysis, 2022

            15.20.2.1. By Component

            15.20.2.2. By Application

    15.21. GCC Countries

        15.21.1. Pricing Analysis

        15.21.2. Market Share Analysis, 2022

            15.21.2.1. By Component

            15.21.2.2. By Application

    15.22. South Africa

        15.22.1. Pricing Analysis

        15.22.2. Market Share Analysis, 2022

            15.22.2.1. By Component

            15.22.2.2. By Application

    15.23. Israel

        15.23.1. Pricing Analysis

        15.23.2. Market Share Analysis, 2022

            15.23.2.1. By Component

            15.23.2.2. By Application

16. Market Structure Analysis

    16.1. Competition Dashboard

    16.2. Competition Benchmarking

    16.3. Market Share Analysis of Top Players

        16.3.1. By Regional

        16.3.2. By Component

        16.3.3. By Application

17. Competition Analysis

    17.1. Competition Deep Dive

        17.1.1. FREQUENTIS AG

            17.1.1.1. Overview

            17.1.1.2. Product Portfolio

            17.1.1.3. Profitability by Market Segments

            17.1.1.4. Sales Footprint

            17.1.1.5. Strategy Overview

                17.1.1.5.1. Marketing Strategy

        17.1.2. Thales Group

            17.1.2.1. Overview

            17.1.2.2. Product Portfolio

            17.1.2.3. Profitability by Market Segments

            17.1.2.4. Sales Footprint

            17.1.2.5. Strategy Overview

                17.1.2.5.1. Marketing Strategy

        17.1.3. Indra Sistemas

            17.1.3.1. Overview

            17.1.3.2. Product Portfolio

            17.1.3.3. Profitability by Market Segments

            17.1.3.4. Sales Footprint

            17.1.3.5. Strategy Overview

                17.1.3.5.1. Marketing Strategy

        17.1.4. Lockheed Martin

            17.1.4.1. Overview

            17.1.4.2. Product Portfolio

            17.1.4.3. Profitability by Market Segments

            17.1.4.4. Sales Footprint

            17.1.4.5. Strategy Overview

                17.1.4.5.1. Marketing Strategy

        17.1.5. Harris Corporation

            17.1.5.1. Overview

            17.1.5.2. Product Portfolio

            17.1.5.3. Profitability by Market Segments

            17.1.5.4. Sales Footprint

            17.1.5.5. Strategy Overview

                17.1.5.5.1. Marketing Strategy

        17.1.6. Presagis

            17.1.6.1. Overview

            17.1.6.2. Product Portfolio

            17.1.6.3. Profitability by Market Segments

            17.1.6.4. Sales Footprint

            17.1.6.5. Strategy Overview

                17.1.6.5.1. Marketing Strategy

        17.1.7. M3 Systems

            17.1.7.1. Overview

            17.1.7.2. Product Portfolio

            17.1.7.3. Profitability by Market Segments

            17.1.7.4. Sales Footprint

            17.1.7.5. Strategy Overview

                17.1.7.5.1. Marketing Strategy

        17.1.8. Saab

            17.1.8.1. Overview

            17.1.8.2. Product Portfolio

            17.1.8.3. Profitability by Market Segments

            17.1.8.4. Sales Footprint

            17.1.8.5. Strategy Overview

                17.1.8.5.1. Marketing Strategy

        17.1.9. Croatia Control

            17.1.9.1. Overview

            17.1.9.2. Product Portfolio

            17.1.9.3. Profitability by Market Segments

            17.1.9.4. Sales Footprint

            17.1.9.5. Strategy Overview

                17.1.9.5.1. Marketing Strategy

        17.1.10. AvitechGmbh

            17.1.10.1. Overview

            17.1.10.2. Product Portfolio

            17.1.10.3. Profitability by Market Segments

            17.1.10.4. Sales Footprint

            17.1.10.5. Strategy Overview

                17.1.10.5.1. Marketing Strategy

18. Assumptions & Acronyms Used

19. Research Methodology

Don't pay for what you don't need

Customize your report by selecting specific countries or regions and save 30%!

List of Tables

Table 01: Global Market Value (US$ Million) Forecast by Region, 2018 to 2033

Table 02: Global Market Value (US$ Million) Forecast by Component, 2018 to 2033

Table 03: Global Market Value (US$ Million) Forecast by Application, 2018 to 2033

Table 04: North America Market Value (US$ Million) Forecast by Country, 2018 to 2033

Table 05: North America Market Value (US$ Million) Forecast by Component, 2018 to 2033

Table 06: North America Market Value (US$ Million) Forecast by Application, 2018 to 2033

Table 07: Latin America Market Value (US$ Million) Forecast by Country, 2018 to 2033

Table 08: Latin America Market Value (US$ Million) Forecast by Component, 2018 to 2033

Table 09: Latin America Market Value (US$ Million) Forecast by Application, 2018 to 2033

Table 10: Western Europe Market Value (US$ Million) Forecast by Country, 2018 to 2033

Table 11: Western Europe Market Value (US$ Million) Forecast by Component, 2018 to 2033

Table 12: Western Europe Market Value (US$ Million) Forecast by Application, 2018 to 2033

Table 13: Eastern Europe Market Value (US$ Million) Forecast by Country, 2018 to 2033

Table 14: Eastern Europe Market Value (US$ Million) Forecast by Component, 2018 to 2033

Table 15: Eastern Europe Market Value (US$ Million) Forecast by Application, 2018 to 2033

Table 16: South Asia and Pacific Market Value (US$ Million) Forecast by Country, 2018 to 2033

Table 17: South Asia and Pacific Market Value (US$ Million) Forecast by Component, 2018 to 2033

Table 18: South Asia and Pacific Market Value (US$ Million) Forecast by Application, 2018 to 2033

Table 19: East Asia Market Value (US$ Million) Forecast by Country, 2018 to 2033

Table 20: East Asia Market Value (US$ Million) Forecast by Component, 2018 to 2033

Table 21: East Asia Market Value (US$ Million) Forecast by Application, 2018 to 2033

Table 22: Middle East and Africa Market Value (US$ Million) Forecast by Country, 2018 to 2033

Table 23: Middle East and Africa Market Value (US$ Million) Forecast by Component, 2018 to 2033

Table 24: Middle East and Africa Market Value (US$ Million) Forecast by Application, 2018 to 2033
Sudip Saha
Sudip Saha

Principal Consultant

Talk to Analyst

Find your sweet spots for generating winning opportunities in this market.

List of Charts

Figure 01: Global Market Value (US$ Million) by Component, 2023 to 2033

Figure 02: Global Market Value (US$ Million) by Application, 2023 to 2033

Figure 03: Global Market Value (US$ Million) by Region, 2023 to 2033

Figure 04: Global Market Value (US$ Million) Analysis by Region, 2018 to 2033

Figure 05: Global Market Value Share (%) and BPS Analysis by Region, 2023 to 2033

Figure 06: Global Market Y-o-Y Growth (%) Projections by Region, 2023 to 2033

Figure 07: Global Market Value (US$ Million) Analysis by Component, 2018 to 2033

Figure 08: Global Market Value Share (%) and BPS Analysis by Component, 2023 to 2033

Figure 09: Global Market Y-o-Y Growth (%) Projections by Component, 2023 to 2033

Figure 10: Global Market Value (US$ Million) Analysis by Application, 2018 to 2033

Figure 11: Global Market Value Share (%) and BPS Analysis by Application, 2023 to 2033

Figure 12: Global Market Y-o-Y Growth (%) Projections by Application, 2023 to 2033

Figure 13: Global Market Attractiveness by Component, 2023 to 2033

Figure 14: Global Market Attractiveness by Application, 2023 to 2033

Figure 15: Global Market Attractiveness by Region, 2023 to 2033

Figure 16: North America Market Value (US$ Million) by Component, 2023 to 2033

Figure 17: North America Market Value (US$ Million) by Application, 2023 to 2033

Figure 18: North America Market Value (US$ Million) by Country, 2023 to 2033

Figure 19: North America Market Value (US$ Million) Analysis by Country, 2018 to 2033

Figure 20: North America Market Value Share (%) and BPS Analysis by Country, 2023 to 2033

Figure 21: North America Market Y-o-Y Growth (%) Projections by Country, 2023 to 2033

Figure 22: North America Market Value (US$ Million) Analysis by Component, 2018 to 2033

Figure 23: North America Market Value Share (%) and BPS Analysis by Component, 2023 to 2033

Figure 24: North America Market Y-o-Y Growth (%) Projections by Component, 2023 to 2033

Figure 25: North America Market Value (US$ Million) Analysis by Application, 2018 to 2033

Figure 26: North America Market Value Share (%) and BPS Analysis by Application, 2023 to 2033

Figure 27: North America Market Y-o-Y Growth (%) Projections by Application, 2023 to 2033

Figure 28: North America Market Attractiveness by Component, 2023 to 2033

Figure 29: North America Market Attractiveness by Application, 2023 to 2033

Figure 30: North America Market Attractiveness by Country, 2023 to 2033

Figure 31: Latin America Market Value (US$ Million) by Component, 2023 to 2033

Figure 32: Latin America Market Value (US$ Million) by Application, 2023 to 2033

Figure 33: Latin America Market Value (US$ Million) by Country, 2023 to 2033

Figure 34: Latin America Market Value (US$ Million) Analysis by Country, 2018 to 2033

Figure 35: Latin America Market Value Share (%) and BPS Analysis by Country, 2023 to 2033

Figure 36: Latin America Market Y-o-Y Growth (%) Projections by Country, 2023 to 2033

Figure 37: Latin America Market Value (US$ Million) Analysis by Component, 2018 to 2033

Figure 38: Latin America Market Value Share (%) and BPS Analysis by Component, 2023 to 2033

Figure 39: Latin America Market Y-o-Y Growth (%) Projections by Component, 2023 to 2033

Figure 40: Latin America Market Value (US$ Million) Analysis by Application, 2018 to 2033

Figure 41: Latin America Market Value Share (%) and BPS Analysis by Application, 2023 to 2033

Figure 42: Latin America Market Y-o-Y Growth (%) Projections by Application, 2023 to 2033

Figure 43: Latin America Market Attractiveness by Component, 2023 to 2033

Figure 44: Latin America Market Attractiveness by Application, 2023 to 2033

Figure 45: Latin America Market Attractiveness by Country, 2023 to 2033

Figure 46: Western Europe Market Value (US$ Million) by Component, 2023 to 2033

Figure 47: Western Europe Market Value (US$ Million) by Application, 2023 to 2033

Figure 48: Western Europe Market Value (US$ Million) by Country, 2023 to 2033

Figure 49: Western Europe Market Value (US$ Million) Analysis by Country, 2018 to 2033

Figure 50: Western Europe Market Value Share (%) and BPS Analysis by Country, 2023 to 2033

Figure 51: Western Europe Market Y-o-Y Growth (%) Projections by Country, 2023 to 2033

Figure 52: Western Europe Market Value (US$ Million) Analysis by Component, 2018 to 2033

Figure 53: Western Europe Market Value Share (%) and BPS Analysis by Component, 2023 to 2033

Figure 54: Western Europe Market Y-o-Y Growth (%) Projections by Component, 2023 to 2033

Figure 55: Western Europe Market Value (US$ Million) Analysis by Application, 2018 to 2033

Figure 56: Western Europe Market Value Share (%) and BPS Analysis by Application, 2023 to 2033

Figure 57: Western Europe Market Y-o-Y Growth (%) Projections by Application, 2023 to 2033

Figure 58: Western Europe Market Attractiveness by Component, 2023 to 2033

Figure 59: Western Europe Market Attractiveness by Application, 2023 to 2033

Figure 60: Western Europe Market Attractiveness by Country, 2023 to 2033

Figure 61: Eastern Europe Market Value (US$ Million) by Component, 2023 to 2033

Figure 62: Eastern Europe Market Value (US$ Million) by Application, 2023 to 2033

Figure 63: Eastern Europe Market Value (US$ Million) by Country, 2023 to 2033

Figure 64: Eastern Europe Market Value (US$ Million) Analysis by Country, 2018 to 2033

Figure 65: Eastern Europe Market Value Share (%) and BPS Analysis by Country, 2023 to 2033

Figure 66: Eastern Europe Market Y-o-Y Growth (%) Projections by Country, 2023 to 2033

Figure 67: Eastern Europe Market Value (US$ Million) Analysis by Component, 2018 to 2033

Figure 68: Eastern Europe Market Value Share (%) and BPS Analysis by Component, 2023 to 2033

Figure 69: Eastern Europe Market Y-o-Y Growth (%) Projections by Component, 2023 to 2033

Figure 70: Eastern Europe Market Value (US$ Million) Analysis by Application, 2018 to 2033

Figure 71: Eastern Europe Market Value Share (%) and BPS Analysis by Application, 2023 to 2033

Figure 72: Eastern Europe Market Y-o-Y Growth (%) Projections by Application, 2023 to 2033

Figure 73: Eastern Europe Market Attractiveness by Component, 2023 to 2033

Figure 74: Eastern Europe Market Attractiveness by Application, 2023 to 2033

Figure 75: Eastern Europe Market Attractiveness by Country, 2023 to 2033

Figure 76: South Asia and Pacific Market Value (US$ Million) by Component, 2023 to 2033

Figure 77: South Asia and Pacific Market Value (US$ Million) by Application, 2023 to 2033

Figure 78: South Asia and Pacific Market Value (US$ Million) by Country, 2023 to 2033

Figure 79: South Asia and Pacific Market Value (US$ Million) Analysis by Country, 2018 to 2033

Figure 80: South Asia and Pacific Market Value Share (%) and BPS Analysis by Country, 2023 to 2033

Figure 81: South Asia and Pacific Market Y-o-Y Growth (%) Projections by Country, 2023 to 2033

Figure 82: South Asia and Pacific Market Value (US$ Million) Analysis by Component, 2018 to 2033

Figure 83: South Asia and Pacific Market Value Share (%) and BPS Analysis by Component, 2023 to 2033

Figure 84: South Asia and Pacific Market Y-o-Y Growth (%) Projections by Component, 2023 to 2033

Figure 85: South Asia and Pacific Market Value (US$ Million) Analysis by Application, 2018 to 2033

Figure 86: South Asia and Pacific Market Value Share (%) and BPS Analysis by Application, 2023 to 2033

Figure 87: South Asia and Pacific Market Y-o-Y Growth (%) Projections by Application, 2023 to 2033

Figure 88: South Asia and Pacific Market Attractiveness by Component, 2023 to 2033

Figure 89: South Asia and Pacific Market Attractiveness by Application, 2023 to 2033

Figure 90: South Asia and Pacific Market Attractiveness by Country, 2023 to 2033

Figure 91: East Asia Market Value (US$ Million) by Component, 2023 to 2033

Figure 92: East Asia Market Value (US$ Million) by Application, 2023 to 2033

Figure 93: East Asia Market Value (US$ Million) by Country, 2023 to 2033

Figure 94: East Asia Market Value (US$ Million) Analysis by Country, 2018 to 2033

Figure 95: East Asia Market Value Share (%) and BPS Analysis by Country, 2023 to 2033

Figure 96: East Asia Market Y-o-Y Growth (%) Projections by Country, 2023 to 2033

Figure 97: East Asia Market Value (US$ Million) Analysis by Component, 2018 to 2033

Figure 98: East Asia Market Value Share (%) and BPS Analysis by Component, 2023 to 2033

Figure 99: East Asia Market Y-o-Y Growth (%) Projections by Component, 2023 to 2033

Figure 100: East Asia Market Value (US$ Million) Analysis by Application, 2018 to 2033

Figure 101: East Asia Market Value Share (%) and BPS Analysis by Application, 2023 to 2033

Figure 102: East Asia Market Y-o-Y Growth (%) Projections by Application, 2023 to 2033

Figure 103: East Asia Market Attractiveness by Component, 2023 to 2033

Figure 104: East Asia Market Attractiveness by Application, 2023 to 2033

Figure 105: East Asia Market Attractiveness by Country, 2023 to 2033

Figure 106: Middle East and Africa Market Value (US$ Million) by Component, 2023 to 2033

Figure 107: Middle East and Africa Market Value (US$ Million) by Application, 2023 to 2033

Figure 108: Middle East and Africa Market Value (US$ Million) by Country, 2023 to 2033

Figure 109: Middle East and Africa Market Value (US$ Million) Analysis by Country, 2018 to 2033

Figure 110: Middle East and Africa Market Value Share (%) and BPS Analysis by Country, 2023 to 2033

Figure 111: Middle East and Africa Market Y-o-Y Growth (%) Projections by Country, 2023 to 2033

Figure 112: Middle East and Africa Market Value (US$ Million) Analysis by Component, 2018 to 2033

Figure 113: Middle East and Africa Market Value Share (%) and BPS Analysis by Component, 2023 to 2033

Figure 114: Middle East and Africa Market Y-o-Y Growth (%) Projections by Component, 2023 to 2033

Figure 115: Middle East and Africa Market Value (US$ Million) Analysis by Application, 2018 to 2033

Figure 116: Middle East and Africa Market Value Share (%) and BPS Analysis by Application, 2023 to 2033

Figure 117: Middle East and Africa Market Y-o-Y Growth (%) Projections by Application, 2023 to 2033

Figure 118: Middle East and Africa Market Attractiveness by Component, 2023 to 2033

Figure 119: Middle East and Africa Market Attractiveness by Application, 2023 to 2033

Figure 120: Middle East and Africa Market Attractiveness by Country, 2023 to 2033

Recommendations

Technology

Traffic Management System Market

Published : April 2023

Technology

Intelligent Traffic Management Market

Published : July 2022

Explore Technology Insights

View Reports

Air Traffic Management Market