Reports

- Global Locations -

Headquarters

Future Market Insights, Inc.

Christiana Corporate, 200
Continental Drive, Suite 401,
Newark, Delaware - 19713,
United States

T: +1-845-579-5705

Americas

Future Market Insights, Inc.

616 Corporate Way, Suite 2-9018,
Valley Cottage, NY 10989, United States

T: +1-347-918-3531

MEA

Future Market Insights

1602-6 Jumeirah Bay X2 Tower, Plot No: JLT-PH2-X2A,
Jumeirah Lakes Towers, Dubai,
United Arab Emirates

Europe

Future Market Insights

3rd Floor, 207 Regent Street,
W1B 3HH London
United Kingdom

T: + 44 (0) 20 8123 9659
D: +44 (0) 20 3287 4268

Asia Pacific

Future Market Insights

IndiaLand Global Tech Park, Unit UG-1, Behind Grand HighStreet, Phase 1, Hinjawadi, MH, Pune – 411057, India

Signage Market Outlook for 2024 to 2034

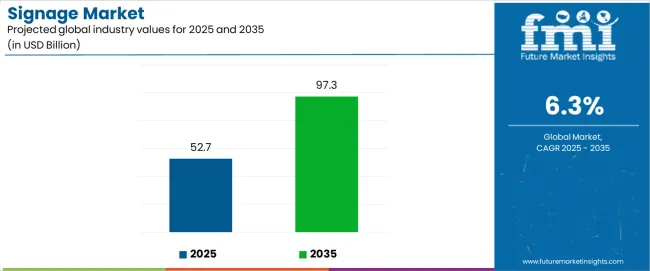
The signage market value is estimated to be valued at US$ 39.6 billion in 2024. In a highly competitive business environment, branding is important and signage plays an important role in bolstering marketing efforts of the business.

The market is predicted to grow at a CAGR of 6.6% over the forecast period. The signage industry share is estimated to reach a value of nearly US$ 75.4 billion by 2034.

Report Attribute Details
Signage Market Size (2024) US$ 39.6 billion
Anticipated Market Value (2034) US$ 75.4 billion
Projected Growth Rate (2024 to 2034) 6.6% CAGR

Don't pay for what you don't need

Customize your report by selecting specific countries or regions and save 30%!

Signage Market Trends & Analysis

  • Traditional signage is slowly losing ground owing to a lack of agility and high initial costs. Whereas, digital signage personalizes experiences along with providing real-time feedback to the customers. Furthermore, customized noise, color contrast, connectivity, and resolution are making digital signage an apt marketing tool for modern businesses.
  • Signage manufacturers are witnessing a shift from business signage to retail signage solutions. Print signage manufacturers are evolving fast with effective information display technologies and new design elements showcased on LED or Neon signage.

Historical Analysis of the Signage Market Vs. Forecast Outlook

The signage market was valued at US$ 32.5 billion in 2019. The demand for signage solutions expanded at a rate of 2.1% from 2019 to 2023. The market value was US$ 37.4 billion in 2023.

Online advertising increased after the lockdown and is now preferred more by marketers as an effective tool than its counterparts. So, though the interactive digital signage remains relevant and useful, a sluggish demand was witnessed during the post-pandemic period.

Attributes Details
Signage Market Value (2019) US$ 32.5 billion
Projected Market Revenue (2023) US$ 37.4 billion
Historical CAGR (2019 to 2023) 2.1% CAGR
Ismail Sutaria
Ismail Sutaria

Principal Consultant

Talk to Analyst

Find your sweet spots for generating winning opportunities in this market.

Prominent Factors Driving the Signage Market

Automated Content Creation to Promote Growth

IoT integration with digital signage renders automatically creating content that can be shared on displays. Furthermore, the safety of the stores can be enhanced using the digital signage. For instance, alarm systems can be connected to digital signs, which use sensors and can detect store capacity and stock depletion.

Digital Signage to be the major Revenue Generator

Multiple commercial places such as retail stores, specialty stores, hospitals, and other public spaces have witnessed high installation of digital signage in the past few years.

Interactive digital signs for in-store requirements create a better shopping experience for the customers. With digital signage, businesses have the choice to explore wide possibilities of graphics and designs to capture the attention of shoppers. Further, digital signs help in changing multiple displays without much effort. The displays can be automatically changed at pre-set intervals.

Visual Light Communication Technology to Facilitate GPS Indoors

Visible Light Communications (VLC) technologies incorporate the power of Global Positioning System (GPS) indoors, which leads to a smooth shopping experience for customers. Customers can use this technology by connecting their mobile phones to digital signage platforms.

VLC can be beneficial as the technology highlights the directions in the store that lead to the items in the shopping list through mobile applications, where the digital signage reflects the key trending products in the store. This further enables the brand owners to promote the sales of the most selling products or combinations in the store.

Comparative View of Adjacent Signage Market

The section below provides a comparison and review analysis of two more markets for the dynamics of the signage market. The adoption of digital signage systems helps businesses reduce long-term operating costs by reducing paper consumption for advertising and frequent damage and changes associated with traditional marketing activities. The expansion of the ESD protective signage label market is principally subjected to an array of industry factors along with a few definite market influences.

Signage Market:

Attributes Signage Market
CAGR (2024 to 2034) 6.6%
Growth Factor Growing demand for retail signage has helped the manufacturers of printers to emerge and grow rapidly.
Market Opportunities Growing demand for directional signage along the roads to promote a safe and comfortable drive on the roads.
Market Challenges Many businesses are increasing expenditure on online and broadcast advertisements since they reach the customers directly.

Digital Signage System Market:

Attributes Digital Signage System Market
CAGR (2024 to 2034) 11.8%
Growth Factor Digital intervention has eased the process of putting up signage to display an array of content with minimum effort.
Market Opportunities Technologies, such as voice assistance, that limit or minimize the touching of screens put up in public are anticipated to be in great demand.
Market Challenges Complicated interface, software & hardware incompatibility, and connectivity are some issues that may hamper the market growth.

ESD Protective Signage Label Market:

Attributes ESD Protective Signage Label Market
CAGR (2024 to 2034) 3%
Growth Factor Signage labels are a powerful media tool for multiple industrial sectors including education, healthcare, hospitality, transportation, and retail.
Market Opportunities Some of the most recent market developments include the integration of biometric technology with modern digitized signs.
Market Challenges Electricity consumption charges are anticipated to pose some challenges with rising fossil fuel prices.

Get the data you need at a Fraction of the cost

Personalize your report by choosing insights you need
and save 40%!

Country-wise Insights

The table below lists the countries that are likely to progress at a faster rate in the adoption of signage solutions.

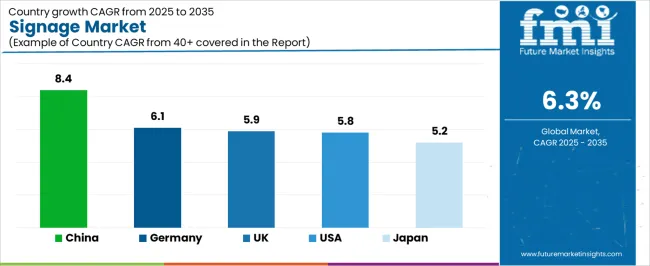
Countries CAGR (2024 to 2034)
United States 4.3%
Germany 4%
United Kingdom 5.5%
India 7.6%
China 7.1%

Advanced Technologies Driving Signage Adoption in the United States

The United States signage market is forecasted to register a CAGR of 4.3% during the projected period.

  • Over the last decade, the advertising industry in the country has witnessed a rise in the use of digital modes of advertisement.
  • LCD and LED panels are witnessing high demand in the market and rapidly replacing outdoor signage boards in the United States.

Strict Traffic Rules Boost Sales of Signage Solutions in the United Kingdom

The demand for signage solutions in the United Kingdom is expected to grow at a CAGR of 5.5% per year until 2034.

  • Wayfinding signage and signage portraying safety norms are in more demand from the government.
  • The need for creative signage solutions, such as digital displays for information sharing and improved urban experiences to drive the market in the United Kingdom.

Rapid Expansion of Small Industries Favor the Signage Market in China

The signage industry in China is likely to progress at a rate of 7.1% from 2024 to 2034.

  • Seasonal product lines from small and medium enterprises have augmented the demand for short-term promotional signs in China.
  • China is gaining ground as one of the leading markets in the Asia-Pacific for event signage printing.

Signage Manufacturers in Germany are leading the European market

  • The spike in advertisements can be attributed to the growth of the retail sector which has resulted in enormous competition between the brands.
  • German electronics makers are catering to heavy demand for digital signage to supplement their lost earnings due to declining demand from television industry.

Expanding Retail Sector Driving Demand for Signage Boards in India

Sales of signage systems in India are expected to witness a lucrative rate of 7.6% during the forecast years.

  • Multiple retail stores in India are now leveraging signage as a marketing opportunity to enhance the overall shopping experience of the customers.
  • Future trends in India’s printing industry are the development of publication printing, digital printing, package printing, and green printing.

Category-wise Insights

Outdoor Signage Attracts more Attention than Indoor Signage

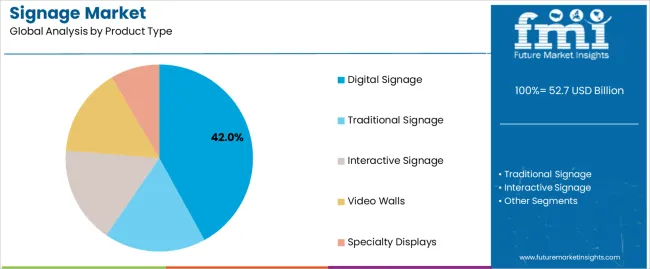
Based on product type, outdoor signage is estimated to capture maximum demand from end users over indoor signage. The outdoor signage segment is expected to contribute almost 63.4% to the global revenue in 2024.

Attributes Details
Top Product Type Outdoor Signage
Market Share in 2024 63.4%
  • The cost of effectiveness and return on investment of outdoor signage is comparatively higher than that of in-store signage as they target multiple demographics.
  • The low-cost yet highly engaging outdoor signage boards give businesses and institutions the opportunity to maximize their brand awareness and attract customers.

Commercial Stores create the most Demand for Signage Marketing

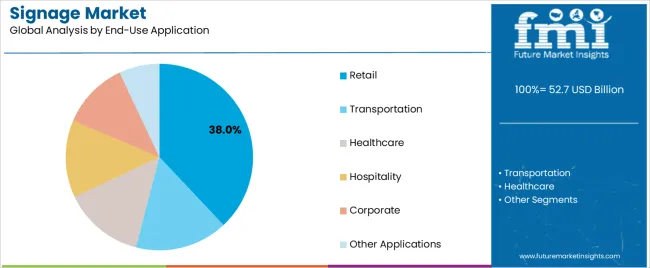
Based on end users, the consumption of signage is higher in the conventional stores and it holds a larger share in the global market. This segment is expected to capture almost 32.1% of the revenue share in 2024.

Attributes Details
Top End User Stores
Market Share in 2024 32.1%
  • The manufacturers are seeking large contracts globally and domestically by aiming to produce commercial signs as a new source of revenue.
  • Greater demand for promotional signage is now witnessed in several non-commercial sectors like schools, and offices.

Competitive Landscape

Companies operating in the present-day signage sector are part of a highly fragmented market where multiple international as well as domestic players exist at different levels. Rising demand for signage marketing solutions with technological advancement across emerging economies has led to business expansion.

Improvised product development and advanced display technologies are commonly adopted strategies by the players in the signage market. The companies are inclined towards providing green solutions to their customers. For instance, Signs Express Ltd offers an environmental advantage to its customers by switching to 100% recyclable PVC-free polypropylene board for all temporary construction site signs.

Recent Developments

  • In June 2023, the Czech-American company SignageOS offered a platform specifically designed for creating unique native apps for signage displays. The business has also separated its main signage solution into two new offerings, CloudControl and DevSpace. This company originated by offering middleware to make integration of CMS platforms with smart displays simple. Later, it added a toolkit for device management and is always adding new products to its lineup.
  • In February 2024, CastHub introduced a simple, affordable digital signage technology that embodies the idea of "Your Content. Your Screens. Simplified." With no additional hardware or technical expertise needed, this platform provides an easy-to-deploy solution for any kind of business and allows for straightforward content management on displays. CastHub is a new entrant in the digital signage market and is striving to streamline the digital content display process for companies, institutions of higher learning, and other entities.

Key Players Profiled in the Signage Market Report

  • FASTSIGNS International. Inc.
  • Signarama
  • Walton Signage Corporation
  • R.R. Donnelley & Sons Company
  • Impact Signs Inc.
  • Back Bay Sign Company
  • Pearce Signs Group
  • Sovereign Signs (Strata Holdings Limited)
  • HNS Signs Ltd
  • Allsigns International Ltd
  • Harrisons Signs Limited
  • Benson Signs Ltd.
  • Lavastar Signs Ltd
  • National Signs Ltd
  • Signs Express Ltd
  • Dlinexsign Ltd
  • One Digital Signage Ltd.

Key Coverage in the Signage Market Report

  • Signage Market Size and Share Analysis
  • Signage Market Range Coverage
  • Signage Industry Forecast
  • Signage Industry Application Overview
  • Signage Market Growth Comparison Analysis
  • Signage Market in India Analysis

Signage Market Report Scope

Attribute Details
Estimated Market Size (2024) US$ 39.6 billion
Projected Market Size (2034) US$ 75.4 billion
Anticipated Growth Rate (2024 to 2034) 6.6%
Forecast Period 2024 to 2034
Historical Data Available for 2019 to 2023
Market Analysis US$ million or billion for Value and Units for Volume
Key Regions Covered North America, Latin America, Europe, Middle East & Africa (MEA), East Asia, South Asia and Oceania
Key Countries Covered United States, Canada, Brazil, Mexico, Germany, Spain, Italy, France, United Kingdom, Russia, China, India, Australia & New Zealand, GCC Countries, and South Africa
Key Segments Covered By Product Type, By End Use Verticals, and By Region
Key Companies Profiled
  • FASTSIGNS International. Inc.
  • Signarama
  • Walton Signage Corporation
  • R.R. Donnelley & Sons Company
  • Impact Signs Inc.
  • Back Bay Sign Company
  • Pearce Signs Group
  • Sovereign Signs (Strata Holdings Limited)
  • HNS Signs Ltd
  • Allsigns International Ltd
  • Harrisons Signs Limited
  • Benson Signs Ltd.
  • Lavastar Signs Ltd
  • National Signs Ltd
  • Signs Express Ltd
  • Dlinexsign Ltd
  • One Digital Signage Ltd.
Report Coverage Market Forecast, Company Share Analysis, Competition Intelligence, DROT Analysis, Market Dynamics and Challenges, and Strategic Growth Initiatives
Customization & Pricing Available upon Request

Key Segments Covered in the Signage Industry Survey Report

By Product Type:

  • In-store Signage
    • Promotional Signage
    • Directional Signage
  • Outdoor Signage
    • Promotional Signage
    • Directional Signage

By End User:

  • Supermarkets & Hypermarkets
  • Stores
  • Schools & Offices
  • Industrial Sectors
  • Entertainment
  • Other End User Verticals

By Region:

  • North America
  • Latin America
  • Europe
  • East Asia
  • South Asia and Pacific
  • Middle East and Africa (MEA)

Frequently Asked Questions

How Big is the Signage Market in 2024?

The signage market is estimated to be around US$ 39.6 billion in 2024.

What is the Growth Outlook of the Signage Market through 2034?

The signage market is expected to grow at a CAGR of 6.6% during the forecast period.

What is the Projected Value of the Signage Market by 2034?

The signage market is predicted to be valued at US$ 75.4 billion by 2034.

What was the Historical Size of the Signage Market?

The signage market was valued at US$ 32.5 billion in 2019.

Which Regional Signage Market has the Highest Growth Potential?

Sales of signage systems in India are predicted to witness a CAGR of 7.6% through 2034.

Table of Content

1. Executive Summary

    1.1. Global Market Outlook

    1.2. Demand-side Trends

    1.3. Supply-side Trends

    1.4. Technology Roadmap Analysis

    1.5. Analysis and Recommendations

2. Market Overview

    2.1. Market Coverage / Taxonomy

    2.2. Market Definition / Scope / Limitations

3. Market Background

    3.1. Market Dynamics

        3.1.1. Drivers

        3.1.2. Restraints

        3.1.3. Opportunity

        3.1.4. Trends

    3.2. Scenario Forecast

        3.2.1. Demand in Optimistic Scenario

        3.2.2. Demand in Likely Scenario

        3.2.3. Demand in Conservative Scenario

    3.3. Opportunity Map Analysis

    3.4. Product Life Cycle Analysis

    3.5. Supply Chain Analysis

        3.5.1. Supply Side Participants and their Roles

            3.5.1.1. Producers

            3.5.1.2. Mid-Level Participants (Traders/ Agents/ Brokers)

            3.5.1.3. Wholesalers and Distributors

        3.5.2. Value Added and Value Created at Node in the Supply Chain

        3.5.3. List of Raw Material Suppliers

        3.5.4. List of Existing and Potential Buyer’s

    3.6. Investment Feasibility Matrix

    3.7. Value Chain Analysis

        3.7.1. Profit Margin Analysis

        3.7.2. Wholesalers and Distributors

        3.7.3. Retailers

    3.8. PESTLE and Porter’s Analysis

    3.9. Regulatory Landscape

        3.9.1. By Key Regions

        3.9.2. By Key Countries

    3.10. Regional Parent Market Outlook

    3.11. Production and Consumption Statistics

    3.12. Import and Export Statistics

4. Global Market Analysis 2019 to 2023 and Forecast, 2024 to 2034

    4.1. Historical Market Size Value (US$ Million) & Volume (Units) Analysis, 2019 to 2023

    4.2. Current and Future Market Size Value (US$ Million) & Volume (Units) Projections, 2024 to 2034

        4.2.1. Y-o-Y Growth Trend Analysis

        4.2.2. Absolute $ Opportunity Analysis

5. Global Market Analysis 2019 to 2023 and Forecast 2024 to 2034, By Product Type

    5.1. Introduction / Key Findings

    5.2. Historical Market Size Value (US$ Million) & Volume (Units) Analysis By Product Type, 2019 to 2023

    5.3. Current and Future Market Size Value (US$ Million) & Volume (Units) Analysis and Forecast By Product Type, 2024 to 2034

        5.3.1. In-store Signage

            5.3.1.1. Promotional Signage

            5.3.1.2. Directional Signage

        5.3.2. Outdoor Signage

            5.3.2.1. Promotional Signage

            5.3.2.2. Directional Signage

    5.4. Y-o-Y Growth Trend Analysis By Product Type, 2019 to 2023

    5.5. Absolute $ Opportunity Analysis By Product Type, 2024 to 2034

6. Global Market Analysis 2019 to 2023 and Forecast 2024 to 2034, By End-Use

    6.1. Introduction / Key Findings

    6.2. Historical Market Size Value (US$ Million) & Volume (Units) Analysis By End-Use, 2019 to 2023

    6.3. Current and Future Market Size Value (US$ Million) & Volume (Units) Analysis and Forecast By End-Use, 2024 to 2034

        6.3.1. Supermarkets & Hypermarkets

        6.3.2. Stores

        6.3.3. Schools & Offices

        6.3.4. Industrial Sectors

        6.3.5. Entertainment

        6.3.6. Others

    6.4. Y-o-Y Growth Trend Analysis By End-Use, 2019 to 2023

    6.5. Absolute $ Opportunity Analysis By End-Use, 2024 to 2034

7. Global Market Analysis 2019 to 2023 and Forecast 2024 to 2034, By Region

    7.1. Introduction

    7.2. Historical Market Size Value (US$ Million) & Volume (Units) Analysis By Region, 2019 to 2023

    7.3. Current Market Size Value (US$ Million) & Volume (Units) Analysis and Forecast By Region, 2024 to 2034

        7.3.1. North America

        7.3.2. Latin America

        7.3.3. Western Europe

        7.3.4. Eastern Europe

        7.3.5. South Asia and Pacific

        7.3.6. East Asia

        7.3.7. Middle East and Africa

    7.4. Market Attractiveness Analysis By Region

8. North America Market Analysis 2019 to 2023 and Forecast 2024 to 2034, By Country

    8.1. Historical Market Size Value (US$ Million) & Volume (Units) Trend Analysis By Market Taxonomy, 2019 to 2023

    8.2. Market Size Value (US$ Million) & Volume (Units) Forecast By Market Taxonomy, 2024 to 2034

        8.2.1. By Country

            8.2.1.1. USA

            8.2.1.2. Canada

        8.2.2. By Product Type

        8.2.3. By End-Use

    8.3. Market Attractiveness Analysis

        8.3.1. By Country

        8.3.2. By Product Type

        8.3.3. By End-Use

    8.4. Key Takeaways

9. Latin America Market Analysis 2019 to 2023 and Forecast 2024 to 2034, By Country

    9.1. Historical Market Size Value (US$ Million) & Volume (Units) Trend Analysis By Market Taxonomy, 2019 to 2023

    9.2. Market Size Value (US$ Million) & Volume (Units) Forecast By Market Taxonomy, 2024 to 2034

        9.2.1. By Country

            9.2.1.1. Brazil

            9.2.1.2. Mexico

            9.2.1.3. Rest of Latin America

        9.2.2. By Product Type

        9.2.3. By End-Use

    9.3. Market Attractiveness Analysis

        9.3.1. By Country

        9.3.2. By Product Type

        9.3.3. By End-Use

    9.4. Key Takeaways

10. Western Europe Market Analysis 2019 to 2023 and Forecast 2024 to 2034, By Country

    10.1. Historical Market Size Value (US$ Million) & Volume (Units) Trend Analysis By Market Taxonomy, 2019 to 2023

    10.2. Market Size Value (US$ Million) & Volume (Units) Forecast By Market Taxonomy, 2024 to 2034

        10.2.1. By Country

            10.2.1.1. Germany

            10.2.1.2. UK

            10.2.1.3. France

            10.2.1.4. Spain

            10.2.1.5. Italy

            10.2.1.6. Rest of Western Europe

        10.2.2. By Product Type

        10.2.3. By End-Use

    10.3. Market Attractiveness Analysis

        10.3.1. By Country

        10.3.2. By Product Type

        10.3.3. By End-Use

    10.4. Key Takeaways

11. Eastern Europe Market Analysis 2019 to 2023 and Forecast 2024 to 2034, By Country

    11.1. Historical Market Size Value (US$ Million) & Volume (Units) Trend Analysis By Market Taxonomy, 2019 to 2023

    11.2. Market Size Value (US$ Million) & Volume (Units) Forecast By Market Taxonomy, 2024 to 2034

        11.2.1. By Country

            11.2.1.1. Poland

            11.2.1.2. Russia

            11.2.1.3. Czech Republic

            11.2.1.4. Romania

            11.2.1.5. Rest of Eastern Europe

        11.2.2. By Product Type

        11.2.3. By End-Use

    11.3. Market Attractiveness Analysis

        11.3.1. By Country

        11.3.2. By Product Type

        11.3.3. By End-Use

    11.4. Key Takeaways

12. South Asia and Pacific Market Analysis 2019 to 2023 and Forecast 2024 to 2034, By Country

    12.1. Historical Market Size Value (US$ Million) & Volume (Units) Trend Analysis By Market Taxonomy, 2019 to 2023

    12.2. Market Size Value (US$ Million) & Volume (Units) Forecast By Market Taxonomy, 2024 to 2034

        12.2.1. By Country

            12.2.1.1. India

            12.2.1.2. Bangladesh

            12.2.1.3. Australia

            12.2.1.4. New Zealand

            12.2.1.5. Rest of South Asia and Pacific

        12.2.2. By Product Type

        12.2.3. By End-Use

    12.3. Market Attractiveness Analysis

        12.3.1. By Country

        12.3.2. By Product Type

        12.3.3. By End-Use

    12.4. Key Takeaways

13. East Asia Market Analysis 2019 to 2023 and Forecast 2024 to 2034, By Country

    13.1. Historical Market Size Value (US$ Million) & Volume (Units) Trend Analysis By Market Taxonomy, 2019 to 2023

    13.2. Market Size Value (US$ Million) & Volume (Units) Forecast By Market Taxonomy, 2024 to 2034

        13.2.1. By Country

            13.2.1.1. China

            13.2.1.2. Japan

            13.2.1.3. South Korea

        13.2.2. By Product Type

        13.2.3. By End-Use

    13.3. Market Attractiveness Analysis

        13.3.1. By Country

        13.3.2. By Product Type

        13.3.3. By End-Use

    13.4. Key Takeaways

14. Middle East and Africa Market Analysis 2019 to 2023 and Forecast 2024 to 2034, By Country

    14.1. Historical Market Size Value (US$ Million) & Volume (Units) Trend Analysis By Market Taxonomy, 2019 to 2023

    14.2. Market Size Value (US$ Million) & Volume (Units) Forecast By Market Taxonomy, 2024 to 2034

        14.2.1. By Country

            14.2.1.1. GCC Countries

            14.2.1.2. South Africa

            14.2.1.3. Israel

            14.2.1.4. Rest of MEA

        14.2.2. By Product Type

        14.2.3. By End-Use

    14.3. Market Attractiveness Analysis

        14.3.1. By Country

        14.3.2. By Product Type

        14.3.3. By End-Use

    14.4. Key Takeaways

15. Key Countries Market Analysis

    15.1. USA

        15.1.1. Pricing Analysis

        15.1.2. Market Share Analysis, 2023

            15.1.2.1. By Product Type

            15.1.2.2. By End-Use

    15.2. Canada

        15.2.1. Pricing Analysis

        15.2.2. Market Share Analysis, 2023

            15.2.2.1. By Product Type

            15.2.2.2. By End-Use

    15.3. Brazil

        15.3.1. Pricing Analysis

        15.3.2. Market Share Analysis, 2023

            15.3.2.1. By Product Type

            15.3.2.2. By End-Use

    15.4. Mexico

        15.4.1. Pricing Analysis

        15.4.2. Market Share Analysis, 2023

            15.4.2.1. By Product Type

            15.4.2.2. By End-Use

    15.5. Germany

        15.5.1. Pricing Analysis

        15.5.2. Market Share Analysis, 2023

            15.5.2.1. By Product Type

            15.5.2.2. By End-Use

    15.6. UK

        15.6.1. Pricing Analysis

        15.6.2. Market Share Analysis, 2023

            15.6.2.1. By Product Type

            15.6.2.2. By End-Use

    15.7. France

        15.7.1. Pricing Analysis

        15.7.2. Market Share Analysis, 2023

            15.7.2.1. By Product Type

            15.7.2.2. By End-Use

    15.8. Spain

        15.8.1. Pricing Analysis

        15.8.2. Market Share Analysis, 2023

            15.8.2.1. By Product Type

            15.8.2.2. By End-Use

    15.9. Italy

        15.9.1. Pricing Analysis

        15.9.2. Market Share Analysis, 2023

            15.9.2.1. By Product Type

            15.9.2.2. By End-Use

    15.10. Poland

        15.10.1. Pricing Analysis

        15.10.2. Market Share Analysis, 2023

            15.10.2.1. By Product Type

            15.10.2.2. By End-Use

    15.11. Russia

        15.11.1. Pricing Analysis

        15.11.2. Market Share Analysis, 2023

            15.11.2.1. By Product Type

            15.11.2.2. By End-Use

    15.12. Czech Republic

        15.12.1. Pricing Analysis

        15.12.2. Market Share Analysis, 2023

            15.12.2.1. By Product Type

            15.12.2.2. By End-Use

    15.13. Romania

        15.13.1. Pricing Analysis

        15.13.2. Market Share Analysis, 2023

            15.13.2.1. By Product Type

            15.13.2.2. By End-Use

    15.14. India

        15.14.1. Pricing Analysis

        15.14.2. Market Share Analysis, 2023

            15.14.2.1. By Product Type

            15.14.2.2. By End-Use

    15.15. Bangladesh

        15.15.1. Pricing Analysis

        15.15.2. Market Share Analysis, 2023

            15.15.2.1. By Product Type

            15.15.2.2. By End-Use

    15.16. Australia

        15.16.1. Pricing Analysis

        15.16.2. Market Share Analysis, 2023

            15.16.2.1. By Product Type

            15.16.2.2. By End-Use

    15.17. New Zealand

        15.17.1. Pricing Analysis

        15.17.2. Market Share Analysis, 2023

            15.17.2.1. By Product Type

            15.17.2.2. By End-Use

    15.18. China

        15.18.1. Pricing Analysis

        15.18.2. Market Share Analysis, 2023

            15.18.2.1. By Product Type

            15.18.2.2. By End-Use

    15.19. Japan

        15.19.1. Pricing Analysis

        15.19.2. Market Share Analysis, 2023

            15.19.2.1. By Product Type

            15.19.2.2. By End-Use

    15.20. South Korea

        15.20.1. Pricing Analysis

        15.20.2. Market Share Analysis, 2023

            15.20.2.1. By Product Type

            15.20.2.2. By End-Use

    15.21. GCC Countries

        15.21.1. Pricing Analysis

        15.21.2. Market Share Analysis, 2023

            15.21.2.1. By Product Type

            15.21.2.2. By End-Use

    15.22. South Africa

        15.22.1. Pricing Analysis

        15.22.2. Market Share Analysis, 2023

            15.22.2.1. By Product Type

            15.22.2.2. By End-Use

    15.23. Israel

        15.23.1. Pricing Analysis

        15.23.2. Market Share Analysis, 2023

            15.23.2.1. By Product Type

            15.23.2.2. By End-Use

16. Market Structure Analysis

    16.1. Competition Dashboard

    16.2. Competition Benchmarking

    16.3. Market Share Analysis of Top Players

        16.3.1. By Regional

        16.3.2. By Product Type

        16.3.3. By End-Use

17. Competition Analysis

    17.1. Competition Deep Dive

        17.1.1. FASTSIGNS International. Inc.

            17.1.1.1. Overview

            17.1.1.2. Product Portfolio

            17.1.1.3. Profitability by Market Segments

            17.1.1.4. Sales Footprint

            17.1.1.5. Strategy Overview

                17.1.1.5.1. Marketing Strategy

                17.1.1.5.2. Product Strategy

                17.1.1.5.3. Channel Strategy

        17.1.2. Signarama

            17.1.2.1. Overview

            17.1.2.2. Product Portfolio

            17.1.2.3. Profitability by Market Segments

            17.1.2.4. Sales Footprint

            17.1.2.5. Strategy Overview

                17.1.2.5.1. Marketing Strategy

                17.1.2.5.2. Product Strategy

                17.1.2.5.3. Channel Strategy

        17.1.3. Walton Corporation

            17.1.3.1. Overview

            17.1.3.2. Product Portfolio

            17.1.3.3. Profitability by Market Segments

            17.1.3.4. Sales Footprint

            17.1.3.5. Strategy Overview

                17.1.3.5.1. Marketing Strategy

                17.1.3.5.2. Product Strategy

                17.1.3.5.3. Channel Strategy

        17.1.4. R.R. Donnelley & Sons Company

            17.1.4.1. Overview

            17.1.4.2. Product Portfolio

            17.1.4.3. Profitability by Market Segments

            17.1.4.4. Sales Footprint

            17.1.4.5. Strategy Overview

                17.1.4.5.1. Marketing Strategy

                17.1.4.5.2. Product Strategy

                17.1.4.5.3. Channel Strategy

        17.1.5. Impact Signs Inc.

            17.1.5.1. Overview

            17.1.5.2. Product Portfolio

            17.1.5.3. Profitability by Market Segments

            17.1.5.4. Sales Footprint

            17.1.5.5. Strategy Overview

                17.1.5.5.1. Marketing Strategy

                17.1.5.5.2. Product Strategy

                17.1.5.5.3. Channel Strategy

        17.1.6. Back Bay Sign Company

            17.1.6.1. Overview

            17.1.6.2. Product Portfolio

            17.1.6.3. Profitability by Market Segments

            17.1.6.4. Sales Footprint

            17.1.6.5. Strategy Overview

                17.1.6.5.1. Marketing Strategy

                17.1.6.5.2. Product Strategy

                17.1.6.5.3. Channel Strategy

        17.1.7. Pearce Signs Group

            17.1.7.1. Overview

            17.1.7.2. Product Portfolio

            17.1.7.3. Profitability by Market Segments

            17.1.7.4. Sales Footprint

            17.1.7.5. Strategy Overview

                17.1.7.5.1. Marketing Strategy

                17.1.7.5.2. Product Strategy

                17.1.7.5.3. Channel Strategy

        17.1.8. Sovereign Signs (Strata Holdings Limited)

            17.1.8.1. Overview

            17.1.8.2. Product Portfolio

            17.1.8.3. Profitability by Market Segments

            17.1.8.4. Sales Footprint

            17.1.8.5. Strategy Overview

                17.1.8.5.1. Marketing Strategy

                17.1.8.5.2. Product Strategy

                17.1.8.5.3. Channel Strategy

        17.1.9. HNS Signs Ltd

            17.1.9.1. Overview

            17.1.9.2. Product Portfolio

            17.1.9.3. Profitability by Market Segments

            17.1.9.4. Sales Footprint

            17.1.9.5. Strategy Overview

                17.1.9.5.1. Marketing Strategy

                17.1.9.5.2. Product Strategy

                17.1.9.5.3. Channel Strategy

        17.1.10. Allsigns International Ltd

            17.1.10.1. Overview

            17.1.10.2. Product Portfolio

            17.1.10.3. Profitability by Market Segments

            17.1.10.4. Sales Footprint

            17.1.10.5. Strategy Overview

                17.1.10.5.1. Marketing Strategy

                17.1.10.5.2. Product Strategy

                17.1.10.5.3. Channel Strategy

18. Assumptions & Acronyms Used

19. Research Methodology

Don't pay for what you don't need

Customize your report by selecting specific countries or regions and save 30%!

List of Tables

Table 1: Global Market Value (US$ Million) Forecast by Region, 2019 to 2034

Table 2: Global Market Volume (Units) Forecast by Region, 2019 to 2034

Table 3: Global Market Value (US$ Million) Forecast by Product Type, 2019 to 2034

Table 4: Global Market Volume (Units) Forecast by Product Type, 2019 to 2034

Table 5: Global Market Value (US$ Million) Forecast by End-Use, 2019 to 2034

Table 6: Global Market Volume (Units) Forecast by End-Use, 2019 to 2034

Table 7: North America Market Value (US$ Million) Forecast by Country, 2019 to 2034

Table 8: North America Market Volume (Units) Forecast by Country, 2019 to 2034

Table 9: North America Market Value (US$ Million) Forecast by Product Type, 2019 to 2034

Table 10: North America Market Volume (Units) Forecast by Product Type, 2019 to 2034

Table 11: North America Market Value (US$ Million) Forecast by End-Use, 2019 to 2034

Table 12: North America Market Volume (Units) Forecast by End-Use, 2019 to 2034

Table 13: Latin America Market Value (US$ Million) Forecast by Country, 2019 to 2034

Table 14: Latin America Market Volume (Units) Forecast by Country, 2019 to 2034

Table 15: Latin America Market Value (US$ Million) Forecast by Product Type, 2019 to 2034

Table 16: Latin America Market Volume (Units) Forecast by Product Type, 2019 to 2034

Table 17: Latin America Market Value (US$ Million) Forecast by End-Use, 2019 to 2034

Table 18: Latin America Market Volume (Units) Forecast by End-Use, 2019 to 2034

Table 19: Western Europe Market Value (US$ Million) Forecast by Country, 2019 to 2034

Table 20: Western Europe Market Volume (Units) Forecast by Country, 2019 to 2034

Table 21: Western Europe Market Value (US$ Million) Forecast by Product Type, 2019 to 2034

Table 22: Western Europe Market Volume (Units) Forecast by Product Type, 2019 to 2034

Table 23: Western Europe Market Value (US$ Million) Forecast by End-Use, 2019 to 2034

Table 24: Western Europe Market Volume (Units) Forecast by End-Use, 2019 to 2034

Table 25: Eastern Europe Market Value (US$ Million) Forecast by Country, 2019 to 2034

Table 26: Eastern Europe Market Volume (Units) Forecast by Country, 2019 to 2034

Table 27: Eastern Europe Market Value (US$ Million) Forecast by Product Type, 2019 to 2034

Table 28: Eastern Europe Market Volume (Units) Forecast by Product Type, 2019 to 2034

Table 29: Eastern Europe Market Value (US$ Million) Forecast by End-Use, 2019 to 2034

Table 30: Eastern Europe Market Volume (Units) Forecast by End-Use, 2019 to 2034

Table 31: South Asia and Pacific Market Value (US$ Million) Forecast by Country, 2019 to 2034

Table 32: South Asia and Pacific Market Volume (Units) Forecast by Country, 2019 to 2034

Table 33: South Asia and Pacific Market Value (US$ Million) Forecast by Product Type, 2019 to 2034

Table 34: South Asia and Pacific Market Volume (Units) Forecast by Product Type, 2019 to 2034

Table 35: South Asia and Pacific Market Value (US$ Million) Forecast by End-Use, 2019 to 2034

Table 36: South Asia and Pacific Market Volume (Units) Forecast by End-Use, 2019 to 2034

Table 37: East Asia Market Value (US$ Million) Forecast by Country, 2019 to 2034

Table 38: East Asia Market Volume (Units) Forecast by Country, 2019 to 2034

Table 39: East Asia Market Value (US$ Million) Forecast by Product Type, 2019 to 2034

Table 40: East Asia Market Volume (Units) Forecast by Product Type, 2019 to 2034

Table 41: East Asia Market Value (US$ Million) Forecast by End-Use, 2019 to 2034

Table 42: East Asia Market Volume (Units) Forecast by End-Use, 2019 to 2034

Table 43: Middle East and Africa Market Value (US$ Million) Forecast by Country, 2019 to 2034

Table 44: Middle East and Africa Market Volume (Units) Forecast by Country, 2019 to 2034

Table 45: Middle East and Africa Market Value (US$ Million) Forecast by Product Type, 2019 to 2034

Table 46: Middle East and Africa Market Volume (Units) Forecast by Product Type, 2019 to 2034

Table 47: Middle East and Africa Market Value (US$ Million) Forecast by End-Use, 2019 to 2034

Table 48: Middle East and Africa Market Volume (Units) Forecast by End-Use, 2019 to 2034
Ismail Sutaria
Ismail Sutaria

Principal Consultant

Talk to Analyst

Find your sweet spots for generating winning opportunities in this market.

List of Charts

Figure 1: Global Market Value (US$ Million) by Product Type, 2024 to 2034

Figure 2: Global Market Value (US$ Million) by End-Use, 2024 to 2034

Figure 3: Global Market Value (US$ Million) by Region, 2024 to 2034

Figure 4: Global Market Value (US$ Million) Analysis by Region, 2019 to 2034

Figure 5: Global Market Volume (Units) Analysis by Region, 2019 to 2034

Figure 6: Global Market Value Share (%) and BPS Analysis by Region, 2024 to 2034

Figure 7: Global Market Y-o-Y Growth (%) Projections by Region, 2024 to 2034

Figure 8: Global Market Value (US$ Million) Analysis by Product Type, 2019 to 2034

Figure 9: Global Market Volume (Units) Analysis by Product Type, 2019 to 2034

Figure 10: Global Market Value Share (%) and BPS Analysis by Product Type, 2024 to 2034

Figure 11: Global Market Y-o-Y Growth (%) Projections by Product Type, 2024 to 2034

Figure 12: Global Market Value (US$ Million) Analysis by End-Use, 2019 to 2034

Figure 13: Global Market Volume (Units) Analysis by End-Use, 2019 to 2034

Figure 14: Global Market Value Share (%) and BPS Analysis by End-Use, 2024 to 2034

Figure 15: Global Market Y-o-Y Growth (%) Projections by End-Use, 2024 to 2034

Figure 16: Global Market Attractiveness by Product Type, 2024 to 2034

Figure 17: Global Market Attractiveness by End-Use, 2024 to 2034

Figure 18: Global Market Attractiveness by Region, 2024 to 2034

Figure 19: North America Market Value (US$ Million) by Product Type, 2024 to 2034

Figure 20: North America Market Value (US$ Million) by End-Use, 2024 to 2034

Figure 21: North America Market Value (US$ Million) by Country, 2024 to 2034

Figure 22: North America Market Value (US$ Million) Analysis by Country, 2019 to 2034

Figure 23: North America Market Volume (Units) Analysis by Country, 2019 to 2034

Figure 24: North America Market Value Share (%) and BPS Analysis by Country, 2024 to 2034

Figure 25: North America Market Y-o-Y Growth (%) Projections by Country, 2024 to 2034

Figure 26: North America Market Value (US$ Million) Analysis by Product Type, 2019 to 2034

Figure 27: North America Market Volume (Units) Analysis by Product Type, 2019 to 2034

Figure 28: North America Market Value Share (%) and BPS Analysis by Product Type, 2024 to 2034

Figure 29: North America Market Y-o-Y Growth (%) Projections by Product Type, 2024 to 2034

Figure 30: North America Market Value (US$ Million) Analysis by End-Use, 2019 to 2034

Figure 31: North America Market Volume (Units) Analysis by End-Use, 2019 to 2034

Figure 32: North America Market Value Share (%) and BPS Analysis by End-Use, 2024 to 2034

Figure 33: North America Market Y-o-Y Growth (%) Projections by End-Use, 2024 to 2034

Figure 34: North America Market Attractiveness by Product Type, 2024 to 2034

Figure 35: North America Market Attractiveness by End-Use, 2024 to 2034

Figure 36: North America Market Attractiveness by Country, 2024 to 2034

Figure 37: Latin America Market Value (US$ Million) by Product Type, 2024 to 2034

Figure 38: Latin America Market Value (US$ Million) by End-Use, 2024 to 2034

Figure 39: Latin America Market Value (US$ Million) by Country, 2024 to 2034

Figure 40: Latin America Market Value (US$ Million) Analysis by Country, 2019 to 2034

Figure 41: Latin America Market Volume (Units) Analysis by Country, 2019 to 2034

Figure 42: Latin America Market Value Share (%) and BPS Analysis by Country, 2024 to 2034

Figure 43: Latin America Market Y-o-Y Growth (%) Projections by Country, 2024 to 2034

Figure 44: Latin America Market Value (US$ Million) Analysis by Product Type, 2019 to 2034

Figure 45: Latin America Market Volume (Units) Analysis by Product Type, 2019 to 2034

Figure 46: Latin America Market Value Share (%) and BPS Analysis by Product Type, 2024 to 2034

Figure 47: Latin America Market Y-o-Y Growth (%) Projections by Product Type, 2024 to 2034

Figure 48: Latin America Market Value (US$ Million) Analysis by End-Use, 2019 to 2034

Figure 49: Latin America Market Volume (Units) Analysis by End-Use, 2019 to 2034

Figure 50: Latin America Market Value Share (%) and BPS Analysis by End-Use, 2024 to 2034

Figure 51: Latin America Market Y-o-Y Growth (%) Projections by End-Use, 2024 to 2034

Figure 52: Latin America Market Attractiveness by Product Type, 2024 to 2034

Figure 53: Latin America Market Attractiveness by End-Use, 2024 to 2034

Figure 54: Latin America Market Attractiveness by Country, 2024 to 2034

Figure 55: Western Europe Market Value (US$ Million) by Product Type, 2024 to 2034

Figure 56: Western Europe Market Value (US$ Million) by End-Use, 2024 to 2034

Figure 57: Western Europe Market Value (US$ Million) by Country, 2024 to 2034

Figure 58: Western Europe Market Value (US$ Million) Analysis by Country, 2019 to 2034

Figure 59: Western Europe Market Volume (Units) Analysis by Country, 2019 to 2034

Figure 60: Western Europe Market Value Share (%) and BPS Analysis by Country, 2024 to 2034

Figure 61: Western Europe Market Y-o-Y Growth (%) Projections by Country, 2024 to 2034

Figure 62: Western Europe Market Value (US$ Million) Analysis by Product Type, 2019 to 2034

Figure 63: Western Europe Market Volume (Units) Analysis by Product Type, 2019 to 2034

Figure 64: Western Europe Market Value Share (%) and BPS Analysis by Product Type, 2024 to 2034

Figure 65: Western Europe Market Y-o-Y Growth (%) Projections by Product Type, 2024 to 2034

Figure 66: Western Europe Market Value (US$ Million) Analysis by End-Use, 2019 to 2034

Figure 67: Western Europe Market Volume (Units) Analysis by End-Use, 2019 to 2034

Figure 68: Western Europe Market Value Share (%) and BPS Analysis by End-Use, 2024 to 2034

Figure 69: Western Europe Market Y-o-Y Growth (%) Projections by End-Use, 2024 to 2034

Figure 70: Western Europe Market Attractiveness by Product Type, 2024 to 2034

Figure 71: Western Europe Market Attractiveness by End-Use, 2024 to 2034

Figure 72: Western Europe Market Attractiveness by Country, 2024 to 2034

Figure 73: Eastern Europe Market Value (US$ Million) by Product Type, 2024 to 2034

Figure 74: Eastern Europe Market Value (US$ Million) by End-Use, 2024 to 2034

Figure 75: Eastern Europe Market Value (US$ Million) by Country, 2024 to 2034

Figure 76: Eastern Europe Market Value (US$ Million) Analysis by Country, 2019 to 2034

Figure 77: Eastern Europe Market Volume (Units) Analysis by Country, 2019 to 2034

Figure 78: Eastern Europe Market Value Share (%) and BPS Analysis by Country, 2024 to 2034

Figure 79: Eastern Europe Market Y-o-Y Growth (%) Projections by Country, 2024 to 2034

Figure 80: Eastern Europe Market Value (US$ Million) Analysis by Product Type, 2019 to 2034

Figure 81: Eastern Europe Market Volume (Units) Analysis by Product Type, 2019 to 2034

Figure 82: Eastern Europe Market Value Share (%) and BPS Analysis by Product Type, 2024 to 2034

Figure 83: Eastern Europe Market Y-o-Y Growth (%) Projections by Product Type, 2024 to 2034

Figure 84: Eastern Europe Market Value (US$ Million) Analysis by End-Use, 2019 to 2034

Figure 85: Eastern Europe Market Volume (Units) Analysis by End-Use, 2019 to 2034

Figure 86: Eastern Europe Market Value Share (%) and BPS Analysis by End-Use, 2024 to 2034

Figure 87: Eastern Europe Market Y-o-Y Growth (%) Projections by End-Use, 2024 to 2034

Figure 88: Eastern Europe Market Attractiveness by Product Type, 2024 to 2034

Figure 89: Eastern Europe Market Attractiveness by End-Use, 2024 to 2034

Figure 90: Eastern Europe Market Attractiveness by Country, 2024 to 2034

Figure 91: South Asia and Pacific Market Value (US$ Million) by Product Type, 2024 to 2034

Figure 92: South Asia and Pacific Market Value (US$ Million) by End-Use, 2024 to 2034

Figure 93: South Asia and Pacific Market Value (US$ Million) by Country, 2024 to 2034

Figure 94: South Asia and Pacific Market Value (US$ Million) Analysis by Country, 2019 to 2034

Figure 95: South Asia and Pacific Market Volume (Units) Analysis by Country, 2019 to 2034

Figure 96: South Asia and Pacific Market Value Share (%) and BPS Analysis by Country, 2024 to 2034

Figure 97: South Asia and Pacific Market Y-o-Y Growth (%) Projections by Country, 2024 to 2034

Figure 98: South Asia and Pacific Market Value (US$ Million) Analysis by Product Type, 2019 to 2034

Figure 99: South Asia and Pacific Market Volume (Units) Analysis by Product Type, 2019 to 2034

Figure 100: South Asia and Pacific Market Value Share (%) and BPS Analysis by Product Type, 2024 to 2034

Figure 101: South Asia and Pacific Market Y-o-Y Growth (%) Projections by Product Type, 2024 to 2034

Figure 102: South Asia and Pacific Market Value (US$ Million) Analysis by End-Use, 2019 to 2034

Figure 103: South Asia and Pacific Market Volume (Units) Analysis by End-Use, 2019 to 2034

Figure 104: South Asia and Pacific Market Value Share (%) and BPS Analysis by End-Use, 2024 to 2034

Figure 105: South Asia and Pacific Market Y-o-Y Growth (%) Projections by End-Use, 2024 to 2034

Figure 106: South Asia and Pacific Market Attractiveness by Product Type, 2024 to 2034

Figure 107: South Asia and Pacific Market Attractiveness by End-Use, 2024 to 2034

Figure 108: South Asia and Pacific Market Attractiveness by Country, 2024 to 2034

Figure 109: East Asia Market Value (US$ Million) by Product Type, 2024 to 2034

Figure 110: East Asia Market Value (US$ Million) by End-Use, 2024 to 2034

Figure 111: East Asia Market Value (US$ Million) by Country, 2024 to 2034

Figure 112: East Asia Market Value (US$ Million) Analysis by Country, 2019 to 2034

Figure 113: East Asia Market Volume (Units) Analysis by Country, 2019 to 2034

Figure 114: East Asia Market Value Share (%) and BPS Analysis by Country, 2024 to 2034

Figure 115: East Asia Market Y-o-Y Growth (%) Projections by Country, 2024 to 2034

Figure 116: East Asia Market Value (US$ Million) Analysis by Product Type, 2019 to 2034

Figure 117: East Asia Market Volume (Units) Analysis by Product Type, 2019 to 2034

Figure 118: East Asia Market Value Share (%) and BPS Analysis by Product Type, 2024 to 2034

Figure 119: East Asia Market Y-o-Y Growth (%) Projections by Product Type, 2024 to 2034

Figure 120: East Asia Market Value (US$ Million) Analysis by End-Use, 2019 to 2034

Figure 121: East Asia Market Volume (Units) Analysis by End-Use, 2019 to 2034

Figure 122: East Asia Market Value Share (%) and BPS Analysis by End-Use, 2024 to 2034

Figure 123: East Asia Market Y-o-Y Growth (%) Projections by End-Use, 2024 to 2034

Figure 124: East Asia Market Attractiveness by Product Type, 2024 to 2034

Figure 125: East Asia Market Attractiveness by End-Use, 2024 to 2034

Figure 126: East Asia Market Attractiveness by Country, 2024 to 2034

Figure 127: Middle East and Africa Market Value (US$ Million) by Product Type, 2024 to 2034

Figure 128: Middle East and Africa Market Value (US$ Million) by End-Use, 2024 to 2034

Figure 129: Middle East and Africa Market Value (US$ Million) by Country, 2024 to 2034

Figure 130: Middle East and Africa Market Value (US$ Million) Analysis by Country, 2019 to 2034

Figure 131: Middle East and Africa Market Volume (Units) Analysis by Country, 2019 to 2034

Figure 132: Middle East and Africa Market Value Share (%) and BPS Analysis by Country, 2024 to 2034

Figure 133: Middle East and Africa Market Y-o-Y Growth (%) Projections by Country, 2024 to 2034

Figure 134: Middle East and Africa Market Value (US$ Million) Analysis by Product Type, 2019 to 2034

Figure 135: Middle East and Africa Market Volume (Units) Analysis by Product Type, 2019 to 2034

Figure 136: Middle East and Africa Market Value Share (%) and BPS Analysis by Product Type, 2024 to 2034

Figure 137: Middle East and Africa Market Y-o-Y Growth (%) Projections by Product Type, 2024 to 2034

Figure 138: Middle East and Africa Market Value (US$ Million) Analysis by End-Use, 2019 to 2034

Figure 139: Middle East and Africa Market Volume (Units) Analysis by End-Use, 2019 to 2034

Figure 140: Middle East and Africa Market Value Share (%) and BPS Analysis by End-Use, 2024 to 2034

Figure 141: Middle East and Africa Market Y-o-Y Growth (%) Projections by End-Use, 2024 to 2034

Figure 142: Middle East and Africa Market Attractiveness by Product Type, 2024 to 2034

Figure 143: Middle East and Africa Market Attractiveness by End-Use, 2024 to 2034

Figure 144: Middle East and Africa Market Attractiveness by Country, 2024 to 2034

Recommendations

Technology

Digital Signage System Market

Published : October 2023

Packaging

ESD Protective Signage Labels Market

Published : September 2022

Explore Packaging Insights

View Reports