Reports

- Global Locations -

Headquarters

Future Market Insights, Inc.

Christiana Corporate, 200
Continental Drive, Suite 401,
Newark, Delaware - 19713,
United States

T: +1-845-579-5705

Americas

Future Market Insights, Inc.

616 Corporate Way, Suite 2-9018,
Valley Cottage, NY 10989, United States

T: +1-347-918-3531

MEA

Future Market Insights

1602-6 Jumeirah Bay X2 Tower, Plot No: JLT-PH2-X2A,
Jumeirah Lakes Towers, Dubai,
United Arab Emirates

Europe

Future Market Insights

3rd Floor, 207 Regent Street,
W1B 3HH London
United Kingdom

T: + 44 (0) 20 8123 9659
D: +44 (0) 20 3287 4268

Asia Pacific

Future Market Insights

IndiaLand Global Tech Park, Unit UG-1, Behind Grand HighStreet, Phase 1, Hinjawadi, MH, Pune – 411057, India

Mobile Speech Recognition Software Market Outlook (2022 to 2032)

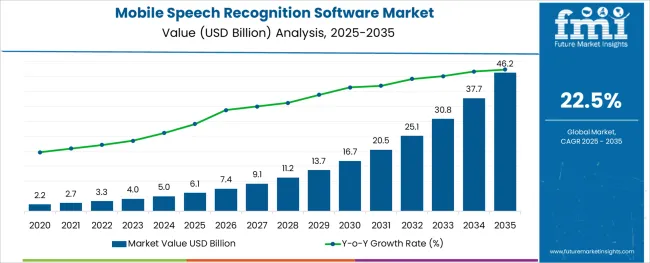
The mobile speech recognition software market share is recorded to rise to the valuation of US$ 3.3 Billion in 2022 and is estimated to reach US$ 25.4 Billion by 2032 with a CAGR of 22.5% during the forecast period from 2022 to 2032.

Report Attribute Details
Mobile Speech Recognition Software Market Value (2022) US$ 3.3 Billion
Mobile Speech Recognition Software Market Anticipated Forecast Value (2032) US$ 25.4 Billion
Mobile Speech Recognition Software Market Projected Growth Rate (2022 to 2032) 22.5%

The increasing adoption of conversational user interface (CUI) as a more prolific way to communicate among mobile devices like smartphones and tablets is generating the demand for mobile speech recognition software in the market by consumers and various industries.

The proliferation of smartphones with advanced features and the development of voice-based applications is penetrating the demand for mobile speech recognition software technologies in a positive way which is anticipated to rise the mobile speech recognition software market share during the forecast period.

Additionally, several advancements in the development of cutting-edge algorithms and the processing power of new-age smartphones will help in offering efficient speech recognition. Therefore, the adoption of mobile speech recognition software is likely to boost in the coming year.

The sales of mobile speech recognition software are supposed to rise due to its natural, multilingual technologies. The mobile speech recognition software market statistics are likely to boost as they satisfy customers' needs and save time through the system's best quality of speech recognition.

It is real-time speech recognition that helps to spell the word correctly & helps one with the problem with both sight and speech; it is estimated to generate huge sales of the mobile speech recognition software during the forecast period from 2022 to 2032.

Mobile speech recognition software biometrics are generally used in the security that helps a device perform a transaction. This is expected to drive the mobile speech recognition software market growth in the coming forecast period.

The hardware and software segments are likely to boost with an increase in demand for mobile speech recognition software in the forthcoming year. The system is anticipated to gain huge popularity in the market due to the widespread use of mobile phones.

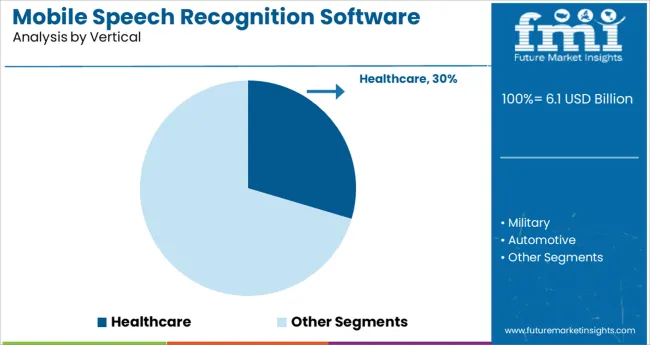
The mobile speech recognition software market is likely to be used in various end-user industries, including Healthcare, Military, Automotive, Retail, Government, Education, BFSI & Others. All these factors are raising the adoption of mobile speech recognition software in the coming forecast period from 2022 to 2032.

Don't pay for what you don't need

Customize your report by selecting specific countries or regions and save 30%!

What are Some of the Factors Spearheading the Mobile Speech Recognition Software Market?

The crucial requirement of biometric authentication in mobile banking is leading to the intensified integration of speech authentication, thus driving the mobile speech recognition software market trends.

Rising awareness of the multi-functionality of mobile devices in speech recognition technologies is also turning up as another important factor driving the mobile speech recognition software market growth positively.

Lack of accuracy in a noisy working environment is an important restraint faced by most of the vendors in the mobile speech recognition software market size.
What is the Growth Outlook for the North America Mobile Speech Recognition Software Market?

Based on geography, mobile speech recognition software market analysis can be segmented into seven key regions, namely North America, Latin America, Western Europe, Eastern Europe, Asia Pacific excluding Japan, Japan, and Middle East & Africa.

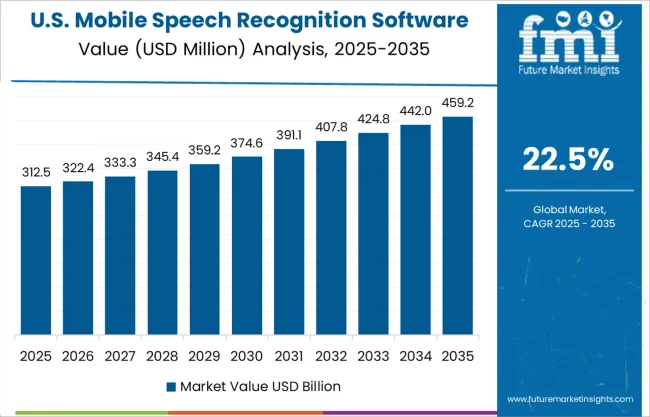
Among various regions, the mobile speech recognition software market size, North America is expected to dominate the market during the forecast period i.e., 2022 to 2032.

The region is anticipated to acquire 30.7% of the global mobile speech recognition software market share, as per the mobile speech recognition software market statistics all around the globe.
Sudip Saha
Sudip Saha

Principal Consultant

Talk to Analyst

Find your sweet spots for generating winning opportunities in this market.

How is the Performance of Europe Mobile Speech Recognition Software Market?

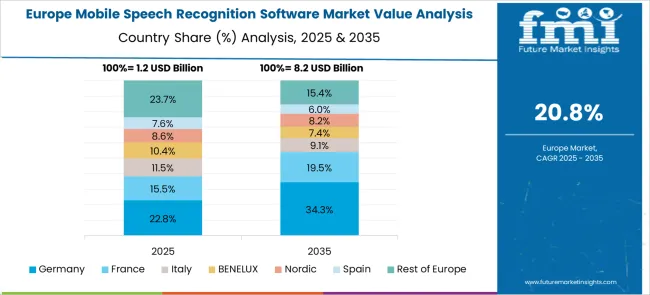
After North America, the Europe region is anticipated to boosting in the mobile speech recognition software market opportunities by acquiring 22.6% of the total share in the mobile speech recognition software market trends & forecasts in the forecast period.

Due to the growing trend of connected devices in automotive and home automation, speech res, and retail sectors in Europe. cognition technologies are anticipated to see more applications in the consumer electronic

Therefore, the adoption of mobile speech recognition software is growing higher in the marketplace.

How is the Start-up Ecosystem in the Mobile Speech Recognition Software Market?

  • The United Kingdom-based startup AudioTelligence creates audio source separation technologies for devices to recognize speech commands.

Low latency algorithms eliminate distracting car noises like traffic noises, radio, and passenger conversations to recognize speech and improve the effectiveness of voice-controlled devices.

  • A Canadian startup called Picovoice creates speech recognition software that enables hands-free camera operation.

Devices that include a speech interface also let users control camera settings verbally. The startup's software works on both iOS and Android devices.

  • The Canadian startup Meetscribe uses speech recognition technology to capture meeting notes in real-time using the MeetScribe API.

While the interface recognizes multiple participants and uses sentiment analysis to help understand the meeting's overall tone, the API generates summaries and keywords to keep notes organized.
Get the data you need at a Fraction of the cost

Personalize your report by choosing insights you need
and save 40%!

Who are Some of the Key Competitors in the Mobile Speech Recognition Software Market?

Several key competitor companies are likely to grow and produce more revenue in the mobile speech recognition software market statistics in recent years. They are focused on their plans, policies, and methodologies

They adopt several boosting revenue policies including partnerships, mergers, and acquisitions to lift the mobile speech recognition software market growth during the forecast period from 2022 to 2032.

Some of the dynamic key competitor companies who are always on the front door to keep boosting the mobile speech recognition software market key trends & opportunities are mentioned below.

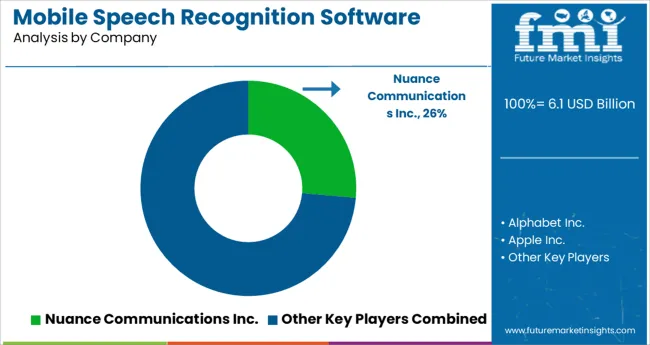
The major player operating in the mobile speech recognition software market includes Nuance Communications Inc., Alphabet Inc., Apple Inc., Baidu Inc., Amazon Inc., Microsoft Corporation, VoiceBox Technologies Corporation, LumenVox, LLC., Pareteum Corporation, Sensory, Inc. ReadSpeaker Holding B.V., and VoiceVault Inc. among others.

These industries are contributing a huge role in th adoption of mobile speech recognition software all around the regions during the forecast period from 2022 to 2032.

Recent Development in Mobile Speech Recognition Software Market are

In October 2016, VoiceVault Inc. partnered with BioConnect based in the USA to develop and integrate biometric authentication into finance platforms and digital banking. The main objective of this partnership was to enable the integration of VoiceVault Inc.'s existing voice recognition software with the BioConnect mobile platform to offer biometric authentication solutions with eye scanning technology and voice.

Report Scope

Report Attribute Details
Growth Rate CAGR of 22.5% from 2022 to 2032
Base Year for Estimation 2021
Historical Data 2016 to 2021
Forecast Period 2022 to 2032
Quantitative Units Revenue in USD Million and CAGR from 2022 to 2032
Report Coverage Revenue Forecast, Volume Forecast, Company Ranking, Competitive Landscape, Growth Factors, Trends, and Pricing Analysis
Segments Covered
  • Vertical
  • Region
Regions Covered
  • North America
  • Latin America
  • Europe
  • East Asia
  • South Asia
  • Oceania
  • Middle East and Africa
Key Countries Profiled
  • USA
  • Canada
  • Brazil
  • Argentina
  • Germany
  • United Kingdom
  • France
  • Spain
  • Italy
  • Nordics
  • BENELUX
  • Australia & New Zealand
  • China
  • India
  • ASIAN
  • GCC Countries
  • South Africa
Key Companies Profiled
  • Nuance Communications Inc
  • Alphabet Inc
  • Apple Inc
  • Baidu Inc
  • Amazon Inc
  • Microsoft Corporation
  • VoiceBox Technologies Corporation
  • LumenVox, LLC
  • Pareteum Corporation, Sensory
  • ReadSpeaker Holding B.V.
  • VoiceVault Inc.
Customization Available Upon Request

Key Segments

By Vertical:

  • Healthcare
  • Military
  • Automotive
  • Retail
  • Government
  • Education
  • BFSI
  • Others

By Region:

  • North America
  • Latin America
  • Asia Pacific
  • Middle East and Africa
  • Europe

Frequently Asked Questions

What is the Growth Outlook for the Mobile Speech Recognition Software Market?

The mobile speech recognition software market is likely to advance at a CAGR of 22.5% through 2032.

Which Region Holds a Major Mobile Speech Recognition Software Market Share?

The North American region is set to hold a mobile speech recognition software market share of 30.7% by 2032.

What is the Future of the Mobile Speech Recognition Software Market?

The mobile speech recognition software market is expected to account for US$ 25.4 Billion by 2032.

Table of Content

1. Executive Summary | Mobile Speech Recognition Software Market

    1.1. Global Market Outlook

    1.2. Demand-side Trends

    1.3. Supply-side Trends

    1.4. Technology Roadmap Analysis

    1.5. Analysis and Recommendations

2. Market Overview

    2.1. Market Coverage / Taxonomy

    2.2. Market Definition / Scope / Limitations

3. Market Background

    3.1. Market Dynamics

        3.1.1. Drivers

        3.1.2. Restraints

        3.1.3. Opportunity

        3.1.4. Trends

    3.2. Scenario Forecast

        3.2.1. Demand in Optimistic Scenario

        3.2.2. Demand in Likely Scenario

        3.2.3. Demand in Conservative Scenario

    3.3. Opportunity Map Analysis

    3.4. Product Life Cycle Analysis

    3.5. Investment Feasibility Matrix

    3.6. PESTLE and Porter’s Analysis

    3.7. Regulatory Landscape

        3.7.1. By Key Regions

        3.7.2. By Key Countries

    3.8. Regional Parent Market Outlook

4. Global Market Analysis 2017 to 2021 and Forecast, 2022 to 2032

    4.1. Historical Market Size Value (US$ Million) Analysis, 2017 to 2021

    4.2. Current and Future Market Size Value (US$ Million) Projections, 2022 to 2032

        4.2.1. Y-o-Y Growth Trend Analysis

        4.2.2. Absolute $ Opportunity Analysis

5. Global Market Analysis 2017 to 2021 and Forecast 2022 to 2032, By Vertical

    5.1. Introduction / Key Findings

    5.2. Historical Market Size Value (US$ Million) Analysis By Vertical, 2017 to 2021

    5.3. Current and Future Market Size Value (US$ Million) Analysis and Forecast By Vertical, 2022 to 2032

        5.3.1. Healthcare

        5.3.2. Military

        5.3.3. Automotive

        5.3.4. Retail

        5.3.5. Government

        5.3.6. Education

        5.3.7. BFSI

        5.3.8. Others

    5.4. Y-o-Y Growth Trend Analysis By Vertical, 2017 to 2021

    5.5. Absolute $ Opportunity Analysis By Vertical, 2022 to 2032

6. Global Market Analysis 2017 to 2021 and Forecast 2022 to 2032, By Region

    6.1. Introduction

    6.2. Historical Market Size Value (US$ Million) Analysis By Region, 2017 to 2021

    6.3. Current Market Size Value (US$ Million) Analysis and Forecast By Region, 2022 to 2032

        6.3.1. North America

        6.3.2. Latin America

        6.3.3. Europe

        6.3.4. Asia Pacific

        6.3.5. Middle East and Africa

    6.4. Market Attractiveness Analysis By Region

7. North America Market Analysis 2017 to 2021 and Forecast 2022 to 2032, By Country

    7.1. Historical Market Size Value (US$ Million) Trend Analysis By Market Taxonomy, 2017 to 2021

    7.2. Market Size Value (US$ Million) Forecast By Market Taxonomy, 2022 to 2032

        7.2.1. By Country

            7.2.1.1. US

            7.2.1.2. Canada

        7.2.2. By Vertical

    7.3. Market Attractiveness Analysis

        7.3.1. By Country

        7.3.2. By Vertical

    7.4. Key Takeaways

8. Latin America Market Analysis 2017 to 2021 and Forecast 2022 to 2032, By Country

    8.1. Historical Market Size Value (US$ Million) Trend Analysis By Market Taxonomy, 2017 to 2021

    8.2. Market Size Value (US$ Million) Forecast By Market Taxonomy, 2022 to 2032

        8.2.1. By Country

            8.2.1.1. Brazil

            8.2.1.2. Mexico

            8.2.1.3. Rest of Latin America

        8.2.2. By Vertical

    8.3. Market Attractiveness Analysis

        8.3.1. By Country

        8.3.2. By Vertical

    8.4. Key Takeaways

9. Europe Market Analysis 2017 to 2021 and Forecast 2022 to 2032, By Country

    9.1. Historical Market Size Value (US$ Million) Trend Analysis By Market Taxonomy, 2017 to 2021

    9.2. Market Size Value (US$ Million) Forecast By Market Taxonomy, 2022 to 2032

        9.2.1. By Country

            9.2.1.1. Germany

            9.2.1.2.United Kingdom

            9.2.1.3. France

            9.2.1.4. Spain

            9.2.1.5. Italy

            9.2.1.6. Russia

            9.2.1.7. Rest of Europe

        9.2.2. By Vertical

    9.3. Market Attractiveness Analysis

        9.3.1. By Country

        9.3.2. By Vertical

    9.4. Key Takeaways

10. Asia Pacific Market Analysis 2017 to 2021 and Forecast 2022 to 2032, By Country

    10.1. Historical Market Size Value (US$ Million) Trend Analysis By Market Taxonomy, 2017 to 2021

    10.2. Market Size Value (US$ Million) Forecast By Market Taxonomy, 2022 to 2032

        10.2.1. By Country

            10.2.1.1. China

            10.2.1.2. Japan

            10.2.1.3. India

            10.2.1.4. South Korea

            10.2.1.5. Australia

            10.2.1.6. Rest of Asia Pacific

        10.2.2. By Vertical

    10.3. Market Attractiveness Analysis

        10.3.1. By Country

        10.3.2. By Vertical

    10.4. Key Takeaways

11. Middle East and Africa Market Analysis 2017 to 2021 and Forecast 2022 to 2032, By Country

    11.1. Historical Market Size Value (US$ Million) Trend Analysis By Market Taxonomy, 2017 to 2021

    11.2. Market Size Value (US$ Million) Forecast By Market Taxonomy, 2022 to 2032

        11.2.1. By Country

            11.2.1.1. South Africa

            11.2.1.2. Saudi Arabia

            11.2.1.3. United Arab Emirates

            11.2.1.4. Israel

            11.2.1.5. Rest of Middle East and Africa

        11.2.2. By Vertical

    11.3. Market Attractiveness Analysis

        11.3.1. By Country

        11.3.2. By Vertical

    11.4. Key Takeaways

12. Key Countries Market Analysis

    12.1. US

        12.1.1. Pricing Analysis

        12.1.2. Market Share Analysis, 2021

            12.1.2.1. By Vertical

    12.2. Canada

        12.2.1. Pricing Analysis

        12.2.2. Market Share Analysis, 2021

            12.2.2.1. By Vertical

    12.3. Brazil

        12.3.1. Pricing Analysis

        12.3.2. Market Share Analysis, 2021

            12.3.2.1. By Vertical

    12.4. Mexico

        12.4.1. Pricing Analysis

        12.4.2. Market Share Analysis, 2021

            12.4.2.1. By Vertical

    12.5. Germany

        12.5.1. Pricing Analysis

        12.5.2. Market Share Analysis, 2021

            12.5.2.1. By Vertical

    12.6.United Kingdom

        12.6.1. Pricing Analysis

        12.6.2. Market Share Analysis, 2021

            12.6.2.1. By Vertical

    12.7. France

        12.7.1. Pricing Analysis

        12.7.2. Market Share Analysis, 2021

            12.7.2.1. By Vertical

    12.8. Spain

        12.8.1. Pricing Analysis

        12.8.2. Market Share Analysis, 2021

            12.8.2.1. By Vertical

    12.9. Italy

        12.9.1. Pricing Analysis

        12.9.2. Market Share Analysis, 2021

            12.9.2.1. By Vertical

    12.10. Russia

        12.10.1. Pricing Analysis

        12.10.2. Market Share Analysis, 2021

            12.10.2.1. By Vertical

    12.11. China

        12.11.1. Pricing Analysis

        12.11.2. Market Share Analysis, 2021

            12.11.2.1. By Vertical

    12.12. Japan

        12.12.1. Pricing Analysis

        12.12.2. Market Share Analysis, 2021

            12.12.2.1. By Vertical

    12.13. India

        12.13.1. Pricing Analysis

        12.13.2. Market Share Analysis, 2021

            12.13.2.1. By Vertical

    12.14. South Korea

        12.14.1. Pricing Analysis

        12.14.2. Market Share Analysis, 2021

            12.14.2.1. By Vertical

    12.15. Australia

        12.15.1. Pricing Analysis

        12.15.2. Market Share Analysis, 2021

            12.15.2.1. By Vertical

    12.16. South Africa

        12.16.1. Pricing Analysis

        12.16.2. Market Share Analysis, 2021

            12.16.2.1. By Vertical

    12.17. Saudi Arabia

        12.17.1. Pricing Analysis

        12.17.2. Market Share Analysis, 2021

            12.17.2.1. By Vertical

    12.18. United Arab Emirates

        12.18.1. Pricing Analysis

        12.18.2. Market Share Analysis, 2021

            12.18.2.1. By Vertical

    12.19. Israel

        12.19.1. Pricing Analysis

        12.19.2. Market Share Analysis, 2021

            12.19.2.1. By Vertical

13. Market Structure Analysis

    13.1. Competition Dashboard

    13.2. Competition Benchmarking

    13.3. Market Share Analysis of Top Players

        13.3.1. By Regional

        13.3.2. By Vertical

14. Competition Analysis

    14.1. Competition Deep Dive

        14.1.1. Nuance Communications Inc.

            14.1.1.1. Overview

            14.1.1.2. Product Portfolio

            14.1.1.3. Profitability by Market Segments

            14.1.1.4. Sales Footprint

            14.1.1.5. Strategy Overview

                14.1.1.5.1. Marketing Strategy

        14.1.2. Alphabet Inc.

            14.1.2.1. Overview

            14.1.2.2. Product Portfolio

            14.1.2.3. Profitability by Market Segments

            14.1.2.4. Sales Footprint

            14.1.2.5. Strategy Overview

                14.1.2.5.1. Marketing Strategy

        14.1.3. Apple Inc.

            14.1.3.1. Overview

            14.1.3.2. Product Portfolio

            14.1.3.3. Profitability by Market Segments

            14.1.3.4. Sales Footprint

            14.1.3.5. Strategy Overview

                14.1.3.5.1. Marketing Strategy

        14.1.4. Baidu Inc.

            14.1.4.1. Overview

            14.1.4.2. Product Portfolio

            14.1.4.3. Profitability by Market Segments

            14.1.4.4. Sales Footprint

            14.1.4.5. Strategy Overview

                14.1.4.5.1. Marketing Strategy

        14.1.5. Amazon Inc.

            14.1.5.1. Overview

            14.1.5.2. Product Portfolio

            14.1.5.3. Profitability by Market Segments

            14.1.5.4. Sales Footprint

            14.1.5.5. Strategy Overview

                14.1.5.5.1. Marketing Strategy

        14.1.6. Microsoft Corporation

            14.1.6.1. Overview

            14.1.6.2. Product Portfolio

            14.1.6.3. Profitability by Market Segments

            14.1.6.4. Sales Footprint

            14.1.6.5. Strategy Overview

                14.1.6.5.1. Marketing Strategy

        14.1.7. LumenVox

            14.1.7.1. Overview

            14.1.7.2. Product Portfolio

            14.1.7.3. Profitability by Market Segments

            14.1.7.4. Sales Footprint

            14.1.7.5. Strategy Overview

                14.1.7.5.1. Marketing Strategy

        14.1.8. Pareteum Corporation

            14.1.8.1. Overview

            14.1.8.2. Product Portfolio

            14.1.8.3. Profitability by Market Segments

            14.1.8.4. Sales Footprint

            14.1.8.5. Strategy Overview

                14.1.8.5.1. Marketing Strategy

        14.1.9. Sensory

            14.1.9.1. Overview

            14.1.9.2. Product Portfolio

            14.1.9.3. Profitability by Market Segments

            14.1.9.4. Sales Footprint

            14.1.9.5. Strategy Overview

                14.1.9.5.1. Marketing Strategy

        14.1.10. ReadSpeaker Holding B.V.

            14.1.10.1. Overview

            14.1.10.2. Product Portfolio

            14.1.10.3. Profitability by Market Segments

            14.1.10.4. Sales Footprint

            14.1.10.5. Strategy Overview

                14.1.10.5.1. Marketing Strategy

15. Assumptions & Acronyms Used

16. Research Methodology

List of Tables

Table 1: Global Market Value (US$ Million) Forecast by Region, 2017 to 2032

Table 2: Global Market Value (US Million) Forecast By Vertical, 2017 to 2032

Table 3: North America Market Value (US$ Million) Forecast by Country, 2017 to 2032

Table 4: North America Market Value (US$ Million) Forecast By Vertical, 2017 to 2032

Table 5: Latin America Market Value (US$ Million) Forecast by Country, 2017 to 2032

Table 6: Latin America Market Value (US$ Million) Forecast By Vertical, 2017 to 2032

Table 7: Europe Market Value (US$ Million) Forecast by Country, 2017 to 2032

Table 8: Europe Market Value (US$ Million) Forecast By Vertical, 2017 to 2032

Table 9: Asia Pacific Market Value (US$ Million) Forecast by Country, 2017 to 2032

Table 10: Asia Pacific Market Value (US$ Million) Forecast By Vertical, 2017 to 2032

Table 11: Middle East and Africa Market Value (US$ Million) Forecast by Country, 2017 to 2032

Table 12: Middle East and Africa Market Value (US$ Million) Forecast By Vertical, 2017 to 2032

List of Charts

Figure 1: Global Market Value (US$ Million) By Vertical, 2022 to 2032

Figure 2: Global Market Value (US$ Million) by Region, 2022 to 2032

Figure 3: Global Market Value (US$ Million) Analysis by Region, 2017 to 2032

Figure 4: Global Market Value Share (%) and BPS Analysis by Region, 2022 to 2032

Figure 5: Global Market Y-o-Y Growth (%) Projections by Region, 2022 to 2032

Figure 6: Global Market Value (US$ Million) Analysis By Vertical, 2017 to 2032

Figure 7: Global Market Value Share (%) and BPS Analysis By Vertical, 2022 to 2032

Figure 8: Global Market Y-o-Y Growth (%) Projections By Vertical, 2022 to 2032

Figure 9: Global Market Attractiveness By Vertical, 2022 to 2032

Figure 10: Global Market Attractiveness by Region, 2022 to 2032

Figure 11: North America Market Value (US$ Million) By Vertical, 2022 to 2032

Figure 12: North America Market Value (US$ Million) by Country, 2022 to 2032

Figure 13: North America Market Value (US$ Million) Analysis by Country, 2017 to 2032

Figure 14: North America Market Value Share (%) and BPS Analysis by Country, 2022 to 2032

Figure 15: North America Market Y-o-Y Growth (%) Projections by Country, 2022 to 2032

Figure 16: North America Market Value (US$ Million) Analysis By Vertical, 2017 to 2032

Figure 17: North America Market Value Share (%) and BPS Analysis By Vertical, 2022 to 2032

Figure 18: North America Market Y-o-Y Growth (%) Projections By Vertical, 2022 to 2032

Figure 19: North America Market Attractiveness By Vertical, 2022 to 2032

Figure 20: North America Market Attractiveness by Country, 2022 to 2032

Figure 21: Latin America Market Value (US$ Million) By Vertical, 2022 to 2032

Figure 22: Latin America Market Value (US$ Million) by Country, 2022 to 2032

Figure 23: Latin America Market Value (US$ Million) Analysis by Country, 2017 to 2032

Figure 24: Latin America Market Value Share (%) and BPS Analysis by Country, 2022 to 2032

Figure 25: Latin America Market Y-o-Y Growth (%) Projections by Country, 2022 to 2032

Figure 26: Latin America Market Value (US$ Million) Analysis By Vertical, 2017 to 2032

Figure 27: Latin America Market Value Share (%) and BPS Analysis By Vertical, 2022 to 2032

Figure 28: Latin America Market Y-o-Y Growth (%) Projections By Vertical, 2022 to 2032

Figure 29: Latin America Market Attractiveness By Vertical, 2022 to 2032

Figure 30: Latin America Market Attractiveness by Country, 2022 to 2032

Figure 31: Europe Market Value (US$ Million) By Vertical, 2022 to 2032

Figure 32: Europe Market Value (US$ Million) by Country, 2022 to 2032

Figure 33: Europe Market Value (US$ Million) Analysis by Country, 2017 to 2032

Figure 34: Europe Market Value Share (%) and BPS Analysis by Country, 2022 to 2032

Figure 35: Europe Market Y-o-Y Growth (%) Projections by Country, 2022 to 2032

Figure 36: Europe Market Value (US$ Million) Analysis By Vertical, 2017 to 2032

Figure 37: Europe Market Value Share (%) and BPS Analysis By Vertical, 2022 to 2032

Figure 38: Europe Market Y-o-Y Growth (%) Projections By Vertical, 2022 to 2032

Figure 39: Europe Market Attractiveness By Vertical, 2022 to 2032

Figure 40: Europe Market Attractiveness by Country, 2022 to 2032

Figure 41: Asia Pacific Market Value (US$ Million) By Vertical, 2022 to 2032

Figure 42: Asia Pacific Market Value (US$ Million) by Country, 2022 to 2032

Figure 43: Asia Pacific Market Value (US$ Million) Analysis by Country, 2017 to 2032

Figure 44: Asia Pacific Market Value Share (%) and BPS Analysis by Country, 2022 to 2032

Figure 45: Asia Pacific Market Y-o-Y Growth (%) Projections by Country, 2022 to 2032

Figure 46: Asia Pacific Market Value (US$ Million) Analysis By Vertical, 2017 to 2032

Figure 47: Asia Pacific Market Value Share (%) and BPS Analysis By Vertical, 2022 to 2032

Figure 48: Asia Pacific Market Y-o-Y Growth (%) Projections By Vertical, 2022 to 2032

Figure 49: Asia Pacific Market Attractiveness By Vertical, 2022 to 2032

Figure 50: Asia Pacific Market Attractiveness by Country, 2022 to 2032

Figure 51: Middle East and Africa Market Value (US$ Million) By Vertical, 2022 to 2032

Figure 52: Middle East and Africa Market Value (US$ Million) by Country, 2022 to 2032

Figure 53: Middle East and Africa Market Value (US$ Million) Analysis by Country, 2017 to 2032

Figure 54: Middle East and Africa Market Value Share (%) and BPS Analysis by Country, 2022 to 2032

Figure 55: Middle East and Africa Market Y-o-Y Growth (%) Projections by Country, 2022 to 2032

Figure 56: Middle East and Africa Market Value (US$ Million) Analysis By Vertical, 2017 to 2032

Figure 57: Middle East and Africa Market Value Share (%) and BPS Analysis By Vertical, 2022 to 2032

Figure 58: Middle East and Africa Market Y-o-Y Growth (%) Projections By Vertical, 2022 to 2032

Figure 59: Middle East and Africa Market Attractiveness By Vertical, 2022 to 2032

Figure 60: Middle East and Africa Market Attractiveness by Country, 2022 to 2032

Recommendations

Technology

Speech and Voice Analytics Market

Published : June 2022

Explore Technology Insights

View Reports

Mobile Speech Recognition Software Market