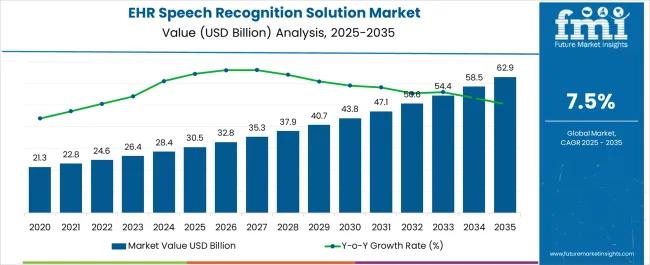
The EHR Speech Recognition Solution Market is estimated to be valued at USD 30.5 billion in 2025 and is projected to reach USD 62.9 billion by 2035, registering a compound annual growth rate (CAGR) of 7.5% over the forecast period.
| Metric | Value |
|---|---|
| EHR Speech Recognition Solution Market Estimated Value in (2025 E) | USD 30.5 billion |
| EHR Speech Recognition Solution Market Forecast Value in (2035 F) | USD 62.9 billion |
| Forecast CAGR (2025 to 2035) | 7.5% |
The EHR speech recognition solution market is experiencing sustained expansion, propelled by the rising need for streamlined clinical documentation and efficiency in healthcare delivery. Industry publications and company press releases have highlighted the growing integration of speech recognition technologies with electronic health records, reducing physician burnout and improving patient care quality. Hospitals and clinics are increasingly prioritizing solutions that enhance accuracy, minimize transcription errors, and support real-time data entry.
Strategic collaborations between technology providers and healthcare organizations have further accelerated product innovation, particularly in natural language processing and AI-driven dictation capabilities. Regulatory initiatives promoting interoperability and digital health adoption have also fueled demand. Moreover, healthcare providers are adopting speech recognition systems to improve workflow efficiency in acute and inpatient settings where rapid documentation is essential.
Looking forward, the market is expected to benefit from continuous advancements in cloud-based deployment, voice-enabled clinical decision support tools, and increasing emphasis on patient data security. Segmental momentum is anticipated to be driven by Integrated Solutions, On-Premises deployments, and Public Sector (Acute/Inpatient) users.
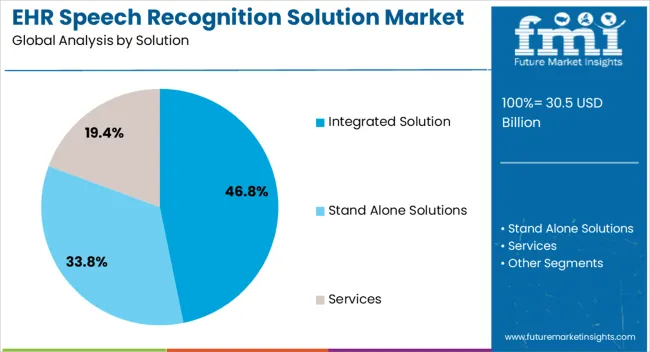
The Integrated Solution segment is projected to contribute 46.8% of the EHR speech recognition solution market revenue in 2025, maintaining its lead as the preferred deployment model. Growth in this segment has been supported by the ability of integrated solutions to seamlessly merge with existing EHR platforms, reducing workflow interruptions for clinicians. Healthcare organizations have favored integrated systems due to their capacity to deliver real-time documentation directly within patient records, minimizing the reliance on external transcription processes.
Reports from technology providers have emphasized that integrated solutions improve overall efficiency by reducing duplicate data entry and ensuring compliance with healthcare standards. Furthermore, hospitals and clinics have recognized the cost advantages of integrated deployments, where scalability and interoperability enhance long-term usability.
As demand for streamlined workflows and clinical efficiency intensifies, the Integrated Solution segment is expected to retain its dominance.
The On-Premises segment is projected to account for 58.4% of the EHR speech recognition solution market revenue in 2025, establishing itself as the leading architecture preference. Its dominance has been attributed to heightened concerns around patient data privacy and compliance with stringent healthcare regulations, which have driven providers to maintain local control over sensitive data. Healthcare facilities, particularly in regions with strong data protection laws, have favored on-premises solutions to ensure greater oversight and customizable security measures.
Annual reports and healthcare IT publications have noted that on-premises deployments allow organizations to optimize system performance with minimal reliance on external networks, ensuring consistent availability in critical care settings. Additionally, hospitals with existing IT infrastructure have leveraged on-premises systems for better integration and reduced latency.
Despite the growing appeal of cloud-based models, the need for secure, highly reliable, and locally managed deployments continues to reinforce the position of on-premises solutions as the leading architecture segment.
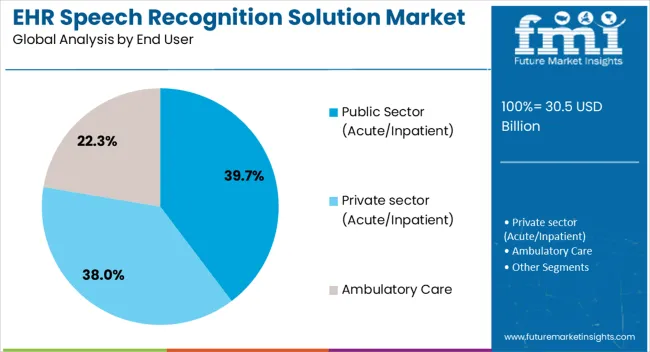
The Public Sector (Acute/Inpatient) segment is projected to hold 39.7% of the EHR speech recognition solution market revenue in 2025, retaining its role as the largest end-user group. Growth in this segment has been supported by the high patient volumes and complex documentation requirements in public healthcare facilities. Acute and inpatient care providers have relied heavily on speech recognition to enhance efficiency, reduce documentation time, and support accurate clinical reporting.
Health ministry publications and public healthcare system updates have emphasized significant investments in digitization initiatives, driving adoption across public hospitals and state-funded institutions. Additionally, budget allocations for improving healthcare IT infrastructure have prioritized speech recognition tools to ease clinician workloads and improve patient throughput.
The scalability of solutions in handling large data volumes and multi-specialty needs has also favored adoption in this segment. With ongoing government initiatives to strengthen public healthcare systems and enhance digital transformation, the Public Sector (Acute/Inpatient) segment is expected to sustain its market leadership.
The global market recorded a historic CAGR of 5.9% in the last 7 years from 2020 to 2025. Overall, EHR Speech Recognition Solution market sales account for 7.1% of revenue share in the global digital health market, which was valued at around USD 30.5.0 Billion in 2025.
The widespread adoption of EHR systems in healthcare organizations has created a need for efficient and accurate methods of data entry.
Speech recognition solutions offer a streamlined way for healthcare professionals to input patient information into EHRs, eliminating the need for manual typing and improving productivity.
EHR speech recognition solutions can contribute to cost savings and productivity gains in healthcare organizations. By automating the documentation process, clinicians can complete tasks more efficiently, leading to increased patient throughput and reduced administrative costs.
Speech recognition technology plays a crucial role in improving the efficiency of healthcare professionals by enabling them to document patient information quickly and accurately. with the advent of speech recognition solutions, healthcare professionals can now dictate their notes and have them transcribed instantly.
One of the key advantages of speech recognition technology is real-time documentation. Instead of relying on post-visit transcription services or spending additional time on manual data entry, healthcare professionals can record their observations, diagnoses, and treatment plans in real-time during patient encounters. This not only saves valuable time but also ensures that all relevant information is captured accurately and comprehensively.
Another benefit of speech recognition technology is its ability to integrate seamlessly with electronic health record (EHR) systems. Speech recognition solutions can directly interface with EHR platforms, allowing for the automatic transfer of transcribed notes.
Ultimately, advancements in technology not only improve healthcare professionals' productivity but also contribute to better patient outcomes and satisfaction.
The EHR speech recognition solution market is witnessing a surge in demand for integrated platforms that prioritize the protection of protected health information (PHI).
Healthcare analytics and patient management solutions are crucial components, ensuring data-driven decision-making and streamlined workflows while maintaining strict PHI confidentiality and compliance with data security regulations.
The EHR speech recognition market is experiencing significant growth driven by factors such as technological advancements, efficiency, accuracy, government initiatives, healthcare demand, integration, language processing, telemedicine, data security, and compliance.
This lucrative market offers opportunities for innovative solutions catering to healthcare providers' needs, as they seek to streamline workflows, enhance patient care, and navigate the evolving landscape of digital healthcare.
These factors continue to shape the EHR speech recognition solution market, driving innovation and adoption in the healthcare industry.
There is a significant opportunity for EHR speech recognition solutions to expand into developing regions where healthcare digitization is on the rise. As these regions adopt EHR systems, there is a growing need for efficient and accurate methods of data entry, making speech recognition solutions an attractive option.
Speech recognition solutions can be integrated with virtual assistants and chatbots to enhance patient interactions and improve the overall patient experience. This integration can enable patients to interact with EHRs using voice commands, access personalized health information, and receive real-time responses to their queries.
Speech recognition solutions can be leveraged to extract valuable insights and analytics from patient encounters. By analyzing spoken words and patterns, healthcare organizations can gain actionable information for clinical decision-making, quality improvement, and population health management.
The growth of telemedicine and remote healthcare services opens up opportunities for EHR speech recognition solutions. Collaboration between EHR speech recognition solution providers and EHR vendors or healthcare systems can lead to integrated and comprehensive solutions.
By partnering with established EHR providers, speech recognition solutions can seamlessly integrate into existing workflows, enhancing usability and interoperability.
These opportunities highlight the potential for growth, innovation, and market expansion within the EHR speech recognition solution market. By addressing these areas, vendors can cater to evolving customer needs, improve patient care, and drive adoption in the healthcare industry.
Implementing EHR speech recognition solutions can involve significant upfront costs. These costs may include software licenses, hardware requirements, training, and ongoing support and maintenance.
Smaller healthcare organizations or those with limited budgets may find it challenging to invest in such solutions.
Introducing a new technology like speech recognition into existing clinical workflows can disrupt established routines and processes. Healthcare professionals may initially experience reduced productivity as they adjust to the new system and learn how to effectively integrate speech recognition into their daily practice.
Resistance to change within healthcare organizations can be a significant restraint to the adoption of speech recognition solutions. Some healthcare professionals may be hesitant to embrace new technologies or feel uncomfortable with the shift from traditional documentation methods.
Addressing concerns, providing comprehensive training and support, and demonstrating the benefits of speech recognition is essential for successful adoption.
In certain healthcare settings, such as rural or remote areas, limited internet connectivity or outdated hardware may hinder the implementation and effective use of cloud-based or real-time speech recognition solutions. Adequate infrastructure and technology access are necessary to fully leverage the capabilities of these solutions.
Malware, particularly ransomware, poses a severe threat to EHRs. Ransomware can encrypt EHR data to restrict access, disrupting medical services and endangering patient safety while raising the possibility that the ransom will be paid.
Phishing efforts to acquire the login details required to access EHRs happen frequently as well. As a result, the aforementioned concerns could impede the expansion of the EHR industry in the years to come.
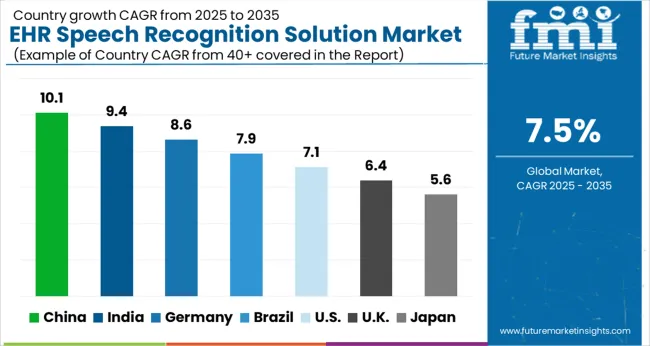
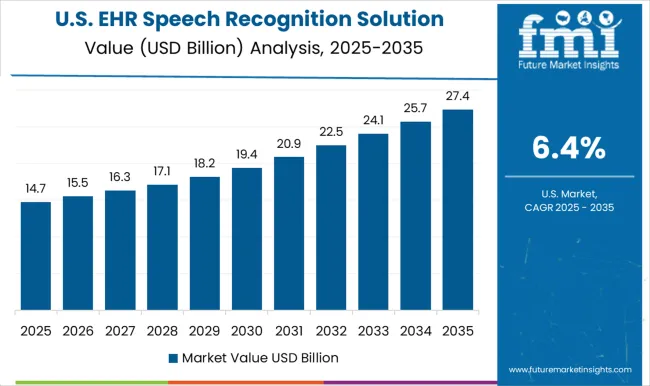
In the year 2025, the USA holds a dominant share in the North America contributing USD 7.2 Billion, and it is expected to grow at a CAGR of 8.4% during the forecasted years.
The USA has one of the prominent and most technologically advanced healthcare systems in the world. With a vast number of hospitals, clinics, and healthcare providers, there is a considerable market for EHR speech recognition solutions. The USA private healthcare sector has significant financial resources, allowing for investments in advanced technologies.
This financial capacity enables healthcare organizations to implement EHR speech recognition solutions more readily.
In 2025, China emerged as the dominant player in the East Asia market, contributing around USD 988.4 Million. The Chinese healthcare industry has seen a surge in the use of AI and big data analytics to improve patient care, optimize medical processes, and enhance clinical decision-making.
EHR speech recognition solutions can integrate with these technologies to enable more comprehensive data analysis. Increasing focus on digital healthcare, advancements in technology, government support, and the need for efficient and scalable solutions make the country a large and promising market for EHR speech recognition solutions.
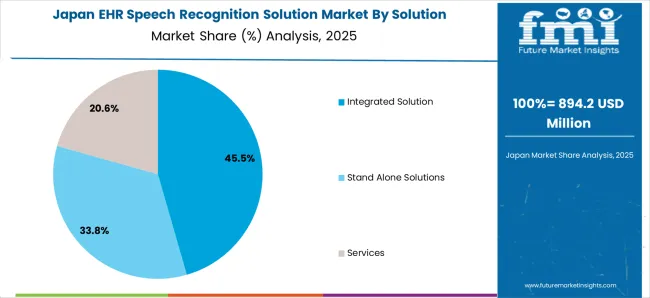
In 2025, Japan held a significant market share of around 4% globally. Japan is known for its advanced technological capabilities and innovations. The country's proficiency in developing and adopting cutting-edge technologies has contributed to the acceptance of EHR speech recognition solutions.
Japan's combination of technological prowess, aging population, government support, and a focus on healthcare efficiency makes it a highly lucrative market for EHR speech recognition solutions. Healthcare providers in Japan are increasingly recognizing the benefits of adopting speech recognition technology to enhance patient care and operational efficiency.
The integrated solution accounted for a significant market share of 40.0% in the global market in 2025. Integrated speech recognition solutions enable real-time documentation. As clinicians dictate patient information, it is transcribed and immediately available in the EHR, providing up-to-date and timely records.
Real-time documentation allows for better continuity of care, improves communication between healthcare providers, and supports timely decision-making. Integrated solutions are often preferred due to user adoption and familiarity with the EHR system. Healthcare professionals are already accustomed to using the EHR for various tasks, including patient documentation.
The cloud-based architecture accounted for a significant market share of 58.3% in the global market in 2025. Cloud-based architectures allow for easy scalability and flexibility. As healthcare organizations grow and their needs evolve, cloud-based solutions can scale up or down based on demand.
This scalability ensures that resources can be allocated efficiently, accommodating increased usage during peak times and reducing costs during periods of lower demand. Cloud-based architectures facilitate faster deployment of EHR speech recognition solutions.
Due to these advantages, cloud-based architectures have gained significant popularity in the EHR speech recognition solution market.
The private sector (acute/inpatient) plays a significant role in the global market, representing 37.5% of end users in 2025 and exhibiting a CAGR of 8.3% over the forecast period.
Private sector acute/inpatient healthcare organizations often have more resources and financial capabilities to invest in advanced technologies, including EHR speech recognition solutions. Private sector acute/inpatient healthcare organizations prioritize efficiency and productivity to meet the demands of their patient population.
EHR speech recognition solutions can significantly enhance these aspects by reducing documentation time, improving data accuracy, and allowing clinicians to focus more on patient care. As a result, private sector organizations are more motivated to invest in these solutions to drive operational excellence.
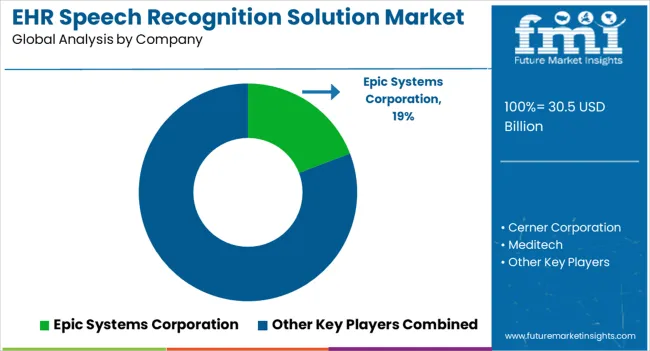
The competitive landscape of EHR (Electronic Health Record) speech recognition solution vendors is dynamic and constantly evolving. Several vendors offer speech recognition solutions specifically tailored for integration with EHR systems.
In May 2025, Suki, a pioneer in voice artificial intelligence (AI) technology for the healthcare industry, revealed plans to integrate its AI-enabled voice assistant with Epic EHR software leveraging ambient APIs from Epic.
In September 2025, Dolbey and Company, Inc. unveiled a collaboration with Orchard Software Corporation, to efficiently utilize front-end speech recognition and voice commands directly within their laboratory information system (LIS).
Similarly, recent developments related to the companies in the EHR speech recognition solution market have been tracked by the team at Future Market Insights, which are available in the full report.
| Report Attributes | Details |
|---|---|
| Forecast Period | 2025 to 2035 |
| Historical Data Available for | 2020 to 2025 |
| Market Analysis | USD Million for Value |
| Key Regions Covered | North America; Latin America; Europe; East Asia; South Asia; Oceania; Middle East; and Africa (MEA) |
| Key Countries Covered | USA, Canada, Brazil, Mexico, Argentina, Germany, Italy, France, United Kingdom, Spain, BENELUX, Russia, India, Thailand, China, Indonesia, Malaysia, Japan, South Korea, Australia, New Zealand, Türkiye, GCC countries, Northern Africa and South Africa. |
| Key Market Segments Covered | Solution, Architecture, End-user, and Region |
| Key Companies Profiled | Epic Systems Corporation; Cerner Corporation; Meditech; Computer Programs and Systems, Inc.; Allscripts; Medhost Inc.; Netsmart Technologies Inc.; Athena health; Harris Healthcare; eClinicalWorks; Nuance Dragon Medical; Dolbey; Suki; T-PRO; 3M; GE Healthcare |
| Report Coverage | Market Forecast, Competition Intelligence, DROT Analysis, Market Dynamics and Challenges, Strategic Growth Initiatives |
| Pricing | Available upon Request |
The global EHR speech recognition solution market is estimated to be valued at USD 30.5 billion in 2025.
The market size for the EHR speech recognition solution market is projected to reach USD 62.9 billion by 2035.
The EHR speech recognition solution market is expected to grow at a 7.5% CAGR between 2025 and 2035.
The key product types in EHR speech recognition solution market are integrated solution, clinical solution, administrative solution, reporting solutions, speech recognition solutions, finance solutions, stand alone solutions, services, consulting services, implementation & integration services and support & mAIntenance.
In terms of architecture, on-premises segment to command 58.4% share in the EHR speech recognition solution market in 2025.


Our Research Products

The "Full Research Suite" delivers actionable market intel, deep dives on markets or technologies, so clients act faster, cut risk, and unlock growth.

The Leaderboard benchmarks and ranks top vendors, classifying them as Established Leaders, Leading Challengers, or Disruptors & Challengers.

Locates where complements amplify value and substitutes erode it, forecasting net impact by horizon

We deliver granular, decision-grade intel: market sizing, 5-year forecasts, pricing, adoption, usage, revenue, and operational KPIs—plus competitor tracking, regulation, and value chains—across 60 countries broadly.

Spot the shifts before they hit your P&L. We track inflection points, adoption curves, pricing moves, and ecosystem plays to show where demand is heading, why it is changing, and what to do next across high-growth markets and disruptive tech

Real-time reads of user behavior. We track shifting priorities, perceptions of today’s and next-gen services, and provider experience, then pace how fast tech moves from trial to adoption, blending buyer, consumer, and channel inputs with social signals (#WhySwitch, #UX).

Partner with our analyst team to build a custom report designed around your business priorities. From analysing market trends to assessing competitors or crafting bespoke datasets, we tailor insights to your needs.
Supplier Intelligence
Discovery & Profiling
Capacity & Footprint
Performance & Risk
Compliance & Governance
Commercial Readiness
Who Supplies Whom
Scorecards & Shortlists
Playbooks & Docs
Category Intelligence
Definition & Scope
Demand & Use Cases
Cost Drivers
Market Structure
Supply Chain Map
Trade & Policy
Operating Norms
Deliverables
Buyer Intelligence
Account Basics
Spend & Scope
Procurement Model
Vendor Requirements
Terms & Policies
Entry Strategy
Pain Points & Triggers
Outputs
Pricing Analysis
Benchmarks
Trends
Should-Cost
Indexation
Landed Cost
Commercial Terms
Deliverables
Brand Analysis
Positioning & Value Prop
Share & Presence
Customer Evidence
Go-to-Market
Digital & Reputation
Compliance & Trust
KPIs & Gaps
Outputs
Full Research Suite comprises of:
Market outlook & trends analysis
Interviews & case studies
Strategic recommendations
Vendor profiles & capabilities analysis
5-year forecasts
8 regions and 60+ country-level data splits
Market segment data splits
12 months of continuous data updates
DELIVERED AS:
PDF EXCEL ONLINE
Mobile Speech Recognition Software Market Size and Share Forecast Outlook 2025 to 2035
Far Field Speech and Voice Recognition Market Size and Share Forecast Outlook 2025 to 2035
Speech and Voice Analytics Market Size and Share Forecast Outlook 2025 to 2035
Speech Intelligibility Devices Market Size and Share Forecast Outlook 2025 to 2035
Solution Styrene Butadiene Rubber (S-SBR) Market Size and Share Forecast Outlook 2025 to 2035
Speech Generating Devices Market
Speech Analytics Market
NGS Solution for Early Cancer Screening Market Size and Share Forecast Outlook 2025 to 2035
5PL Solutions Market
Iris Recognition Market Size and Share Forecast Outlook 2025 to 2035
Image Recognition in Retail Market Size and Share Forecast Outlook 2025 to 2035
Facial Recognition Market Size and Share Forecast Outlook 2025 to 2035
High-Resolution Anoscopy Market Size and Share Forecast Outlook 2025 to 2035
Facial Recognition Machine Market
mHealth Solutions Market Size and Share Forecast Outlook 2025 to 2035
Super Resolution Microscope Market Insights - Size, Share & Forecast 2025 to 2035
G-3 PLC Solution Market – Smart Grids & Connectivity
Gesture Recognition Market
Employee Recognition Software Market Analysis - Size, Share, and Forecast 2025 to 2035
Docketing Solution Market Size and Share Forecast Outlook 2025 to 2035

Thank you!
You will receive an email from our Business Development Manager. Please be sure to check your SPAM/JUNK folder too.
Chat With
MaRIA