Speech Intelligibility Devices Market Size and Share Forecast Outlook 2025 to 2035

The Speech Intelligibility Devices Market is estimated to be valued at USD 2.3 billion in 2025 and is projected to reach USD 5.0 billion by 2035, registering a compound annual growth rate (CAGR) of 8.3% over the forecast period.
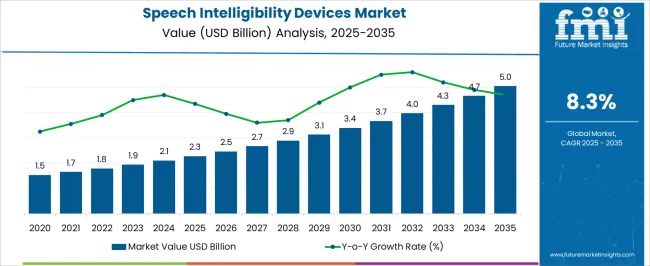
Quick Stats for Speech Intelligibility Devices Market

  • Speech Intelligibility Devices Market Value (2025): USD 2.3 billion
  • Speech Intelligibility Devices Market Forecast Value (2035): USD 5.0 billion
  • Speech Intelligibility Devices Market Forecast CAGR: 8.3%
  • Leading Segment in Speech Intelligibility Devices Market in 2025: Original Equipment Manufacturer (55.4%)
  • Key Growth Regions in Speech Intelligibility Devices Market: North America, Asia-Pacific, Europe
  • Top Key Players in Speech Intelligibility Devices Market: NTi Audio AG, Brüel & Kjær (HBK – Hottinger Brüel & Kjær), Listen, Inc., Head Acoustics GmbH, Auditory Sciences, Larson Davis (PCB Piezotronics, Inc.), Aco Pacific, Inc., Etymotic Research, Inc., Rion Co., Ltd., BSWA Technology Co., Ltd., Cirrus Research plc, NTi Japan Co., Ltd., Sinus Messtechnik GmbH

Speech Intelligibility Devices Market Market Value Analysis

Speech Intelligibility Devices Market Key Takeaways

Metric Value
Speech Intelligibility Devices Market Estimated Value in (2025 E) USD 2.3 billion
Speech Intelligibility Devices Market Forecast Value in (2035 F) USD 5.0 billion
Forecast CAGR (2025 to 2035) 8.3%

Why is the Speech Intelligibility Devices Market Growing?

The Speech Intelligibility Devices market is witnessing strong growth, driven by the rising demand for advanced communication technologies in healthcare, education, public safety, and professional settings. Increasing awareness of speech disorders and hearing impairments is leading to higher adoption of devices that enhance speech clarity and comprehension. Technological advancements in signal processing, noise reduction, and AI-based speech enhancement are improving device performance and user experience.

Integration with mobile and cloud platforms is enabling real-time monitoring, personalized configurations, and seamless user interaction. The growing emphasis on accessibility standards, regulatory compliance, and inclusive communication solutions is further shaping market adoption.

Institutions and organizations are increasingly deploying speech intelligibility devices to improve communication in classrooms, healthcare facilities, workplaces, and public spaces As awareness of speech clarity solutions continues to rise and investments in healthcare infrastructure and educational technologies expand, the market is expected to sustain long-term growth, with continuous innovation in software and hardware platforms enhancing usability, efficiency, and scalability.

Segmental Analysis

The speech intelligibility devices market is segmented by sales channel, application, and geographic regions. By sales channel, speech intelligibility devices market is divided into Original Equipment Manufacturer and Aftermarket. In terms of application, speech intelligibility devices market is classified into Phonetics, Ethnical Factors, Acoustical Engineering, and Audiometry. Regionally, the speech intelligibility devices industry is classified into North America, Latin America, Western Europe, Eastern Europe, Balkan & Baltic Countries, Russia & Belarus, Central Asia, East Asia, South Asia & Pacific, and the Middle East & Africa.
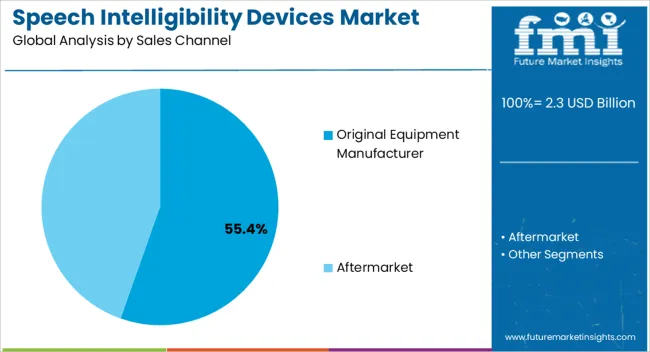
Insights into the Original Equipment Manufacturer Sales Channel Segment

Speech Intelligibility Devices Market Analysis By Sales Channel

The original equipment manufacturer (OEM) sales channel segment is projected to hold 55.4% of the market revenue in 2025, establishing it as the leading channel. Growth in this segment is being driven by the preference of end-users for directly integrated solutions that offer reliability, quality assurance, and long-term support. OEMs provide devices with optimized design, compatibility with existing systems, and advanced signal processing features that enhance speech clarity.

Partnerships with healthcare institutions, educational organizations, and professional service providers further accelerate adoption. The ability to customize devices to meet specific client requirements and regulatory standards strengthens the market position of OEMs.

Technological integration, including AI-driven speech enhancement, cloud connectivity, and remote diagnostics, adds value to the OEM channel, increasing customer confidence and satisfaction As demand for high-performance, durable, and efficient speech intelligibility devices grows, the OEM sales channel is expected to remain the primary revenue contributor, supported by innovations in design, functionality, and user-centric solutions.
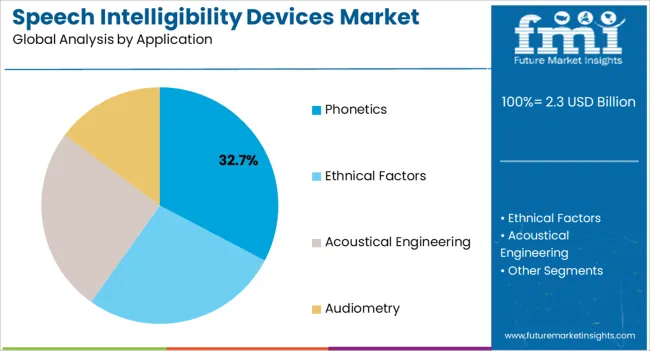
Insights into the Phonetics Application Segment

Speech Intelligibility Devices Market Analysis By Application

The phonetics application segment is anticipated to account for 32.7% of the market revenue in 2025, making it the leading application area. Growth in this segment is being driven by the increasing focus on improving speech clarity and pronunciation in clinical, educational, and professional settings. Speech intelligibility devices are being leveraged to support phonetic training, rehabilitation, and real-time speech enhancement, particularly for individuals with hearing impairments, speech disorders, or language learning needs.

Advances in audio signal processing, adaptive algorithms, and AI-powered speech analysis are enhancing device effectiveness, ensuring clear and accurate communication. The integration of phonetics-focused applications with educational tools, therapy programs, and training platforms is further supporting adoption.

Regulatory compliance in healthcare and education sectors, coupled with rising awareness of inclusive communication standards, has reinforced demand for phonetics-oriented devices As organizations and institutions continue to prioritize speech clarity and effective communication, the phonetics application segment is expected to remain a primary growth driver, supported by technological advancements and increased adoption across multiple sectors.

Market Overview

Speech Intelligibility Devices Market Overview

Speech is the basic mode of communication for humans, and hence it is of utmost importance that it is heard intelligibly. The intelligibility of speech relies upon the properties such as acoustical data in which the voice is transmitted from the speaker to the listener.

Furthermore, an important aspect of determining the speech intelligibility is the level of background noise.Even though there have been numerous efforts to factually quantify the speech intelligibility, the best method which is widely used is no doubt the Speech Transmission Index (STI) and its derivatives.

The speech transmission index is based on the relation between intensity modulations and perceived speech intelligibility in the speaker’s voice. The Modulation Transfer Function (MTF) defines to what amount the modulation is conveyed from the source to the receiver, as the modulation frequency varies from 0.63 to 12.5 Hz.

Thus, the modulation transfer function relies on the device properties and the noise produced in the background. Human communication is a continuous waveform with a fundamental frequency which varies from 100 to 400 Hz (The average is about 200 hertz for women and 100 hertz for men).

A recent research have come up with a development that the criminals and suspects of crimes can be identified through their recorded voice during that particular instant of crime with the use of speech intelligibility devices.

The voice modulation techniques have found application in investigation, defense as well as entertainment sectors. Since sound engineering is a hopeful sector in the field of science and technology, speech intelligibility gadgets will gain significant traction in the market over the forecast period.
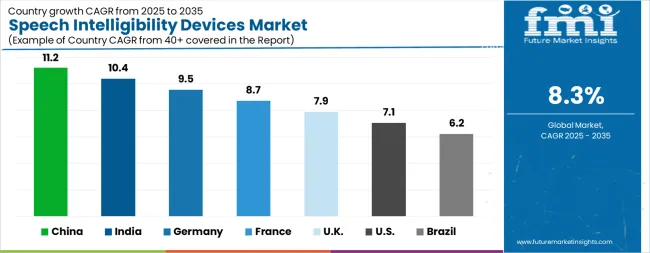
Analysis of Speech Intelligibility Devices Market By Key Countries

Speech Intelligibility Devices Market Cagr Analysis By Country

Country CAGR
China 11.2%
India 10.4%
Germany 9.5%
France 8.7%
UK 7.9%
USA 7.1%
Brazil 6.2%

Country-wise Analysis

The Speech Intelligibility Devices Market is expected to register a CAGR of 8.3% during the forecast period, exhibiting varied country level momentum. China leads with the highest CAGR of 11.2%, followed by India at 10.4%. Developed markets such as Germany, France, and the UK continue to expand steadily, while the USA is likely to grow at consistent rates. Brazil posts the lowest CAGR at 6.2%, yet still underscores a broadly positive trajectory for the global Speech Intelligibility Devices Market. In 2024, Germany held a dominant revenue in the Western Europe market and is expected to grow with a CAGR of 9.5%. The USA Speech Intelligibility Devices Market is estimated to be valued at USD 823.1 million in 2025 and is anticipated to reach a valuation of USD 1.6 billion by 2035. Sales are projected to rise at a CAGR of 7.1% over the forecast period between 2025 and 2035. While Japan and South Korea markets are estimated to be valued at USD 108.4 million and USD 73.2 million respectively in 2025.
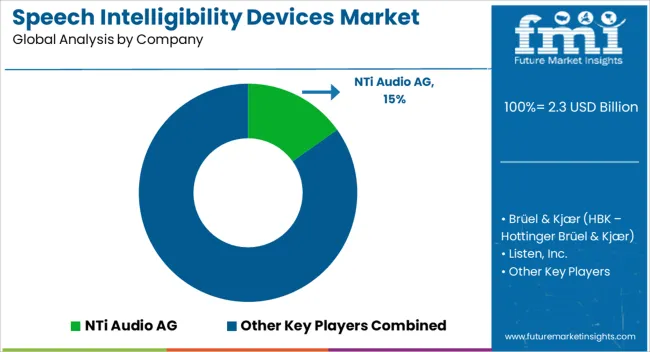
Key Players in the Speech Intelligibility Devices Market

Speech Intelligibility Devices Market Analysis By Company

  • NTi Audio AG
  • Brüel & Kjær (HBK – Hottinger Brüel & Kjær)
  • Listen, Inc.
  • Head Acoustics GmbH
  • Auditory Sciences
  • Larson Davis (PCB Piezotronics, Inc.)
  • Aco Pacific, Inc.
  • Etymotic Research, Inc.
  • Rion Co., Ltd.
  • BSWA Technology Co., Ltd.
  • Cirrus Research plc
  • NTi Japan Co., Ltd.
  • Sinus Messtechnik GmbH

Scope of the Report

Item Value
Quantitative Units USD 2.3 Billion
Sales Channel Original Equipment Manufacturer and Aftermarket
Application Phonetics, Ethnical Factors, Acoustical Engineering, and Audiometry
Regions Covered North America, Europe, Asia-Pacific, Latin America, Middle East & Africa
Country Covered United States, Canada, Germany, France, United Kingdom, China, Japan, India, Brazil, South Africa
Key Companies Profiled NTi Audio AG, Brüel & Kjær (HBK – Hottinger Brüel & Kjær), Listen, Inc., Head Acoustics GmbH, Auditory Sciences, Larson Davis (PCB Piezotronics, Inc.), Aco Pacific, Inc., Etymotic Research, Inc., Rion Co., Ltd., BSWA Technology Co., Ltd., Cirrus Research plc, NTi Japan Co., Ltd., and Sinus Messtechnik GmbH

Speech Intelligibility Devices Market by Segments

Sales Channel:

  • Original Equipment Manufacturer
  • Aftermarket

Application:

  • Phonetics
  • Ethnical Factors
  • Acoustical Engineering
  • Audiometry

Region:

  • North America
    • USA
    • Canada
    • Mexico
  • Latin America
    • Brazil
    • Chile
    • Rest of Latin America
  • Western Europe
    • Germany
    • UK
    • Italy
    • Spain
    • France
    • Nordic
    • BENELUX
    • Rest of Western Europe
  • Eastern Europe
    • Russia
    • Poland
    • Hungary
    • Balkan & Baltic
    • Rest of Eastern Europe
  • East Asia
    • China
    • Japan
    • South Korea
  • South Asia and Pacific
    • India
    • ASEAN
    • Australia & New Zealand
    • Rest of South Asia and Pacific
  • Middle East & Africa
    • Kingdom of Saudi Arabia
    • Other GCC Countries
    • Turkiye
    • South Africa
    • Other African Union
    • Rest of Middle East & Africa

Table of Content

  1. Executive Summary
    • Global Market Outlook
    • Demand-side Trends
    • Supply-side Trends
    • Technology Roadmap Analysis
    • Analysis and Recommendations
  2. Market Overview
    • Market Coverage / Taxonomy
    • Market Definition / Scope / Limitations
  3. Market Background
    • Market Dynamics
      • Drivers
      • Restraints
      • Opportunity
      • Trends
    • Scenario Forecast
      • Demand in Optimistic Scenario
      • Demand in Likely Scenario
      • Demand in Conservative Scenario
    • Opportunity Map Analysis
    • Product Life Cycle Analysis
    • Supply Chain Analysis
    • Investment Feasibility Matrix
    • Value Chain Analysis
    • PESTLE and Porter’s Analysis
    • Regulatory Landscape
    • Regional Parent Market Outlook
    • Production and Consumption Statistics
    • Import and Export Statistics
  4. Global Market Analysis 2020 to 2024 and Forecast, 2025 to 2035
    • Historical Market Size Value (USD Million) Analysis, 2020 to 2024
    • Current and Future Market Size Value (USD Million) Projections, 2025 to 2035
      • Y-o-Y Growth Trend Analysis
      • Absolute $ Opportunity Analysis
  5. Global Market Pricing Analysis 2020 to 2024 and Forecast 2025 to 2035
  6. Global Market Analysis 2020 to 2024 and Forecast 2025 to 2035, By Sales Channel
    • Introduction / Key Findings
    • Historical Market Size Value (USD Million) Analysis By Sales Channel , 2020 to 2024
    • Current and Future Market Size Value (USD Million) Analysis and Forecast By Sales Channel , 2025 to 2035
      • Original Equipment Manufacturer
      • Aftermarket
    • Y-o-Y Growth Trend Analysis By Sales Channel , 2020 to 2024
    • Absolute $ Opportunity Analysis By Sales Channel , 2025 to 2035
  7. Global Market Analysis 2020 to 2024 and Forecast 2025 to 2035, By Application
    • Introduction / Key Findings
    • Historical Market Size Value (USD Million) Analysis By Application, 2020 to 2024
    • Current and Future Market Size Value (USD Million) Analysis and Forecast By Application, 2025 to 2035
      • Phonetics
      • Ethnical Factors
      • Acoustical Engineering
      • Audiometry
    • Y-o-Y Growth Trend Analysis By Application, 2020 to 2024
    • Absolute $ Opportunity Analysis By Application, 2025 to 2035
  8. Global Market Analysis 2020 to 2024 and Forecast 2025 to 2035, By Region
    • Introduction
    • Historical Market Size Value (USD Million) Analysis By Region, 2020 to 2024
    • Current Market Size Value (USD Million) Analysis and Forecast By Region, 2025 to 2035
      • North America
      • Latin America
      • Western Europe
      • Eastern Europe
      • East Asia
      • South Asia and Pacific
      • Middle East & Africa
    • Market Attractiveness Analysis By Region
  9. North America Market Analysis 2020 to 2024 and Forecast 2025 to 2035, By Country
    • Historical Market Size Value (USD Million) Trend Analysis By Market Taxonomy, 2020 to 2024
    • Market Size Value (USD Million) Forecast By Market Taxonomy, 2025 to 2035
      • By Country
        • USA
        • Canada
        • Mexico
      • By Sales Channel
      • By Application
    • Market Attractiveness Analysis
      • By Country
      • By Sales Channel
      • By Application
    • Key Takeaways
  10. Latin America Market Analysis 2020 to 2024 and Forecast 2025 to 2035, By Country
    • Historical Market Size Value (USD Million) Trend Analysis By Market Taxonomy, 2020 to 2024
    • Market Size Value (USD Million) Forecast By Market Taxonomy, 2025 to 2035
      • By Country
        • Brazil
        • Chile
        • Rest of Latin America
      • By Sales Channel
      • By Application
    • Market Attractiveness Analysis
      • By Country
      • By Sales Channel
      • By Application
    • Key Takeaways
  11. Western Europe Market Analysis 2020 to 2024 and Forecast 2025 to 2035, By Country
    • Historical Market Size Value (USD Million) Trend Analysis By Market Taxonomy, 2020 to 2024
    • Market Size Value (USD Million) Forecast By Market Taxonomy, 2025 to 2035
      • By Country
        • Germany
        • UK
        • Italy
        • Spain
        • France
        • Nordic
        • BENELUX
        • Rest of Western Europe
      • By Sales Channel
      • By Application
    • Market Attractiveness Analysis
      • By Country
      • By Sales Channel
      • By Application
    • Key Takeaways
  12. Eastern Europe Market Analysis 2020 to 2024 and Forecast 2025 to 2035, By Country
    • Historical Market Size Value (USD Million) Trend Analysis By Market Taxonomy, 2020 to 2024
    • Market Size Value (USD Million) Forecast By Market Taxonomy, 2025 to 2035
      • By Country
        • Russia
        • Poland
        • Hungary
        • Balkan & Baltic
        • Rest of Eastern Europe
      • By Sales Channel
      • By Application
    • Market Attractiveness Analysis
      • By Country
      • By Sales Channel
      • By Application
    • Key Takeaways
  13. East Asia Market Analysis 2020 to 2024 and Forecast 2025 to 2035, By Country
    • Historical Market Size Value (USD Million) Trend Analysis By Market Taxonomy, 2020 to 2024
    • Market Size Value (USD Million) Forecast By Market Taxonomy, 2025 to 2035
      • By Country
        • China
        • Japan
        • South Korea
      • By Sales Channel
      • By Application
    • Market Attractiveness Analysis
      • By Country
      • By Sales Channel
      • By Application
    • Key Takeaways
  14. South Asia and Pacific Market Analysis 2020 to 2024 and Forecast 2025 to 2035, By Country
    • Historical Market Size Value (USD Million) Trend Analysis By Market Taxonomy, 2020 to 2024
    • Market Size Value (USD Million) Forecast By Market Taxonomy, 2025 to 2035
      • By Country
        • India
        • ASEAN
        • Australia & New Zealand
        • Rest of South Asia and Pacific
      • By Sales Channel
      • By Application
    • Market Attractiveness Analysis
      • By Country
      • By Sales Channel
      • By Application
    • Key Takeaways
  15. Middle East & Africa Market Analysis 2020 to 2024 and Forecast 2025 to 2035, By Country
    • Historical Market Size Value (USD Million) Trend Analysis By Market Taxonomy, 2020 to 2024
    • Market Size Value (USD Million) Forecast By Market Taxonomy, 2025 to 2035
      • By Country
        • Kingdom of Saudi Arabia
        • Other GCC Countries
        • Turkiye
        • South Africa
        • Other African Union
        • Rest of Middle East & Africa
      • By Sales Channel
      • By Application
    • Market Attractiveness Analysis
      • By Country
      • By Sales Channel
      • By Application
    • Key Takeaways
  16. Key Countries Market Analysis
    • USA
      • Pricing Analysis
      • Market Share Analysis, 2024
        • By Sales Channel
        • By Application
    • Canada
      • Pricing Analysis
      • Market Share Analysis, 2024
        • By Sales Channel
        • By Application
    • Mexico
      • Pricing Analysis
      • Market Share Analysis, 2024
        • By Sales Channel
        • By Application
    • Brazil
      • Pricing Analysis
      • Market Share Analysis, 2024
        • By Sales Channel
        • By Application
    • Chile
      • Pricing Analysis
      • Market Share Analysis, 2024
        • By Sales Channel
        • By Application
    • Germany
      • Pricing Analysis
      • Market Share Analysis, 2024
        • By Sales Channel
        • By Application
    • UK
      • Pricing Analysis
      • Market Share Analysis, 2024
        • By Sales Channel
        • By Application
    • Italy
      • Pricing Analysis
      • Market Share Analysis, 2024
        • By Sales Channel
        • By Application
    • Spain
      • Pricing Analysis
      • Market Share Analysis, 2024
        • By Sales Channel
        • By Application
    • France
      • Pricing Analysis
      • Market Share Analysis, 2024
        • By Sales Channel
        • By Application
    • India
      • Pricing Analysis
      • Market Share Analysis, 2024
        • By Sales Channel
        • By Application
    • ASEAN
      • Pricing Analysis
      • Market Share Analysis, 2024
        • By Sales Channel
        • By Application
    • Australia & New Zealand
      • Pricing Analysis
      • Market Share Analysis, 2024
        • By Sales Channel
        • By Application
    • China
      • Pricing Analysis
      • Market Share Analysis, 2024
        • By Sales Channel
        • By Application
    • Japan
      • Pricing Analysis
      • Market Share Analysis, 2024
        • By Sales Channel
        • By Application
    • South Korea
      • Pricing Analysis
      • Market Share Analysis, 2024
        • By Sales Channel
        • By Application
    • Russia
      • Pricing Analysis
      • Market Share Analysis, 2024
        • By Sales Channel
        • By Application
    • Poland
      • Pricing Analysis
      • Market Share Analysis, 2024
        • By Sales Channel
        • By Application
    • Hungary
      • Pricing Analysis
      • Market Share Analysis, 2024
        • By Sales Channel
        • By Application
    • Kingdom of Saudi Arabia
      • Pricing Analysis
      • Market Share Analysis, 2024
        • By Sales Channel
        • By Application
    • Turkiye
      • Pricing Analysis
      • Market Share Analysis, 2024
        • By Sales Channel
        • By Application
    • South Africa
      • Pricing Analysis
      • Market Share Analysis, 2024
        • By Sales Channel
        • By Application
  17. Market Structure Analysis
    • Competition Dashboard
    • Competition Benchmarking
    • Market Share Analysis of Top Players
      • By Regional
      • By Sales Channel
      • By Application
  18. Competition Analysis
    • Competition Deep Dive
      • NTi Audio AG
        • Overview
        • Product Portfolio
        • Profitability by Market Segments (Product/Age /Sales Channel/Region)
        • Sales Footprint
        • Strategy Overview
          • Marketing Strategy
          • Product Strategy
          • Channel Strategy
      • Brüel & Kjær (HBK – Hottinger Brüel & Kjær)
      • Listen, Inc.
      • Head Acoustics GmbH
      • Auditory Sciences
      • Larson Davis (PCB Piezotronics, Inc.)
      • Aco Pacific, Inc.
      • Etymotic Research, Inc.
      • Rion Co., Ltd.
      • BSWA Technology Co., Ltd.
      • Cirrus Research plc
      • NTi Japan Co., Ltd.
      • Sinus Messtechnik GmbH
  19. Assumptions & Acronyms Used
  20. Research Methodology

List of Tables

  • Table 1: Global Market Value (USD Million) Forecast by Region, 2020 to 2035
  • Table 2: Global Market Value (USD Million) Forecast by Sales Channel , 2020 to 2035
  • Table 3: Global Market Value (USD Million) Forecast by Application, 2020 to 2035
  • Table 4: North America Market Value (USD Million) Forecast by Country, 2020 to 2035
  • Table 5: North America Market Value (USD Million) Forecast by Sales Channel , 2020 to 2035
  • Table 6: North America Market Value (USD Million) Forecast by Application, 2020 to 2035
  • Table 7: Latin America Market Value (USD Million) Forecast by Country, 2020 to 2035
  • Table 8: Latin America Market Value (USD Million) Forecast by Sales Channel , 2020 to 2035
  • Table 9: Latin America Market Value (USD Million) Forecast by Application, 2020 to 2035
  • Table 10: Western Europe Market Value (USD Million) Forecast by Country, 2020 to 2035
  • Table 11: Western Europe Market Value (USD Million) Forecast by Sales Channel , 2020 to 2035
  • Table 12: Western Europe Market Value (USD Million) Forecast by Application, 2020 to 2035
  • Table 13: Eastern Europe Market Value (USD Million) Forecast by Country, 2020 to 2035
  • Table 14: Eastern Europe Market Value (USD Million) Forecast by Sales Channel , 2020 to 2035
  • Table 15: Eastern Europe Market Value (USD Million) Forecast by Application, 2020 to 2035
  • Table 16: East Asia Market Value (USD Million) Forecast by Country, 2020 to 2035
  • Table 17: East Asia Market Value (USD Million) Forecast by Sales Channel , 2020 to 2035
  • Table 18: East Asia Market Value (USD Million) Forecast by Application, 2020 to 2035
  • Table 19: South Asia and Pacific Market Value (USD Million) Forecast by Country, 2020 to 2035
  • Table 20: South Asia and Pacific Market Value (USD Million) Forecast by Sales Channel , 2020 to 2035
  • Table 21: South Asia and Pacific Market Value (USD Million) Forecast by Application, 2020 to 2035
  • Table 22: Middle East & Africa Market Value (USD Million) Forecast by Country, 2020 to 2035
  • Table 23: Middle East & Africa Market Value (USD Million) Forecast by Sales Channel , 2020 to 2035
  • Table 24: Middle East & Africa Market Value (USD Million) Forecast by Application, 2020 to 2035

List of Figures

  • Figure 1: Global Market Pricing Analysis
  • Figure 2: Global Market Value (USD Million) Forecast 2020 to 2035
  • Figure 3: Global Market Value Share and BPS Analysis by Sales Channel , 2025 and 2035
  • Figure 4: Global Market Y-o-Y Growth Comparison by Sales Channel , 2025 to 2035
  • Figure 5: Global Market Attractiveness Analysis by Sales Channel
  • Figure 6: Global Market Value Share and BPS Analysis by Application, 2025 and 2035
  • Figure 7: Global Market Y-o-Y Growth Comparison by Application, 2025 to 2035
  • Figure 8: Global Market Attractiveness Analysis by Application
  • Figure 9: Global Market Value (USD Million) Share and BPS Analysis by Region, 2025 and 2035
  • Figure 10: Global Market Y-o-Y Growth Comparison by Region, 2025 to 2035
  • Figure 11: Global Market Attractiveness Analysis by Region
  • Figure 12: North America Market Incremental Dollar Opportunity, 2025 to 2035
  • Figure 13: Latin America Market Incremental Dollar Opportunity, 2025 to 2035
  • Figure 14: Western Europe Market Incremental Dollar Opportunity, 2025 to 2035
  • Figure 15: Eastern Europe Market Incremental Dollar Opportunity, 2025 to 2035
  • Figure 16: East Asia Market Incremental Dollar Opportunity, 2025 to 2035
  • Figure 17: South Asia and Pacific Market Incremental Dollar Opportunity, 2025 to 2035
  • Figure 18: Middle East & Africa Market Incremental Dollar Opportunity, 2025 to 2035
  • Figure 19: North America Market Value Share and BPS Analysis by Country, 2025 and 2035
  • Figure 20: North America Market Value Share and BPS Analysis by Sales Channel , 2025 and 2035
  • Figure 21: North America Market Y-o-Y Growth Comparison by Sales Channel , 2025 to 2035
  • Figure 22: North America Market Attractiveness Analysis by Sales Channel
  • Figure 23: North America Market Value Share and BPS Analysis by Application, 2025 and 2035
  • Figure 24: North America Market Y-o-Y Growth Comparison by Application, 2025 to 2035
  • Figure 25: North America Market Attractiveness Analysis by Application
  • Figure 26: Latin America Market Value Share and BPS Analysis by Country, 2025 and 2035
  • Figure 27: Latin America Market Value Share and BPS Analysis by Sales Channel , 2025 and 2035
  • Figure 28: Latin America Market Y-o-Y Growth Comparison by Sales Channel , 2025 to 2035
  • Figure 29: Latin America Market Attractiveness Analysis by Sales Channel
  • Figure 30: Latin America Market Value Share and BPS Analysis by Application, 2025 and 2035
  • Figure 31: Latin America Market Y-o-Y Growth Comparison by Application, 2025 to 2035
  • Figure 32: Latin America Market Attractiveness Analysis by Application
  • Figure 33: Western Europe Market Value Share and BPS Analysis by Country, 2025 and 2035
  • Figure 34: Western Europe Market Value Share and BPS Analysis by Sales Channel , 2025 and 2035
  • Figure 35: Western Europe Market Y-o-Y Growth Comparison by Sales Channel , 2025 to 2035
  • Figure 36: Western Europe Market Attractiveness Analysis by Sales Channel
  • Figure 37: Western Europe Market Value Share and BPS Analysis by Application, 2025 and 2035
  • Figure 38: Western Europe Market Y-o-Y Growth Comparison by Application, 2025 to 2035
  • Figure 39: Western Europe Market Attractiveness Analysis by Application
  • Figure 40: Eastern Europe Market Value Share and BPS Analysis by Country, 2025 and 2035
  • Figure 41: Eastern Europe Market Value Share and BPS Analysis by Sales Channel , 2025 and 2035
  • Figure 42: Eastern Europe Market Y-o-Y Growth Comparison by Sales Channel , 2025 to 2035
  • Figure 43: Eastern Europe Market Attractiveness Analysis by Sales Channel
  • Figure 44: Eastern Europe Market Value Share and BPS Analysis by Application, 2025 and 2035
  • Figure 45: Eastern Europe Market Y-o-Y Growth Comparison by Application, 2025 to 2035
  • Figure 46: Eastern Europe Market Attractiveness Analysis by Application
  • Figure 47: East Asia Market Value Share and BPS Analysis by Country, 2025 and 2035
  • Figure 48: East Asia Market Value Share and BPS Analysis by Sales Channel , 2025 and 2035
  • Figure 49: East Asia Market Y-o-Y Growth Comparison by Sales Channel , 2025 to 2035
  • Figure 50: East Asia Market Attractiveness Analysis by Sales Channel
  • Figure 51: East Asia Market Value Share and BPS Analysis by Application, 2025 and 2035
  • Figure 52: East Asia Market Y-o-Y Growth Comparison by Application, 2025 to 2035
  • Figure 53: East Asia Market Attractiveness Analysis by Application
  • Figure 54: South Asia and Pacific Market Value Share and BPS Analysis by Country, 2025 and 2035
  • Figure 55: South Asia and Pacific Market Value Share and BPS Analysis by Sales Channel , 2025 and 2035
  • Figure 56: South Asia and Pacific Market Y-o-Y Growth Comparison by Sales Channel , 2025 to 2035
  • Figure 57: South Asia and Pacific Market Attractiveness Analysis by Sales Channel
  • Figure 58: South Asia and Pacific Market Value Share and BPS Analysis by Application, 2025 and 2035
  • Figure 59: South Asia and Pacific Market Y-o-Y Growth Comparison by Application, 2025 to 2035
  • Figure 60: South Asia and Pacific Market Attractiveness Analysis by Application
  • Figure 61: Middle East & Africa Market Value Share and BPS Analysis by Country, 2025 and 2035
  • Figure 62: Middle East & Africa Market Value Share and BPS Analysis by Sales Channel , 2025 and 2035
  • Figure 63: Middle East & Africa Market Y-o-Y Growth Comparison by Sales Channel , 2025 to 2035
  • Figure 64: Middle East & Africa Market Attractiveness Analysis by Sales Channel
  • Figure 65: Middle East & Africa Market Value Share and BPS Analysis by Application, 2025 and 2035
  • Figure 66: Middle East & Africa Market Y-o-Y Growth Comparison by Application, 2025 to 2035
  • Figure 67: Middle East & Africa Market Attractiveness Analysis by Application
  • Figure 68: Global Market – Tier Structure Analysis
  • Figure 69: Global Market – Company Share Analysis

Frequently Asked Questions

How big is the speech intelligibility devices market in 2025?

The global speech intelligibility devices market is estimated to be valued at USD 2.3 billion in 2025.

What will be the size of speech intelligibility devices market in 2035?

The market size for the speech intelligibility devices market is projected to reach USD 5.0 billion by 2035.

How much will be the speech intelligibility devices market growth between 2025 and 2035?

The speech intelligibility devices market is expected to grow at a 8.3% CAGR between 2025 and 2035.

What are the key product types in the speech intelligibility devices market?

The key product types in speech intelligibility devices market are original equipment manufacturer and aftermarket.

Which application segment to contribute significant share in the speech intelligibility devices market in 2025?

In terms of application, phonetics segment to command 32.7% share in the speech intelligibility devices market in 2025.

Explore Similar Insights

Future Market Insights

Speech Intelligibility Devices Market

Chat With MaRIA

Chat With

MaRIA

Hi There, I am MaRIA, Your Market Research Intelligence Assistant. How may I help you?