Image Intensifier Market Size, Share & Forecast 2025 to 2035

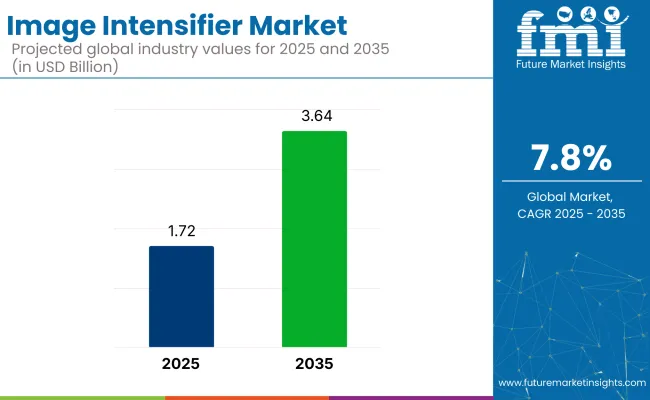
The global image intensifier market is projected to grow from USD 1.72 billion in 2025 to USD 3.64 billion by 2035, registering a CAGR of 7.8% during the forecast period. The growth is being driven by rising demand for advanced imaging technologies in medical diagnostics, radiology, surgical procedures, and emergency medicine.
Quick Stats of Image Intensifier Market

  • Market Value (2025): USD 1.72 billion
  • Forecast Value (2035): USD 3.64 billion
  • Forecast CAGR: 7.8%
  • Leading Segment in 2025: Non-gated intensifiers (40% share)
  • Key Growth Region: Asia (India)
  • Top Key Players: Argus, L3Harris, Canon, Dantec Dynamics, Elbit Systems

Image Intensifier Market

Image enhancer are increasingly being used to enhance image quality in low-light environments, contributing to better visibility and more accurate diagnostics. The need for high-quality imaging in healthcare settings such as hospitals and clinics is propelling the adoption of these technologies.

The market holds a niche but a share within its parent markets. In the optical imaging market, it accounts for approximately 4-6% of the total market share, as image intensifiers are crucial for low-light and night-time optical applications. Within the night vision systems industry, the share is much higher, around 20-25%, due to their central role in enhancing visibility in low-light environments.

The military and defense electronics industry sees image intensifiers contributing to about 8-10% of the share, primarily for tactical operations and surveillance. In the medical imaging, their share is about 2-3%, used in certain diagnostic equipment. The security and surveillance equipment industry has a more modest share of about 5-7%, driven by their use in low-light surveillance settings.

“Expansion into the USA market presents a significant opportunity to strengthen our position as a global leader in image intensifier tubes. This new capacity will also enable us to meet customers' demand for large-volume, high-performance products manufactured in the USA,” said Jérôme Cerisier, CEO of Exosens.

This stipulates the strategic importance of expanding reach and enhancing capacity to meet the growing demand for image enhancer technologies. Top players like GE Healthcare, Philips Healthcare, and Canon Medical Systems are heavily investing in R&D to innovate and offer n-performance imaging solutions.

Analyzing the Image Intensifier Market by Top Investment Segments

The market is being driven by investments in Generation III, non-gated image intensifiers, compact intensifiers, and night vision goggles. These technologies are fueling advancements in military, security, and industrial applications. Increasing demand for better visibility in low-light conditions is shaping this growth trajectory.

Exploring the Impact of Advanced Technologies in High-Stakes Scenarios

Generation III segment is projected to dominate the industry with an estimated 45% share in 2025.
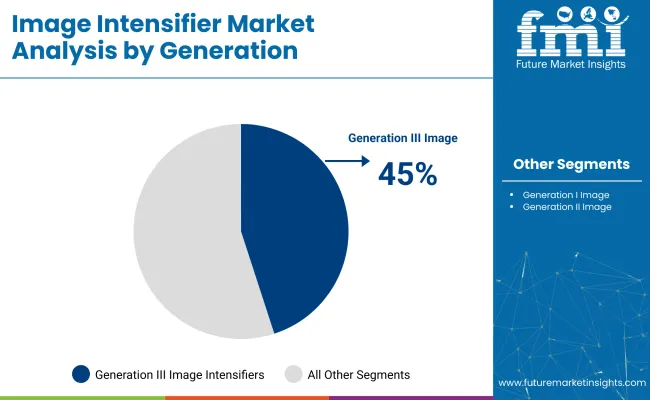
  • Recognized for their high resolution, brightness, and low-light performance, they are extensively used in military, defense, and security operations. Companies like Northrop Grumman and L3HarrisTechnologies are significant contributors to the development of these technologies, making them integral for surveillance and reconnaissance missions.
  • These intensifiers provide unparalleled reliability and performance in crucial tactical scenarios, boosting their adoption in high-stakes environments where precision and clarity are essential. Their increased usage in night vision devices for security personnel and military applications is expected to continue growing.

Image Intensifier Market Analysis By Generation

Non-Gated Image Intensifiers set to Capture a Significant Portion of Market

Non-gated are forecasted to capture 40% of the industry share by 2025, because of their cost-efficiency and high performance in commercial and industrial applications.
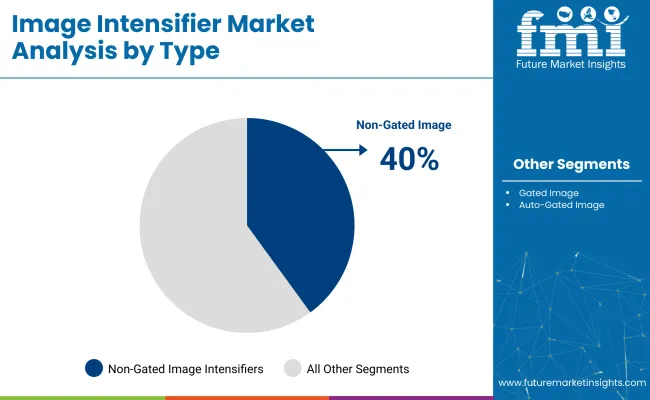
  • These intensifiers excel in environments with moderate to bright lighting, making them ideal for surveillance cameras, industrial inspection, and general security systems. Manufacturers like Photonis and Optix are preeminent the development of non-gated technologies, focusing on improving their reliability and versatility.
  • Their simplicity and affordability make them an attractive option for various industries, including automotive, agriculture, and security.

Image Intensifier Market Analysis By Type

25 mm to 37 mm Diameter Segment Are Expected to Hold 35% Industry Share

25 mm to 37 mm diameter segment are projected to hold 35% of the industry share in 2025.

  • The small yet powerful devices are broadly used in portable night vision equipment, wearable devices, and handheld tools. Their compact design allows for seamless integration into tactical gear and consumer electronics, making them suitable for military, security, and recreational applications.
  • Top companies like ITT Exelis and Thales are focusing on refining compact intensifier technologies, ensuring ergonomic designs and reliable low-light performance. These developments enable users to operate the devices comfortably for extended periods, especially in tactical operations or fieldwork environments.

Night Vision Goggles to Capture 20% Industry Share in 2025

Night vision goggles are projected to account for 20% of the application industry in 2025.

  • Broadly adopted by military, law enforcement, and security personnel, these goggles are crucial for enhanced vision in complete darkness, especially in tactical and surveillance operations.
  • The demand for portable, reliable, and high-performance optical technologies grows, FLIR Systems and Bushnell are leading innovation in night vision goggle designs. These companies are continuously advancing goggle features to improve user experience, durability, and portability, making them indispensable tools for night surveillance, search and rescue, and military operations.

Top Image Intensifier Market Dynamics

The industry is being driven by increasing demand across defense, medical, and industrial sectors. Technological advancements and growing security concerns are propelling expansion. However, competition from alternative imaging technologies and regulatory complexities are limiting growth.

Surge in Growth Driven by Rising Demand Across Defense, Medical, and Industrial Sectors

  • Increasing demand in the defense, medical, and industrial sectors is fueling growth.
  • Image enhancers are being employed in military night vision systems, improving situational awareness.
  • Diagnostic imaging in the medical field is benefiting from enhanced visibility in low-light conditions.
  • The intensifiers are being used in industrial applications like non-destructive testing and quality control, while technological advancements in resolution and sensitivity drive adoption.

Growth Slowed by Intense Competition from Alternative Imaging Technologies and Complex Regulations
  • Competition from alternative imaging technologies, such as CMOS and CCD sensors, is slowing the adoption of image enhancers due to better performance, longer operational life, and reduced maintenance.
  • Export restrictions and compliance regulations are limiting industry access and increasing operational costs for manufacturers.

Analyzing Top Countries Manufacturing, Installing, and Maintaining Image Intensifiers

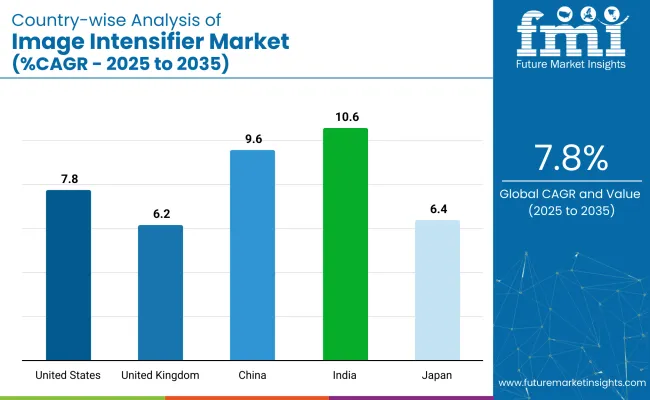
Country Wise Analysis Of Image Intensifier Market Cagr 2025 To 2035

Countries CAGR (2025 to 2035)
United States 7.8%
United Kingdom 6.2%
China 9.6%
India 10.6%
Japan 6.4%

In the global context, the industry presents a progressive growth landscape across various regions. India stands out with the highest CAGR (10.6%), fuelled by rapid healthcare infrastructure expansion, rising diagnostic imaging demand, and increased medical tourism.

This positions India as one of the fastest-growing industries globally, particularly within the BRICS group. China, with a 9.6% CAGR, follows closely, benefiting from strong government support and technological advancements in medical devices, positioning it as a key player in the BRICS group as well.

The United States and United Kingdom, both members of the OECD, show more moderate growth at 7.8% and 6.2% CAGR, respectively. These developed nations are characterized by stable, mature healthcare systems with continued demand for advanced imaging technologies, but their growth rates are slower compared to emerging industries. Japan, also in the OECD, indicates steady growth at 6.4%, driven by the aging population and increasing healthcare needs.

An Overview of the USA Image Intensifier Growth

The industry in United States is projected to grow at a CAGR of 7.8% through 2035, driven by healthcare investments, technological advancements, and increasing demand for medical imaging solutions.

  • Key companies like Philips Healthcare, Siemens Healthineers, and GE Healthcare are developing advanced technologies to enhance diagnostic imaging across various medical fields. The adoption of digital imaging systems, coupled with government regulations supporting healthcare upgrades, is fueling expansion.
  • Continuous innovations in image resolution and efficiency further contribute to the steady growth of the USA healthcare sector, positioning it for continued leadership in the industry.

UK Image Intensifier Analysis and Growth

The United Kingdom industry is expected to grow at a CAGR of 6.2% through 2035. Growth is being supported by increasing demand for advanced diagnostic imaging technologies in hospitals and healthcare centers.

  • Companies like Oxford Instruments, Philips Healthcare, and Siemens Healthineers are enhancing the systems for improved clarity and accuracy. Healthcare initiatives focusing on preventive care and early disease detection contribute to market expansion.
  • Continuous technological advancements and regulatory support are driving the industry. The industry is further bolstered by investments in research and development of next-generation imaging systems to improve patient outcomes.

In-Depth Analysis of China Image Intensifier Growth

The China market is projected to grow at a CAGR of 9.6% through 2035. Growth is driven by rapid healthcare modernization, increasing government spending on medical infrastructure, and expanding urban healthcare facilities.

  • Prominent manufacturers such as Shanghai United Imaging Healthcare Co. and Mindray Medical are innovating and implementing cutting-edge solutions for diagnostic imaging. Supportive government policies for digital health technologies, along with increased healthcare spending, are boosting growth.
  • The industry is further supported by increasing awareness of healthcare accessibility in rural and urban areas, coupled with advancements in image processing technologies.

India Image Intensifier Analysis and Growth

The market in India is expected to grow at a CAGR of 10.6% through 2035. Growth is being fueled by rising healthcare investments, urbanization, and demand for affordable diagnostic imaging solutions.

  • Key companies like GE Healthcare, Philips, and Siemens Healthineers are increasing their presence in India’s swiftly expanding healthcare sector. The adoption of digital imaging systems and government healthcare initiatives is accelerating market penetration.
  • Innovations in image resolution and real-time imaging technology are enhancing the diagnostic process.

An Overview of Japan Image Intensifier Growth

The market in Japan is projected to grow at a CAGR of 6.4% through 2035.Growth is being driven by the aging population, healthcare modernization, and technological advancements in diagnostic imaging systems.
  • Emerging companies such as Canon Medical Systems and Hitachi Healthcare are investing in advanced image enhancers for medical use. Government policies supporting the adoption of digital health technologies and medical imaging innovations are accelerating growth.
  • The country’s aging population demands efficient diagnostic imaging for early disease detection, driving adoption in hospitals and healthcare facilities.

Leading Image Intensifier Suppliers

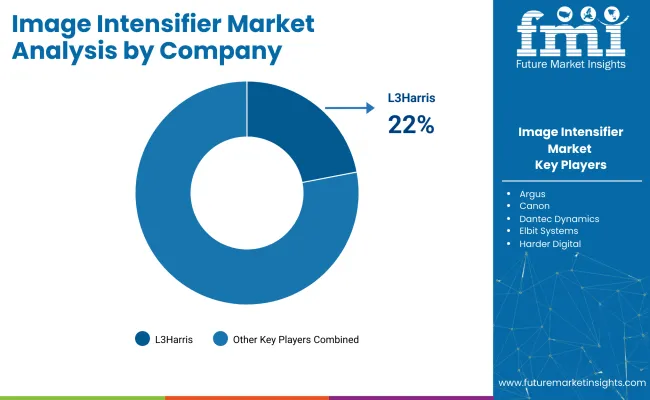
Image Intensifier Market Analysis By Company

The key players such as L3Harris Technologies, Thales Group, Siemens AG, Canon Medical Systems, FLIR Systems (Armasight), and PHOTONIS Technologies SAS dominate the industry through extensive research and development, global distribution networks, and a full range of product offerings. For instance, L3Harris Technologies has introduced next-generation image enhancer tubes with improved sensitivity and resolution.

Rising companies like Alpha Optics Systems Inc., JSC Katod, and Photek Ltd focus on specialized segments and regional leaders. Emerging firms such as TAK Technologies Pvt. Ltd., ProxiVision GmbH, and DEP Technologies, which cater to specific regional needs and offer competitive pricing.

Recent Industry Developments in the Image Intensifier

  • In December 2023, L3HarrisTechnologies introduced next-generation image intensifier tubes with enhanced sensitivity and resolution, addressing the increasing demand for high-performance imaging solutions in defense and medical applications.
  • In October 2024, Exosens signed a definitive agreement to acquire NVLS (NightVision Laser Spain), a specialist in man-portable night vision and thermal devices, aiming to expand Exosens' capabilities in multi-sensor platforms and its presence in Spain, Latin America, and Asia.

Research Coverage and Scope Summary

Report Attributes Details
Current Total Market Size (2025) USD 1.72 billion
Projected Market Size (2035) USD 3.64 billion
CAGR (2025 to 2035) 7.8%
Base Year for Estimation 2024
Historical Period 2020 to 2024
Projections Period 2025 to 2035
Quantitative Units USD billion for value and millions of units
Generation Types Analyzed (Segment 1) Generation I; Generation II; Generation III
Types of Image Intensifiers (Segment 2) Gated image intensifiers; Non-gated image intensifiers; Auto-gated image intensifiers
Diameter Types Analyzed (Segment 3) 18 mm; 18 mm to 25 mm; 25 mm to 37 mm; ≥ 37 mm
Applications Covered (Segment 4) Night vision devices; Goggles; Binoculars; Monoculars; Camera systems; Scientific imaging; X-ray imaging; Others
Regions Covered North America; Europe; Asia-Pacific; Latin America; Middle East & Africa
Countries Covered United States; Canada; Germany; United Kingdom; France; Spain; Italy; Netherlands; China; India; Japan; Australia; South Korea; Brazil; Mexico; Argentina; Saudi Arabia; South Africa; UAE
Key Players Influencing the Industry Argus; L3Harris; Canon; Dantec Dynamics; Elbit Systems; Hamamatsu Photonics; Harder Digital
Additional Attributes Dollar sales by generation type (I, II, III); Product-type revenue share (gated vs non-gated); Growth of military vs medical application segments; Technological advancements in resolution & image quality; Regional patterns in adoption rates for night vision, scientific imaging, and X-ray applications

Leading Players

  • Argus
  • L3Harris
  • Canon
  • Dantec Dynamics
  • Elbit Systems
  • Hamamatsu Photonics
  • Harder Digital

Image Intensifier Market Analyzed by Key Investment Segments

By Generation:

Generation I, Generation II, and Generation III.

By Type:

Gated image intensifiers, non-gated image intensifiers, and auto-gated image intensifiers.

By Diameter:

18 mm, 18 mm to 25 mm, 25 mm to 37 mm, and ≥ 37 mm.

By Application:

Night vision devices (goggles, binoculars, monoculars, camera systems), scientific imaging, X-ray imaging, and other applications.

By Region:

North America, Europe, Asia Pacific, Latin America, and Middle East & Africa.

Table of Content

  1. Executive Summary
    • Global Market Outlook
    • Demand-side Trends
    • Supply-side Trends
    • Technology Roadmap Analysis
    • Analysis and Recommendations
  2. Market Overview
    • Market Coverage / Taxonomy
    • Market Definition / Scope / Limitations
  3. Market Background
    • Market Dynamics
      • Drivers
      • Restraints
      • Opportunity
      • Trends
    • Scenario Forecast
      • Demand in Optimistic Scenario
      • Demand in Likely Scenario
      • Demand in Conservative Scenario
    • Opportunity Map Analysis
    • Product Life Cycle Analysis
    • Supply Chain Analysis
      • Supply Side Participants and their Roles
        • Producers
        • Mid-Level Participants (Traders/ Agents/ Brokers)
        • Wholesalers and Distributors
      • Value Added and Value Created at Node in the Supply Chain
      • List of Raw Material Suppliers
      • List of Existing and Potential Buyer’s
    • Investment Feasibility Matrix
    • Value Chain Analysis
      • Profit Margin Analysis
      • Wholesalers and Distributors
      • Retailers
    • PESTLE and Porter’s Analysis
    • Regulatory Landscape
      • By Key Regions
      • By Key Countries
    • Regional Parent Market Outlook
    • Production and Consumption Statistics
    • Import and Export Statistics
  4. Global Analysis 2020 to 2024 and Forecast, 2025 to 2035
    • Historical Market Size Value (USD Billion) & Volume (Million Unit) Analysis, 2020 to 2024
    • Current and Future Market Size Value (USD Billion) & Volume (Million Unit) Projections, 2025 to 2035
      • Y-o-Y Growth Trend Analysis
      • Absolute $ Opportunity Analysis
  5. Global Pricing Analysis 2020 to 2024 and Forecast 2025 to 2035
  6. Global Analysis 2020 to 2024 and Forecast 2025 to 2035, By Generation
    • Introduction / Key Findings
    • Historical Market Size Value (USD Billion) & Volume (Million Unit) Analysis By Generation, 2020 to 2024
    • Current and Future Market Size Value (USD Billion) & Volume (Million Unit) Analysis and Forecast By Generation, 2025 to 2035
      • Generation I
      • Generation II
      • Generation III
    • Y-o-Y Growth Trend Analysis By Generation, 2020 to 2024
    • Absolute $ Opportunity Analysis By Generation, 2025 to 2035
  7. Global Analysis 2020 to 2024 and Forecast 2025 to 2035, By Type
    • Introduction / Key Findings
    • Historical Market Size Value (USD Billion) & Volume (Million Unit) Analysis By Type, 2020 to 2024
    • Current and Future Market Size Value (USD Billion) & Volume (Million Unit) Analysis and Forecast By Type, 2025 to 2035
      • Gated image intensifiers
      • Non-gated image intensifiers
      • Auto-gated image intensifiers
    • Y-o-Y Growth Trend Analysis By Type, 2020 to 2024
    • Absolute $ Opportunity Analysis By Type, 2025 to 2035
  8. Global Analysis 2020 to 2024 and Forecast 2025 to 2035, By Diameter
    • Introduction / Key Findings
    • Historical Market Size Value (USD Billion) & Volume (Million Unit) Analysis By Diameter, 2020 to 2024
    • Current and Future Market Size Value (USD Billion) & Volume (Million Unit) Analysis and Forecast By Diameter, 2025 to 2035
      • 18 mm
      • 18 mm to 25 mm
      • 25 mm to 37 mm
      • ≥ 37 mm
    • Y-o-Y Growth Trend Analysis By Diameter, 2020 to 2024
    • Absolute $ Opportunity Analysis By Diameter, 2025 to 2035
  9. Global Analysis 2020 to 2024 and Forecast 2025 to 2035, By Application
    • Introduction / Key Findings
    • Historical Market Size Value (USD Billion) & Volume (Million Unit) Analysis By Application, 2020 to 2024
    • Current and Future Market Size Value (USD Billion) & Volume (Million Unit) Analysis and Forecast By Application, 2025 to 2035
      • Night vision devices
        • Goggles
        • Binoculars
        • Monoculars
        • Camera Systems
      • Scientific imaging
      • X-ray imaging
      • Other applications
    • Y-o-Y Growth Trend Analysis By Application, 2020 to 2024
    • Absolute $ Opportunity Analysis By Application, 2025 to 2035
  10. Global Analysis 2020 to 2024 and Forecast 2025 to 2035, By Region
    • Introduction
    • Historical Market Size Value (USD Billion) & Volume (Million Unit) Analysis By Region, 2020 to 2024
    • Current Market Size Value (USD Billion) & Volume (Million Unit) Analysis and Forecast By Region, 2025 to 2035
      • North America
      • Latin America
      • Western Europe
      • Eastern Europe
      • East Asia
      • South Asia & Pacific
      • Middle East and Africa
    • Market Attractiveness Analysis By Region
  11. North America Analysis 2020 to 2024 and Forecast 2025 to 2035, By Country
    • Historical Market Size Value (USD Billion) & Volume (Million Unit) Trend Analysis By Market Taxonomy, 2020 to 2024
    • Market Size Value (USD Billion) & Volume (Million Unit) Forecast By Market Taxonomy, 2025 to 2035
      • By Country
        • USA
        • Canada
        • Mexico
      • By Generation
      • By Type
      • By Diameter
      • By Application
    • Market Attractiveness Analysis
      • By Country
      • By Generation
      • By Type
      • By Diameter
      • By Application
    • Key Takeaways
  12. Latin America Analysis 2020 to 2024 and Forecast 2025 to 2035, By Country
    • Historical Market Size Value (USD Billion) & Volume (Million Unit) Trend Analysis By Market Taxonomy, 2020 to 2024
    • Market Size Value (USD Billion) & Volume (Million Unit) Forecast By Market Taxonomy, 2025 to 2035
      • By Country
        • Brazil
        • Argentina
        • Rest of LATAM
      • By Generation
      • By Type
      • By Diameter
      • By Application
    • Market Attractiveness Analysis
      • By Country
      • By Generation
      • By Type
      • By Diameter
      • By Application
    • Key Takeaways
  13. Western Europe Analysis 2020 to 2024 and Forecast 2025 to 2035, By Country
    • Historical Market Size Value (USD Billion) & Volume (Million Unit) Trend Analysis By Market Taxonomy, 2020 to 2024
    • Market Size Value (USD Billion) & Volume (Million Unit) Forecast By Market Taxonomy, 2025 to 2035
      • By Country
        • Germany
        • Italy
        • France
        • UK
        • Spain
        • BENELUX
        • Nordic
        • Rest of W.Europe
      • By Generation
      • By Type
      • By Diameter
      • By Application
    • Market Attractiveness Analysis
      • By Country
      • By Generation
      • By Type
      • By Diameter
      • By Application
    • Key Takeaways
  14. Eastern Europe Analysis 2020 to 2024 and Forecast 2025 to 2035, By Country
    • Historical Market Size Value (USD Billion) & Volume (Million Unit) Trend Analysis By Market Taxonomy, 2020 to 2024
    • Market Size Value (USD Billion) & Volume (Million Unit) Forecast By Market Taxonomy, 2025 to 2035
      • By Country
        • Russia
        • Hungary
        • Poland
        • Balkan & Baltics
        • Rest of E. Europe
      • By Generation
      • By Type
      • By Diameter
      • By Application
    • Market Attractiveness Analysis
      • By Country
      • By Generation
      • By Type
      • By Diameter
      • By Application
    • Key Takeaways
  15. East Asia Analysis 2020 to 2024 and Forecast 2025 to 2035, By Country
    • Historical Market Size Value (USD Billion) & Volume (Million Unit) Trend Analysis By Market Taxonomy, 2020 to 2024
    • Market Size Value (USD Billion) & Volume (Million Unit) Forecast By Market Taxonomy, 2025 to 2035
      • By Country
        • China
        • Japan
        • South Korea
      • By Generation
      • By Type
      • By Diameter
      • By Application
    • Market Attractiveness Analysis
      • By Country
      • By Generation
      • By Type
      • By Diameter
      • By Application
    • Key Takeaways
  16. South Asia & Pacific Analysis 2020 to 2024 and Forecast 2025 to 2035, By Country
    • Historical Market Size Value (USD Billion) & Volume (Million Unit) Trend Analysis By Market Taxonomy, 2020 to 2024
    • Market Size Value (USD Billion) & Volume (Million Unit) Forecast By Market Taxonomy, 2025 to 2035
      • By Country
        • India
        • Australia & New Zealand
        • ASEAN
        • Rest of SAP
      • By Generation
      • By Type
      • By Diameter
      • By Application
    • Market Attractiveness Analysis
      • By Country
      • By Generation
      • By Type
      • By Diameter
      • By Application
    • Key Takeaways
  17. Middle East and Africa Analysis 2020 to 2024 and Forecast 2025 to 2035, By Country
    • Historical Market Size Value (USD Billion) & Volume (Million Unit) Trend Analysis By Market Taxonomy, 2020 to 2024
    • Market Size Value (USD Billion) & Volume (Million Unit) Forecast By Market Taxonomy, 2025 to 2035
      • By Country
        • GCC Countries
        • Northern Africa
        • South Africa
        • Turkiye
        • Rest of MEA
      • By Generation
      • By Type
      • By Diameter
      • By Application
    • Market Attractiveness Analysis
      • By Country
      • By Generation
      • By Type
      • By Diameter
      • By Application
    • Key Takeaways
  18. Key Countries Analysis
    • USA
      • Pricing Analysis
      • Market Share Analysis, 2024
        • By Generation
        • By Type
        • By Diameter
        • By Application
    • Canada
      • Pricing Analysis
      • Market Share Analysis, 2024
        • By Generation
        • By Type
        • By Diameter
        • By Application
    • Brazil
      • Pricing Analysis
      • Market Share Analysis, 2024
        • By Generation
        • By Type
        • By Diameter
        • By Application
    • Mexico
      • Pricing Analysis
      • Market Share Analysis, 2024
        • By Generation
        • By Type
        • By Diameter
        • By Application
    • Argentina
      • Pricing Analysis
      • Market Share Analysis, 2024
        • By Generation
        • By Type
        • By Diameter
        • By Application
  19. Market Structure Analysis
    • Competition Dashboard
    • Competition Benchmarking
    • Market Share Analysis of Top Players
      • By Regional
      • By Generation
      • By Type
      • By Diameter
      • By Application
  20. Competition Analysis
    • Competition Deep Dive
      • Argus
        • Overview
        • Product Portfolio
        • Profitability by Market Segments (Product/Age /Sales Channel/Region)
        • Sales Footprint
        • Strategy Overview
          • Marketing Strategy
          • Product Strategy
          • Channel Strategy
      • L3Harris
        • Overview
        • Product Portfolio
        • Profitability by Market Segments (Product/Age /Sales Channel/Region)
        • Sales Footprint
        • Strategy Overview
          • Marketing Strategy
          • Product Strategy
          • Channel Strategy
      • Canon
        • Overview
        • Product Portfolio
        • Profitability by Market Segments (Product/Age /Sales Channel/Region)
        • Sales Footprint
        • Strategy Overview
          • Marketing Strategy
          • Product Strategy
          • Channel Strategy
      • Dantec Dynamics
        • Overview
        • Product Portfolio
        • Profitability by Market Segments (Product/Age /Sales Channel/Region)
        • Sales Footprint
        • Strategy Overview
          • Marketing Strategy
          • Product Strategy
          • Channel Strategy
      • Elbit Systems
        • Overview
        • Product Portfolio
        • Profitability by Market Segments (Product/Age /Sales Channel/Region)
        • Sales Footprint
        • Strategy Overview
          • Marketing Strategy
          • Product Strategy
          • Channel Strategy
      • Hamamatsu Photonics
        • Overview
        • Product Portfolio
        • Profitability by Market Segments (Product/Age /Sales Channel/Region)
        • Sales Footprint
        • Strategy Overview
          • Marketing Strategy
          • Product Strategy
          • Channel Strategy
      • Harder Digital
        • Overview
        • Product Portfolio
        • Profitability by Market Segments (Product/Age /Sales Channel/Region)
        • Sales Footprint
        • Strategy Overview
          • Marketing Strategy
          • Product Strategy
          • Channel Strategy
  21. Assumptions & Acronyms Used
  22. Research Methodology

List of Tables

  • Table 1: Global Value (USD Billion) Forecast by Region, 2020 to 2035
  • Table 2: Global Volume (Million Unit) Forecast by Region, 2020 to 2035
  • Table 3: Global Value (USD Billion) Forecast by Generation, 2020 to 2035
  • Table 4: Global Volume (Million Unit) Forecast by Generation, 2020 to 2035
  • Table 5: Global Value (USD Billion) Forecast by Type, 2020 to 2035
  • Table 6: Global Volume (Million Unit) Forecast by Type, 2020 to 2035
  • Table 7: Global Value (USD Billion) Forecast by Diameter, 2020 to 2035
  • Table 8: Global Volume (Million Unit) Forecast by Diameter, 2020 to 2035
  • Table 9: Global Value (USD Billion) Forecast by Application, 2020 to 2035
  • Table 10: Global Volume (Million Unit) Forecast by Application, 2020 to 2035
  • Table 11: North America Value (USD Billion) Forecast by Country, 2020 to 2035
  • Table 12: North America Volume (Million Unit) Forecast by Country, 2020 to 2035
  • Table 13: North America Value (USD Billion) Forecast by Generation, 2020 to 2035
  • Table 14: North America Volume (Million Unit) Forecast by Generation, 2020 to 2035
  • Table 15: North America Value (USD Billion) Forecast by Type, 2020 to 2035
  • Table 16: North America Volume (Million Unit) Forecast by Type, 2020 to 2035
  • Table 17: North America Value (USD Billion) Forecast by Diameter, 2020 to 2035
  • Table 18: North America Volume (Million Unit) Forecast by Diameter, 2020 to 2035
  • Table 19: North America Value (USD Billion) Forecast by Application, 2020 to 2035
  • Table 20: North America Volume (Million Unit) Forecast by Application, 2020 to 2035
  • Table 21: Latin America Value (USD Billion) Forecast by Country, 2020 to 2035
  • Table 22: Latin America Volume (Million Unit) Forecast by Country, 2020 to 2035
  • Table 23: Latin America Value (USD Billion) Forecast by Generation, 2020 to 2035
  • Table 24: Latin America Volume (Million Unit) Forecast by Generation, 2020 to 2035
  • Table 25: Latin America Value (USD Billion) Forecast by Type, 2020 to 2035
  • Table 26: Latin America Volume (Million Unit) Forecast by Type, 2020 to 2035
  • Table 27: Latin America Value (USD Billion) Forecast by Diameter, 2020 to 2035
  • Table 28: Latin America Volume (Million Unit) Forecast by Diameter, 2020 to 2035
  • Table 29: Latin America Value (USD Billion) Forecast by Application, 2020 to 2035
  • Table 30: Latin America Volume (Million Unit) Forecast by Application, 2020 to 2035
  • Table 31: Western Europe Value (USD Billion) Forecast by Country, 2020 to 2035
  • Table 32: Western Europe Volume (Million Unit) Forecast by Country, 2020 to 2035
  • Table 33: Western Europe Value (USD Billion) Forecast by Generation, 2020 to 2035
  • Table 34: Western Europe Volume (Million Unit) Forecast by Generation, 2020 to 2035
  • Table 35: Western Europe Value (USD Billion) Forecast by Type, 2020 to 2035
  • Table 36: Western Europe Volume (Million Unit) Forecast by Type, 2020 to 2035
  • Table 37: Western Europe Value (USD Billion) Forecast by Diameter, 2020 to 2035
  • Table 38: Western Europe Volume (Million Unit) Forecast by Diameter, 2020 to 2035
  • Table 39: Western Europe Value (USD Billion) Forecast by Application, 2020 to 2035
  • Table 40: Western Europe Volume (Million Unit) Forecast by Application, 2020 to 2035
  • Table 41: Eastern Europe Value (USD Billion) Forecast by Country, 2020 to 2035
  • Table 42: Eastern Europe Volume (Million Unit) Forecast by Country, 2020 to 2035
  • Table 43: Eastern Europe Value (USD Billion) Forecast by Generation, 2020 to 2035
  • Table 44: Eastern Europe Volume (Million Unit) Forecast by Generation, 2020 to 2035
  • Table 45: Eastern Europe Value (USD Billion) Forecast by Type, 2020 to 2035
  • Table 46: Eastern Europe Volume (Million Unit) Forecast by Type, 2020 to 2035
  • Table 47: Eastern Europe Value (USD Billion) Forecast by Diameter, 2020 to 2035
  • Table 48: Eastern Europe Volume (Million Unit) Forecast by Diameter, 2020 to 2035
  • Table 49: Eastern Europe Value (USD Billion) Forecast by Application, 2020 to 2035
  • Table 50: Eastern Europe Volume (Million Unit) Forecast by Application, 2020 to 2035
  • Table 51: East Asia Value (USD Billion) Forecast by Country, 2020 to 2035
  • Table 52: East Asia Volume (Million Unit) Forecast by Country, 2020 to 2035
  • Table 53: East Asia Value (USD Billion) Forecast by Generation, 2020 to 2035
  • Table 54: East Asia Volume (Million Unit) Forecast by Generation, 2020 to 2035
  • Table 55: East Asia Value (USD Billion) Forecast by Type, 2020 to 2035
  • Table 56: East Asia Volume (Million Unit) Forecast by Type, 2020 to 2035
  • Table 57: East Asia Value (USD Billion) Forecast by Diameter, 2020 to 2035
  • Table 58: East Asia Volume (Million Unit) Forecast by Diameter, 2020 to 2035
  • Table 59: East Asia Value (USD Billion) Forecast by Application, 2020 to 2035
  • Table 60: East Asia Volume (Million Unit) Forecast by Application, 2020 to 2035
  • Table 61: South Asia & Pacific Value (USD Billion) Forecast by Country, 2020 to 2035
  • Table 62: South Asia & Pacific Volume (Million Unit) Forecast by Country, 2020 to 2035
  • Table 63: South Asia & Pacific Value (USD Billion) Forecast by Generation, 2020 to 2035
  • Table 64: South Asia & Pacific Volume (Million Unit) Forecast by Generation, 2020 to 2035
  • Table 65: South Asia & Pacific Value (USD Billion) Forecast by Type, 2020 to 2035
  • Table 66: South Asia & Pacific Volume (Million Unit) Forecast by Type, 2020 to 2035
  • Table 67: South Asia & Pacific Value (USD Billion) Forecast by Diameter, 2020 to 2035
  • Table 68: South Asia & Pacific Volume (Million Unit) Forecast by Diameter, 2020 to 2035
  • Table 69: South Asia & Pacific Value (USD Billion) Forecast by Application, 2020 to 2035
  • Table 70: South Asia & Pacific Volume (Million Unit) Forecast by Application, 2020 to 2035
  • Table 71: Middle East and Africa Value (USD Billion) Forecast by Country, 2020 to 2035
  • Table 72: Middle East and Africa Volume (Million Unit) Forecast by Country, 2020 to 2035
  • Table 73: Middle East and Africa Value (USD Billion) Forecast by Generation, 2020 to 2035
  • Table 74: Middle East and Africa Volume (Million Unit) Forecast by Generation, 2020 to 2035
  • Table 75: Middle East and Africa Value (USD Billion) Forecast by Type, 2020 to 2035
  • Table 76: Middle East and Africa Volume (Million Unit) Forecast by Type, 2020 to 2035
  • Table 77: Middle East and Africa Value (USD Billion) Forecast by Diameter, 2020 to 2035
  • Table 78: Middle East and Africa Volume (Million Unit) Forecast by Diameter, 2020 to 2035
  • Table 79: Middle East and Africa Value (USD Billion) Forecast by Application, 2020 to 2035
  • Table 80: Middle East and Africa Volume (Million Unit) Forecast by Application, 2020 to 2035

List of Figures

  • Figure 1: Global Volume (Million Unit) Forecast 2020 to 2035
  • Figure 2: Global Pricing Analysis
  • Figure 3: Global Value (USD Billion) Forecast 2020 to 2035
  • Figure 4: Global Value Share and BPS Analysis by Generation, 2025 and 2035
  • Figure 5: Global Y-o-Y Growth Comparison by Generation, 2025 to 2035
  • Figure 6: Global Attractiveness Analysis by Generation
  • Figure 7: Global Value Share and BPS Analysis by Type, 2025 and 2035
  • Figure 8: Global Y-o-Y Growth Comparison by Type, 2025 to 2035
  • Figure 9: Global Attractiveness Analysis by Type
  • Figure 10: Global Value Share and BPS Analysis by Diameter, 2025 and 2035
  • Figure 11: Global Y-o-Y Growth Comparison by Diameter, 2025 to 2035
  • Figure 12: Global Attractiveness Analysis by Diameter
  • Figure 13: Global Value Share and BPS Analysis by Application, 2025 and 2035
  • Figure 14: Global Y-o-Y Growth Comparison by Application, 2025 to 2035
  • Figure 15: Global Attractiveness Analysis by Application
  • Figure 16: Global Value (USD Billion) Share and BPS Analysis by Region, 2025 and 2035
  • Figure 17: Global Y-o-Y Growth Comparison by Region, 2025 to 2035
  • Figure 18: Global Attractiveness Analysis by Region
  • Figure 19: North America Incremental $ Opportunity, 2025 to 2035
  • Figure 20: Latin America Incremental $ Opportunity, 2025 to 2035
  • Figure 21: Western Europe Incremental $ Opportunity, 2025 to 2035
  • Figure 22: Eastern Europe Incremental $ Opportunity, 2025 to 2035
  • Figure 23: East Asia Incremental $ Opportunity, 2025 to 2035
  • Figure 24: South Asia & Pacific Incremental $ Opportunity, 2025 to 2035
  • Figure 25: Middle East and Africa Incremental $ Opportunity, 2025 to 2035
  • Figure 26: North America Value Share and BPS Analysis by Country, 2025 and 2035
  • Figure 27: North America Value Share and BPS Analysis by Generation, 2025 and 2035
  • Figure 28: North America Y-o-Y Growth Comparison by Generation, 2025 to 2035
  • Figure 29: North America Attractiveness Analysis by Generation
  • Figure 30: North America Value Share and BPS Analysis by Type, 2025 and 2035
  • Figure 31: North America Y-o-Y Growth Comparison by Type, 2025 to 2035
  • Figure 32: North America Attractiveness Analysis by Type
  • Figure 33: North America Value Share and BPS Analysis by Diameter, 2025 and 2035
  • Figure 34: North America Y-o-Y Growth Comparison by Diameter, 2025 to 2035
  • Figure 35: North America Attractiveness Analysis by Diameter
  • Figure 36: North America Value Share and BPS Analysis by Application, 2025 and 2035
  • Figure 37: North America Y-o-Y Growth Comparison by Application, 2025 to 2035
  • Figure 38: North America Attractiveness Analysis by Application
  • Figure 39: Latin America Value Share and BPS Analysis by Country, 2025 and 2035
  • Figure 40: Latin America Value Share and BPS Analysis by Generation, 2025 and 2035
  • Figure 41: Latin America Y-o-Y Growth Comparison by Generation, 2025 to 2035
  • Figure 42: Latin America Attractiveness Analysis by Generation
  • Figure 43: Latin America Value Share and BPS Analysis by Type, 2025 and 2035
  • Figure 44: Latin America Y-o-Y Growth Comparison by Type, 2025 to 2035
  • Figure 45: Latin America Attractiveness Analysis by Type
  • Figure 46: Latin America Value Share and BPS Analysis by Diameter, 2025 and 2035
  • Figure 47: Latin America Y-o-Y Growth Comparison by Diameter, 2025 to 2035
  • Figure 48: Latin America Attractiveness Analysis by Diameter
  • Figure 49: Latin America Value Share and BPS Analysis by Application, 2025 and 2035
  • Figure 50: Latin America Y-o-Y Growth Comparison by Application, 2025 to 2035
  • Figure 51: Latin America Attractiveness Analysis by Application
  • Figure 52: Western Europe Value Share and BPS Analysis by Country, 2025 and 2035
  • Figure 53: Western Europe Value Share and BPS Analysis by Generation, 2025 and 2035
  • Figure 54: Western Europe Y-o-Y Growth Comparison by Generation, 2025 to 2035
  • Figure 55: Western Europe Attractiveness Analysis by Generation
  • Figure 56: Western Europe Value Share and BPS Analysis by Type, 2025 and 2035
  • Figure 57: Western Europe Y-o-Y Growth Comparison by Type, 2025 to 2035
  • Figure 58: Western Europe Attractiveness Analysis by Type
  • Figure 59: Western Europe Value Share and BPS Analysis by Diameter, 2025 and 2035
  • Figure 60: Western Europe Y-o-Y Growth Comparison by Diameter, 2025 to 2035
  • Figure 61: Western Europe Attractiveness Analysis by Diameter
  • Figure 62: Western Europe Value Share and BPS Analysis by Application, 2025 and 2035
  • Figure 63: Western Europe Y-o-Y Growth Comparison by Application, 2025 to 2035
  • Figure 64: Western Europe Attractiveness Analysis by Application
  • Figure 65: Eastern Europe Value Share and BPS Analysis by Country, 2025 and 2035
  • Figure 66: Eastern Europe Value Share and BPS Analysis by Generation, 2025 and 2035
  • Figure 67: Eastern Europe Y-o-Y Growth Comparison by Generation, 2025 to 2035
  • Figure 68: Eastern Europe Attractiveness Analysis by Generation
  • Figure 69: Eastern Europe Value Share and BPS Analysis by Type, 2025 and 2035
  • Figure 70: Eastern Europe Y-o-Y Growth Comparison by Type, 2025 to 2035
  • Figure 71: Eastern Europe Attractiveness Analysis by Type
  • Figure 72: Eastern Europe Value Share and BPS Analysis by Diameter, 2025 and 2035
  • Figure 73: Eastern Europe Y-o-Y Growth Comparison by Diameter, 2025 to 2035
  • Figure 74: Eastern Europe Attractiveness Analysis by Diameter
  • Figure 75: Eastern Europe Value Share and BPS Analysis by Application, 2025 and 2035
  • Figure 76: Eastern Europe Y-o-Y Growth Comparison by Application, 2025 to 2035
  • Figure 77: Eastern Europe Attractiveness Analysis by Application
  • Figure 78: East Asia Value Share and BPS Analysis by Country, 2025 and 2035
  • Figure 79: East Asia Value Share and BPS Analysis by Generation, 2025 and 2035
  • Figure 80: East Asia Y-o-Y Growth Comparison by Generation, 2025 to 2035
  • Figure 81: East Asia Attractiveness Analysis by Generation
  • Figure 82: East Asia Value Share and BPS Analysis by Type, 2025 and 2035
  • Figure 83: East Asia Y-o-Y Growth Comparison by Type, 2025 to 2035
  • Figure 84: East Asia Attractiveness Analysis by Type
  • Figure 85: East Asia Value Share and BPS Analysis by Diameter, 2025 and 2035
  • Figure 86: East Asia Y-o-Y Growth Comparison by Diameter, 2025 to 2035
  • Figure 87: East Asia Attractiveness Analysis by Diameter
  • Figure 88: East Asia Value Share and BPS Analysis by Application, 2025 and 2035
  • Figure 89: East Asia Y-o-Y Growth Comparison by Application, 2025 to 2035
  • Figure 90: East Asia Attractiveness Analysis by Application
  • Figure 91: South Asia & Pacific Value Share and BPS Analysis by Country, 2025 and 2035
  • Figure 92: South Asia & Pacific Value Share and BPS Analysis by Generation, 2025 and 2035
  • Figure 93: South Asia & Pacific Y-o-Y Growth Comparison by Generation, 2025 to 2035
  • Figure 94: South Asia & Pacific Attractiveness Analysis by Generation
  • Figure 95: South Asia & Pacific Value Share and BPS Analysis by Type, 2025 and 2035
  • Figure 96: South Asia & Pacific Y-o-Y Growth Comparison by Type, 2025 to 2035
  • Figure 97: South Asia & Pacific Attractiveness Analysis by Type
  • Figure 98: South Asia & Pacific Value Share and BPS Analysis by Diameter, 2025 and 2035
  • Figure 99: South Asia & Pacific Y-o-Y Growth Comparison by Diameter, 2025 to 2035
  • Figure 100: South Asia & Pacific Attractiveness Analysis by Diameter
  • Figure 101: South Asia & Pacific Value Share and BPS Analysis by Application, 2025 and 2035
  • Figure 102: South Asia & Pacific Y-o-Y Growth Comparison by Application, 2025 to 2035
  • Figure 103: South Asia & Pacific Attractiveness Analysis by Application
  • Figure 104: Middle East and Africa Value Share and BPS Analysis by Country, 2025 and 2035
  • Figure 105: Middle East and Africa Value Share and BPS Analysis by Generation, 2025 and 2035
  • Figure 106: Middle East and Africa Y-o-Y Growth Comparison by Generation, 2025 to 2035
  • Figure 107: Middle East and Africa Attractiveness Analysis by Generation
  • Figure 108: Middle East and Africa Value Share and BPS Analysis by Type, 2025 and 2035
  • Figure 109: Middle East and Africa Y-o-Y Growth Comparison by Type, 2025 to 2035
  • Figure 110: Middle East and Africa Attractiveness Analysis by Type
  • Figure 111: Middle East and Africa Value Share and BPS Analysis by Diameter, 2025 and 2035
  • Figure 112: Middle East and Africa Y-o-Y Growth Comparison by Diameter, 2025 to 2035
  • Figure 113: Middle East and Africa Attractiveness Analysis by Diameter
  • Figure 114: Middle East and Africa Value Share and BPS Analysis by Application, 2025 and 2035
  • Figure 115: Middle East and Africa Y-o-Y Growth Comparison by Application, 2025 to 2035
  • Figure 116: Middle East and Africa Attractiveness Analysis by Application
  • Figure 117: Global - Tier Structure Analysis
  • Figure 118: Global - Company Share Analysis

Frequently Asked Questions

What is the projected size of the image intensifier industry by 2035?

The industry is expected to reach USD 3.64 billion by 2035.

What is the estimated industry size of the image intensifier industry in 2025?

The industry is projected to be valued at USD 1.72 billion in 2025.

What is the CAGR of the image intensifier industry from 2025 to 2035?

The industry is projected to grow at a CAGR of 7.8% from 2025 to 2035.

Which generation of image intensifiers is expected to dominate the industry in 2025?

Generation III are projected to dominate the industry with a 45% share in 2025.

Which country is expected to exhibit the fastest growth in the image intensifier industry?

India is expected to be the fastest-growing country, with a projected CAGR of 10.65%.

Explore Similar Insights

Future Market Insights

Image Intensifier Market