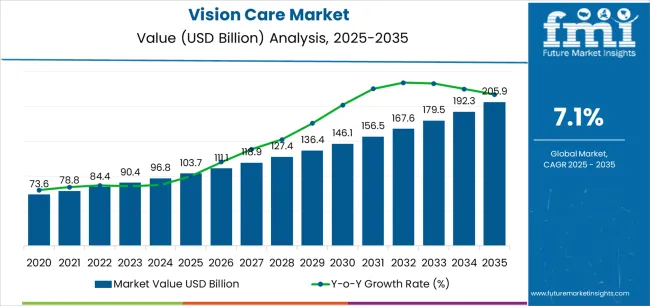
The global vision care market is projected to grow from USD 103.7 billion in 2025 to approximately USD 205.9 billion by 2035, recording an absolute increase of USD 102.2 billion over the forecast period. This translates into a total growth of 98.6%, with the market forecast to expand at a CAGR of 7.1% between 2025 and 2035. The market size is expected to grow by nearly 2.0X during the same period, supported by increasing global demand for vision correction solutions, growing adoption of advanced optical technologies in eye care, and rising screen time exposure driving comprehensive vision care procurement across various demographic segments.
| Metric | Value |
|---|---|
| Market Value (2025) | USD 103.7 billion |
| Market Forecast Value (2035) | USD 205.9 billion |
| Forecast CAGR (2025-2035) | 7.1% |
| DIGITAL LIFESTYLE TRENDS | AGING DEMOGRAPHICS & HEALTH AWARENESS | TECHNOLOGICAL INNOVATION & ACCESSIBILITY |
|---|---|---|
| Digital Eye Strain Epidemic Continuous expansion of screen time across established and emerging markets driving demand for vision correction and protection solutions. Youth Myopia Prevalence Growing emphasis on childhood myopia management and early vision correction creating demand for advanced optical products. Work-From-Home Impact Superior vision comfort requirements and extended digital device usage making vision care essential for modern lifestyle adaptation. | Sophisticated Vision Requirements Modern lifestyles require optical solutions delivering precise vision correction and enhanced visual comfort across multiple viewing distances. Quality of Life Demands Consumers investing in premium vision care products offering consistent visual performance while maintaining aesthetic preferences. Healthcare Access Standards Expanding eye care infrastructure and insurance coverage required for comprehensive vision health management. | Vision Correction Standards Regulatory and professional requirements establishing performance benchmarks favoring high-quality optical solutions. Optical Performance Standards Quality standards requiring superior visual acuity and resistance to optical aberrations in corrective products. Consumer Safety Requirements Diverse vision correction requirements and safety standards driving need for sophisticated optical product development. |
| Category | Segments Covered |
|---|---|
| By Product Type | Spectacle Lenses, Contact Lenses, Cleaning & Disinfecting Solutions |
| By Distribution Channel | Hospitals, Ophthalmic Clinics, Optometry Stores, E-Commerce, Retail Hypermarket/Superstore |
| By Region | North America, Europe, Asia Pacific, Latin America, Middle East & Africa |

| Segment | 2025 to 2035 Outlook |
|---|---|
| Spectacle Lenses | Leader in 2025 with 52.8% market share; likely to maintain leadership through 2035. Broadest use across prescription eyewear, reading glasses, and protective eyewear applications with mature supply chain and predictable optical characteristics. Dominant across all age groups with universal acceptance and accessibility. Essential for presbyopia management, myopia correction, and astigmatism treatment. Momentum: steady-to-strong growth driven by aging demographics, increasing myopia prevalence, and progressive lens adoption. Watchouts: competition from contact lenses in younger demographics and refractive surgery alternatives reducing dependence on corrective eyewear. |
| Contact Lenses | Growing segment with 31.5% share, offering advantages in unobstructed vision, aesthetic preferences, and active lifestyle compatibility. Preferred by younger demographics and users prioritizing cosmetic considerations or sports participation. Strong growth in daily disposable formats improving convenience and hygiene. Momentum: rising strongly through 2030 driven by daily disposable adoption, colored cosmetic lenses, and myopia control specialty lenses. Watchouts: compliance challenges with proper lens care, discomfort limiting long-term wear, and dry eye syndrome prevalence affecting suitability. |
| Cleaning & Disinfecting Solutions | Essential ancillary segment with 15.7% share, critical for contact lens hygiene and spectacle maintenance. Recurring revenue stream with consistent repurchase patterns from lens wearers. Momentum: moderate growth tied to contact lens adoption rates and multi-purpose solution convenience. Watchouts: daily disposable lens growth reducing cleaning product necessity and private label competition pressuring branded product margins. |

| Segment | 2025 to 2035 Outlook |
|---|---|
| Optometry Stores | Leading channel with 38.4% share in 2025, characterized by professional eye examinations, personalized fitting services, and comprehensive product selection. Core traditional distribution model combining clinical services with product dispensing. Strong consumer trust and prescription verification advantages. Momentum: steady growth supported by aging demographics requiring professional consultations and premium product positioning. Watchouts: e-commerce competition for repurchase transactions and retail chain consolidation pressuring independent optometry practices. |
| E-Commerce | Fastest-growing channel with 24.7% share, disrupting traditional models through convenience, competitive pricing, and direct-to-consumer strategies. Particularly strong for contact lens repurchases, reading glasses, and standardized prescription eyewear. Technology enabling virtual try-on and prescription verification reducing barriers. Momentum: strongest growth trajectory through 2032 driven by digital-native consumers, subscription models, and improved logistics. Watchouts: prescription verification requirements, fit and comfort uncertainties, and regulatory restrictions in certain markets. |
| Ophthalmic Clinics | Professional channel with 18.9% share, focused on medical eye care with product dispensing as secondary offering. Strong in markets with integrated healthcare models and medical necessity products including therapeutic lenses. Momentum: moderate growth concentrated in emerging markets expanding eye care infrastructure and specialty lens categories requiring clinical oversight. Watchouts: separation of clinical services from product sales in some markets and limited product range versus dedicated optical retailers. |
| Retail Hypermarket/Superstore | Accessible channel with 11.2% share, emphasizing convenience for non-prescription products including reading glasses, sunglasses, and basic eye care solutions. Low-cost positioning serving price-sensitive consumers. Momentum: steady but limited growth as product mix focused on commodity items with lower margins. Watchouts: limited professional services reducing prescription eyewear capture and quality perception challenges versus specialty optical retailers. |
| Hospitals | Specialized channel with 6.8% share, serving post-surgical patients, complex prescriptions, and medical device categories including specialty contact lenses. Important for therapeutic applications and patients with ocular pathologies. Momentum: selective growth in specialty products including post-refractive surgery lenses and disease management applications. Watchouts: limited volume potential versus community-based channels and primary focus on medical treatment rather than routine vision correction. |
| DRIVERS | RESTRAINTS | KEY TRENDS |
|---|---|---|
| Digital Device Proliferation Continuing expansion of screen time across established and emerging markets driving demand for vision correction and blue light protection solutions. Myopia Epidemic Recognition Increasing recognition of childhood myopia prevalence importance in long-term vision health and quality of life outcomes. Aging Demographics Growing demand for vision correction solutions that support both near and distance vision requirements in aging populations requiring presbyopia management. | Refractive Surgery Competition LASIK and advanced surgical alternatives reducing long-term dependence on corrective eyewear in certain demographics. Economic Sensitivity Vision care discretionary spending vulnerability affecting premium product adoption during economic downturns. Insurance Coverage Limitations Varying vision insurance penetration across markets affecting product affordability and upgrade frequency. Compliance Challenges Contact lens care non-compliance and improper usage patterns influencing safety outcomes and category reputation. | Smart Eyewear Integration of digital displays, augmented reality, and health monitoring capabilities enabling connected vision solutions. Myopia Control Innovation Enhanced specialized contact lenses, orthokeratology, and pharmaceutical interventions providing childhood myopia progression management. Sustainable Product Development of eco-friendly lens materials, recyclable packaging, and circular economy programs providing environmental performance improvements. Personalized Optical Solutions Integration of advanced diagnostics, customized lens designs, and precision manufacturing for individualized vision optimization. |
| Country | CAGR (2025-2035) |
|---|---|
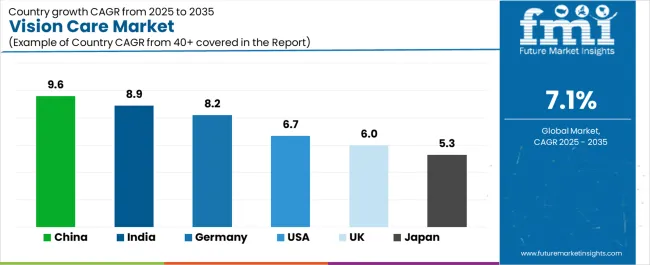
| China | 9.6% |
| India | 8.9% |
| Germany | 8.2% |
| United States | 6.7% |
| United Kingdom | 6.0% |
| Japan | 5.3% |
Revenue from vision care in China is projected to exhibit strong growth with a CAGR of 9.6% through 2035, driven by expanding myopia prevalence among youth populations and comprehensive vision health awareness campaigns creating substantial opportunities for vision care suppliers across optical retail operations, contact lens distribution, and specialty eye care sectors. The country's rapidly growing middle class and increasing healthcare consciousness are creating significant demand for both corrective eyewear and preventive vision care solutions. Major optical retail chains and international eye care companies are establishing comprehensive distribution networks to support large-scale consumer demand and meet growing requirements for advanced vision correction solutions.
Revenue from vision care in India is expanding with a CAGR of 8.9% through 2035, supported by extensive unmet vision correction needs and comprehensive optical retail infrastructure development creating sustained demand for affordable vision care products across diverse demographic categories and emerging middle-class segments. The country's large population with significant uncorrected refractive errors and expanding disposable income are driving demand for vision care solutions that provide reliable optical performance while supporting cost-effective accessibility requirements. Vision care companies and optical retail chains are investing in tier-2 and tier-3 city expansion to support growing consumer awareness and vision correction adoption.
Demand for vision care in Germany is projected to grow with a CAGR of 8.2% through 2035, supported by the country's leadership in optical engineering excellence and advanced lens technologies requiring sophisticated vision correction systems for progressive lenses and specialty optical applications. German optical companies are producing world-class lens designs that support advanced visual performance, aesthetic preferences, and comprehensive quality protocols. The market is characterized by focus on engineering precision, personalized fitting services, and compliance with stringent optical quality and safety standards.
Revenue from vision care in the United States is growing with a CAGR of 6.7% through 2035, driven by comprehensive vision insurance coverage and increasing optical retail consolidation creating sustained opportunities for vision care suppliers serving both traditional optical stores and emerging online direct-to-consumer channels. The country's extensive vision care infrastructure and evolving retail landscape are creating demand for vision correction products that support diverse consumer preferences while maintaining accessibility standards. Optical retailers and e-commerce platforms are developing omnichannel strategies to support consumer convenience and competitive positioning.
Demand for vision care in United Kingdom is projected to reach USD 12.4 billion by 2035, expanding at a CAGR of 6.0%, driven by NHS optical benefits and high-street optical chain capabilities supporting accessible vision care and comprehensive eye examination programs. The country's established optical retail infrastructure and universal eye care access are creating demand for vision correction products that support both NHS-funded basic eyewear and private-pay premium upgrades. Optical chains and independent optometrists are maintaining comprehensive service capabilities to support diverse consumer requirements.
Demand for vision care in the United Kingdom is projected to grow with a CAGR of 6.0% through 2035, driven by NHS optical benefits and high-street optical chain capabilities supporting accessible vision care and comprehensive eye examination programs. The country's established optical retail infrastructure and universal eye care access are creating demand for vision correction products that support both NHS-funded basic eyewear and private-pay premium upgrades. Optical chains and independent optometrists are maintaining comprehensive service capabilities to support diverse consumer requirements.
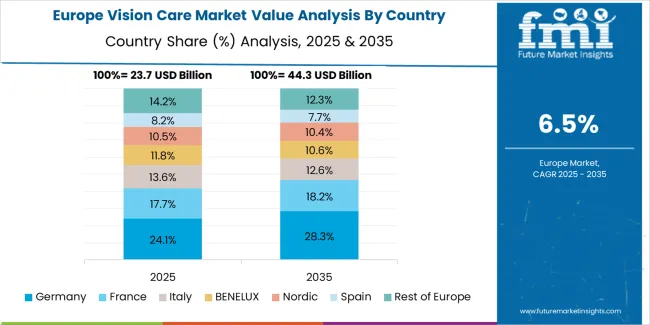
The vision care market in Europe is projected to grow from USD 8.5 billion in 2025 to USD 16.8 billion by 2035, registering a CAGR of 7.1% over the forecast period. Germany is expected to maintain its leadership position with a 26.3% market share in 2025, supported by its advanced optical engineering capabilities and comprehensive vision care infrastructure across major metropolitan areas including Berlin, Munich, and Hamburg regions.
France follows with a 21.7% share in 2025, projected to reach 22.1% by 2035, driven by comprehensive vision insurance coverage through the social security system and strong optical retail presence. Italy holds an 18.9% share in 2025, expected to reach 19.3% by 2035 due to fashion eyewear leadership and designer frame market strength. United Kingdom commands a 17.8% share, while Spain accounts for 15.3% in 2025. The Rest of Europe region is anticipated to maintain steady momentum, attributed to increasing vision care adoption in Nordic countries and emerging Eastern European markets implementing optical retail expansion programs.
European vision care operations are increasingly defined by the contrast between Western European premium optical markets and emerging Eastern European accessibility-focused development. German, French, and Italian optical industries dominate premium lens technology and designer eyewear, leveraging centuries of optical engineering expertise and fashion brand integration that command price premiums in global markets. German manufacturers maintain leadership in progressive lens design and precision manufacturing, with major optical groups and independent optometrists driving technical specifications for advanced vision correction solutions.
Southern European markets in Italy and Spain emphasize fashion-forward eyewear positioning, with global luxury brands headquartered in Milan and partnerships between optical companies and fashion houses creating differentiation through design and brand prestige. This fashion-optical integration supports premium pricing and frequent frame replacement cycles driven by style preferences rather than purely functional needs.
Eastern European optical markets in Poland, Czech Republic, and Romania demonstrate rapid growth as disposable income increases and vision care awareness expands. International optical retail chains are establishing presence in major cities while local independent optometrists serve community markets. Price sensitivity remains higher than Western Europe, favoring value-oriented products and basic lens technologies, though premiumization trends are emerging in urban markets.
The regulatory environment shapes market dynamics. EU medical device regulations establish quality and safety standards for contact lenses and corrective lenses, creating compliance barriers but ensuring consumer protection. Varying vision insurance coverage across member states affects market structure, with France's comprehensive reimbursement system supporting frequent eyewear replacement versus markets with limited coverage driving longer replacement cycles.
Consolidation continues as global optical conglomerates acquire regional chains and lens manufacturers to expand geographic coverage and integrate supply chains. Independent optometry remains strong in many markets, maintaining professional trust relationships and personalized service as competitive advantages versus chain retailers.
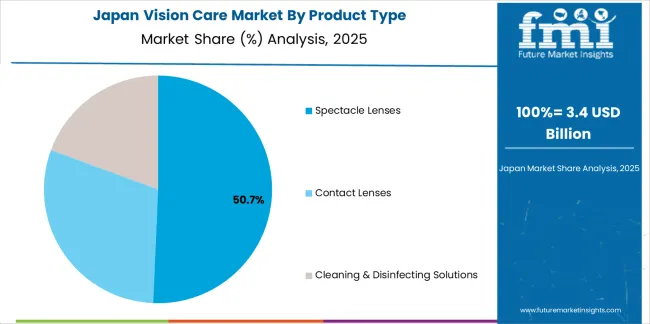
Japanese vision care operations reflect the country's aging demographics and sophisticated optical technology expectations. Major optical retailers including JINS, Zoff, and Paris Miki maintain extensive retail networks with high-frequency locations in urban centers, emphasizing convenience, rapid service, and affordable pricing compared to traditional optometry models. This fast-fashion approach to eyewear disrupted traditional market structures and accelerated frame replacement cycles.
The Japanese market demonstrates unique preferences for lightweight, titanium-framed eyewear and ultra-thin lens materials reflecting aesthetic values and comfort priorities. Companies require precise fitting services and meticulous quality control that exceed Western standards, driving demand for skilled opticians and advanced lens surfacing capabilities. Blue light filtering lens coatings achieved early mass-market adoption in Japan due to extensive smartphone and computer usage patterns.
Regulatory oversight through the Ministry of Health, Labour and Welfare establishes comprehensive standards for vision correction devices and optometry practice. The certification system for opticians and optometrists maintains professional standards while retail formats increasingly integrate rapid vision screening technologies enabling convenient prescription verification and quick service.
Supply chain dynamics emphasize domestic lens manufacturing from major Japanese optical companies including Hoya, Nikon, and Seiko Optical, maintaining quality control and rapid turnaround times. Contact lens market maturity reflects high penetration rates among younger demographics with daily disposable formats dominant due to hygiene consciousness and convenience preferences.
The market faces saturation challenges in mature demographics with high eyewear ownership rates, driving growth strategies toward replacement cycle acceleration through fashion positioning and technology upgrades including progressive lens adoption among aging consumers and specialty lens categories including orthokeratology for myopia control.
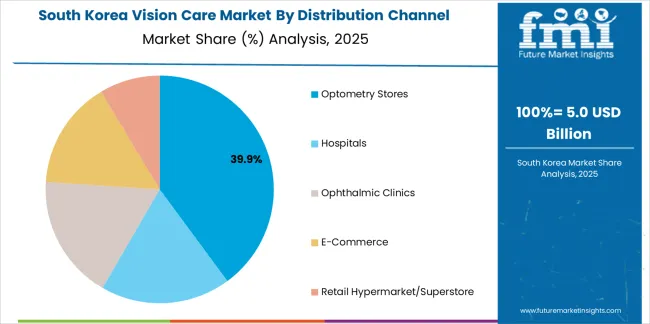
South Korean vision care operations reflect the country's technology-forward culture and aesthetic-conscious consumer base. Major optical retail chains and international brands compete intensely in fashion-driven metropolitan markets where eyewear serves both functional and style statement purposes. K-pop celebrity endorsements and rapid fashion trend cycles accelerate frame replacement patterns exceeding functional necessity.
The Korean market demonstrates particular strength in colored contact lenses for cosmetic enhancement, with circle lenses enlarging iris appearance achieving widespread adoption among younger female consumers. This cosmetic lens category represents significant market value despite limited vision correction necessity, driven by beauty standards and social media influence.
Regulatory frameworks through the Korean Food and Drug Administration classify contact lenses as medical devices requiring prescription authorization and safety standards enforcement. Recent regulatory actions against unauthorized online lens sales and counterfeit products reflect government attention to consumer safety amid e-commerce growth in vision care products.
Supply chain infrastructure emphasizes imported contact lenses from international manufacturers supplemented by domestic production of spectacle lenses and frames. Korean optical retail chains increasingly pursue omnichannel strategies integrating physical stores with e-commerce platforms and mobile apps for convenient reordering and virtual try-on capabilities.
The market faces challenges from LASIK surgery widespread adoption reducing corrective eyewear dependence among young adults and intense price competition in commoditized product categories pressuring margins. Aging demographics driving presbyopia management needs and myopia prevalence sustaining youth market demand continue to support market growth and premiumization opportunities in specialty lens categories.
Profit pools are consolidating around vertically-integrated optical groups combining lens manufacturing, frame brands, retail distribution, and vision insurance with established consumer relationships and omnichannel capabilities. Value is migrating from traditional optical retail toward integrated platforms where eyewear subscriptions, digital try-on technologies, and personalized lens design command recurring revenue and higher margins. Several archetypes set the pace: global optical conglomerates defending share through vertical integration and brand portfolio depth; specialized lens manufacturers with proprietary technologies and patent portfolios; disruptive direct-to-consumer brands leveraging e-commerce and social media; and traditional optical retail chains adapting omnichannel strategies. Switching costs-prescription requirements, personalized fitting preferences, brand loyalty-stabilize customer relationships for incumbents, while digital disruption and direct-to-consumer models reopen market share opportunities for agile challengers. Consolidation continues as optical giants acquire emerging brands and regional chains while technology platforms and virtual try-on capabilities become competitive necessities. Do now: secure integrated supply chain capabilities from lens manufacturing through retail distribution with omnichannel fulfillment; hard-wire digital try-on technology and virtual prescription verification; option: develop subscription models with personalized lens design and co-branded fashion partnerships.
| Stakeholder Type | Primary Advantage | Repeatable Plays |
|---|---|---|
| Global optical conglomerates | Vertical integration, brand portfolio, retail scale | Multi-brand strategy, supply chain control, vision insurance partnerships |
| Specialized lens manufacturers | Proprietary technology, patent portfolios, optical innovation | Licensing agreements, OEM partnerships, premium positioning |
| Direct-to-consumer disruptors | E-commerce efficiency, brand agility, price disruption | Digital marketing, influencer partnerships, virtual try-on technology |
| Traditional optical retail chains | Professional services, consumer trust, omnichannel presence | Loyalty programs, insurance network participation, service differentiation |
| Contact lens specialists | Subscription models, recurring revenue, customer data | Direct-to-consumer subscriptions, telemedicine integration, personalized recommendations |
| Items | Values |
|---|---|
| Quantitative Units | USD 103.7 billion |
| Product Type | Spectacle Lenses, Contact Lenses, Cleaning & Disinfecting Solutions |
| Distribution Channel | Hospitals, Ophthalmic Clinics, Optometry Stores, E-Commerce, Retail Hypermarket/Superstore |
| Application | Myopia Correction, Presbyopia Management, Astigmatism Treatment, Cosmetic Enhancement, Others |
| Regions Covered | North America, Latin America, Europe, Asia Pacific, Middle East & Africa |
| Country Covered | United States, Germany, United Kingdom, China, India, Japan, and other 40+ countries |
| Key Companies Profiled | Bausch and Lomb, LUXOTTICA GROUP, Essilor, ZEISS International, Johnson & Johnson Vision Care, CooperVision, Alcon, Hoya Corporation, Rodenstock, Fielmann AG |
| Additional Attributes | Dollar sales by product type/distribution channel/application, regional demand (NA, EU, APAC), competitive landscape, online vs. offline channel adoption, myopia control innovation integration, and digital technology innovations driving personalized vision correction, omnichannel retail experience, and preventive eye care development |
By Product Type
The global vision care market is estimated to be valued at USD 103.7 billion in 2025.
The market size for the vision care market is projected to reach USD 205.9 billion by 2035.
The vision care market is expected to grow at a 7.1% CAGR between 2025 and 2035.
The key product types in vision care market are spectacle lenses, contact lenses and cleaning & disinfecting solutions.
In terms of distribution channel, optometry stores segment to command 38.4% share in the vision care market in 2025.


Our Research Products

The "Full Research Suite" delivers actionable market intel, deep dives on markets or technologies, so clients act faster, cut risk, and unlock growth.

The Leaderboard benchmarks and ranks top vendors, classifying them as Established Leaders, Leading Challengers, or Disruptors & Challengers.

Locates where complements amplify value and substitutes erode it, forecasting net impact by horizon

We deliver granular, decision-grade intel: market sizing, 5-year forecasts, pricing, adoption, usage, revenue, and operational KPIs—plus competitor tracking, regulation, and value chains—across 60 countries broadly.

Spot the shifts before they hit your P&L. We track inflection points, adoption curves, pricing moves, and ecosystem plays to show where demand is heading, why it is changing, and what to do next across high-growth markets and disruptive tech

Real-time reads of user behavior. We track shifting priorities, perceptions of today’s and next-gen services, and provider experience, then pace how fast tech moves from trial to adoption, blending buyer, consumer, and channel inputs with social signals (#WhySwitch, #UX).

Partner with our analyst team to build a custom report designed around your business priorities. From analysing market trends to assessing competitors or crafting bespoke datasets, we tailor insights to your needs.
Supplier Intelligence
Discovery & Profiling
Capacity & Footprint
Performance & Risk
Compliance & Governance
Commercial Readiness
Who Supplies Whom
Scorecards & Shortlists
Playbooks & Docs
Category Intelligence
Definition & Scope
Demand & Use Cases
Cost Drivers
Market Structure
Supply Chain Map
Trade & Policy
Operating Norms
Deliverables
Buyer Intelligence
Account Basics
Spend & Scope
Procurement Model
Vendor Requirements
Terms & Policies
Entry Strategy
Pain Points & Triggers
Outputs
Pricing Analysis
Benchmarks
Trends
Should-Cost
Indexation
Landed Cost
Commercial Terms
Deliverables
Brand Analysis
Positioning & Value Prop
Share & Presence
Customer Evidence
Go-to-Market
Digital & Reputation
Compliance & Trust
KPIs & Gaps
Outputs
Full Research Suite comprises of:
Market outlook & trends analysis
Interviews & case studies
Strategic recommendations
Vendor profiles & capabilities analysis
5-year forecasts
8 regions and 60+ country-level data splits
Market segment data splits
12 months of continuous data updates
DELIVERED AS:
PDF EXCEL ONLINE
Demand for Vision Care in Japan Size and Share Forecast Outlook 2025 to 2035
Demand for Vision Care in USA Size and Share Forecast Outlook 2025 to 2035
Healthcare AI Computer Vision Market Size and Share Forecast Outlook 2025 to 2035
Computer Vision in Healthcare Market Size and Share Forecast Outlook 2025 to 2035
North America Vision Care Market Growth - Trends & Forecast 2025 to 2035
Vision Screener Market Size and Share Forecast Outlook 2025 to 2035
Vision Guided Robots Market - Trends & Forecast 2025 to 2035
Vision Sensor Market by Type, Application, End user and Region through 2035
Revision Knee Replacement Market Size and Share Forecast Outlook 2025 to 2035
Suncare Products Market Size and Share Forecast Outlook 2025 to 2035
PCB Vision Inspection Equipment for SMT Market Size and Share Forecast Outlook 2025 to 2035
Skincare Supplement Market Size and Share Forecast Outlook 2025 to 2035
Skincare Oil Market Size and Share Forecast Outlook 2025 to 2035
Lip Care Market Analysis - Size and Share Forecast Outlook 2025 to 2035
Skincare Nutritional Serum Market Size and Share Forecast Outlook 2025 to 2035
Haircare Supplement Market - Size, Share, and Forecast Outlook 2025 to 2035
Skincare Products Market Size and Share Forecast Outlook 2025 to 2035
Lip Care Packaging Market Size and Share Forecast Outlook 2025 to 2035
Skincare Market Analysis - Size, Share, and Forecast Outlook 2025 to 2035
Sun Care Products Market Analysis – Growth, Applications & Outlook 2025–2035

Thank you!
You will receive an email from our Business Development Manager. Please be sure to check your SPAM/JUNK folder too.
Chat With
MaRIA