Lignans Market Outlook (2022-2032)

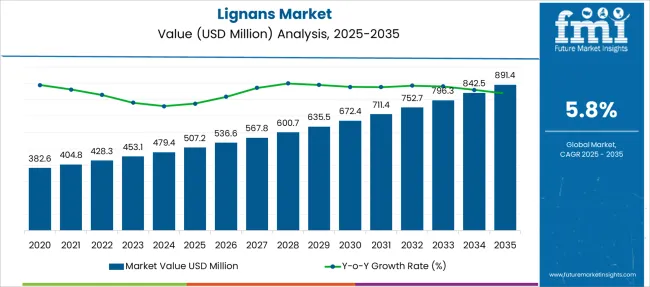
[300 Pages Report] The lignans market size exceeded US$ 428.3 Million in 2022 and is estimated to grow at over 5.8% CAGR between 2022 and 2032, reaching a valuation of US$ 676.7 Million by 2032. Rising application of lignans in food & beverages, animal nutrition, pharmaceuticals, and cosmetics is driving growth in the global lignans market.

Attributes Key Statistics
Lignans Market Estimated Size (2022E) US$ 428.3 Million
Projected Market Valuation (2032F) US$ 676.7 Million
Value CAGR (2022 to 2032) 5.8%

Lignans are low molecular weight polyphenols found in plants, particularly, seeds, whole grains, and vegetables. They exhibit steroid like chemical structure and are thus regraded as phytoestrogens.

Over the years, lignans has gained immense traction owing to their various health benefits including lowered risk of heart disease and protection against osteoporosis and cancer.

They are being increasingly used in pharmaceuticals, animal feeds, foods, beverages, and cosmetics. Thus, rising production and consumption of these products will eventually expand the global lignans market size during the forecast period.

Don't pay for what you don't need

Customize your report by selecting specific countries or regions and save 30%!

2017-2021 Lignans Demand Outlook Compared to 2022-2032 Forecast

The global demand for lignans is anticipated to rise at a CAGR of 5.8% between 2022 and 2032, in comparison to 5.2% CAGR registered from 2017 to 2021. Growing demand for lignans from industries like pharmaceuticals, cosmetics & personal care, and food & beverages is a key factor spurring growth in lignans market.

In recent years, lignans have become highly popular across the world due to their attributes which include anti-microbial, immunosuppressive, antiviral, anti-inflammatory, anti-cancer, anti-oxidant properties. These attributes offered by lignans are expanding the application of the product in various industries including cosmetics, food, pharmaceuticals, and animal feed which is, therefore, augmenting the sales of lignans globally.

Aside from that, due to the dangers posed by synthetic compounds, consumers are shifting preferences toward bio-based products, which in turn is expanding the lignin market size.

It is believed that consumption of lignans improves prostate, ovarian and uterine health, improves digestion, enhances hair health, and decreases sugar levels.

Lignans Market

How is the Rising Cancer Cases Boosting the Demand for Lignans?

According to market trends, rising prevalence of various types of cancer and increased global awareness of cancer prevention activities aimed at reducing disease-related mortality rate are expected to drive demand for lignans.

The implementation of supportive government efforts, such as the India Ministry of Women and Child Development's "Health Awareness Programs to spread awareness of cervical and breast cancer," are encouraging the adoption of cancer treatment in the region. Due to the presence of phytoestrogen, which has potential anti-cancer characteristics, lignans are becoming ideal ingredients used in cancer therapies. Driven by this, demand for lignans is slated to rise at a healthy pace during the forecast period.

Similarly, growing inclinations towards using natural chemicals in anticancer medicines will create lucrative opportunities for lignans manufacturers in the future.
Nandini Roy Choudhury

Principal Consultant

Talk to Analyst

Find your sweet spots for generating winning opportunities in this market.

Country-wise Insights

How is the U.S. Lignans Market Shaping?

Implementation of Stringent Regulations Pertaining to Food and Pharmaceutical Products Favoring Growth in Lignans Market

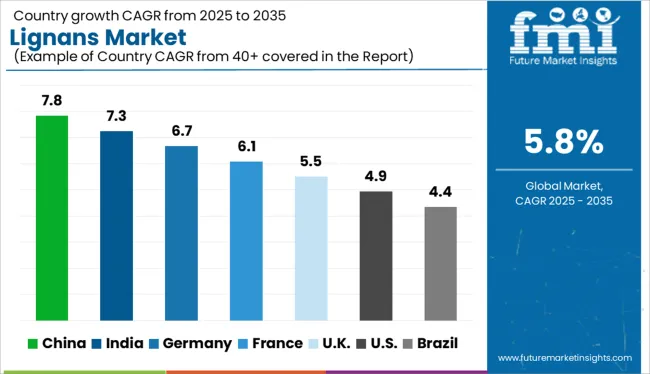
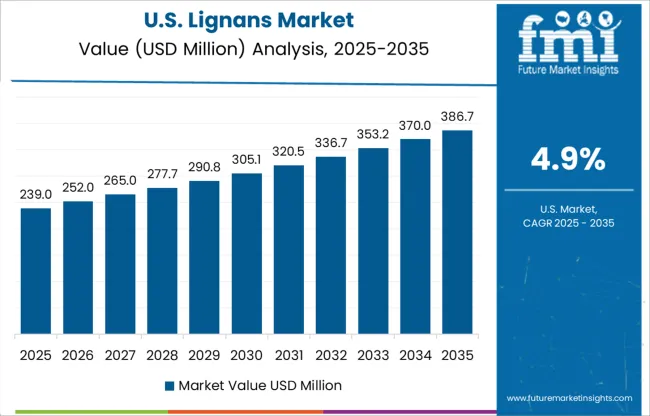
The lignans market in the U.S. is expected to grow at a significant rate during the forecast period, owing to the rising consumer spending on food and pharmaceutical products, surge in cancer cases, and heavy presence of leading pharmaceutical giants.

Implementation of strict government regulations across the U.S. has resulted in higher-quality manufacturing, which in turn is creating a conducive environment for lignans market growth. This product (lignans) has been designated as Generally Recognized as Safe (GRAS) by the US Food and Drug Administration, and there are no objections to its use in food processing.

Manufacturing industries based in the U.S. are increasingly adopting lignans to develop high-quality goods that strictly adhere to rules, lowering compliance costs, and increasing firm profitability.
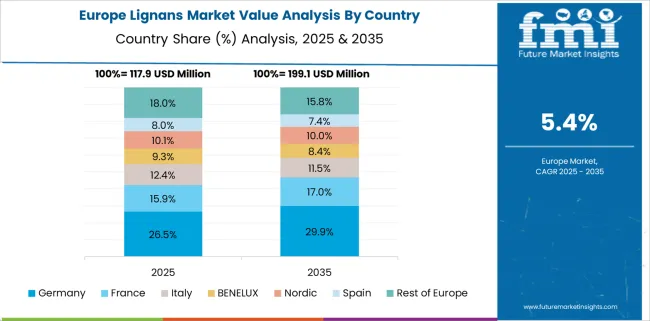
Why is Germany Considered as a Leading Lignans Consumer of Europe?

Growing Demand for Plant-based Therapies to Push Lignans Sales in Germany

German consumers feel that plant-based therapies have fewer negative effects than synthetic drugs; Hence, they prefer to use herbal medicines instead of synthetic drugs. This is playing a key role in pushing the demand for lignans in the country.

Similarly, rising health and fitness consciousness, changing lifestyle, and increasing consumption of oral dietary supplements is expected to boost the growth of lignans market in Germany during the forecast period.

How Will Growth Unfold in the India Lignans Market?

Growing Awareness About Health Benefits of Lignans Stimulating Growth in the India Lignans Market

As per FMI, lignans market in India is poised to exhibit strong growth during the forecast period, owing to the growing awareness among people about the health benefits of lignans, increase in the number of lignans manufacturing companies, surge in consumer spending, rising prevalence of cardiovascular disease as a result of poor lifestyle.

A large portion of Indian population consumes lignan based products to prevent the acquisition of various diseases, promote health, and enhance immunity. Lignans aid in the decrease of cholesterol, blood pressure, and blood sugar levels, which is pushing up the Indian lignans market.

Category-wise Insights

Which is the Most Preferred Source in Lignans Market?

Lignans Derived from Cereals to Remain Highly Sought-After Among End Users

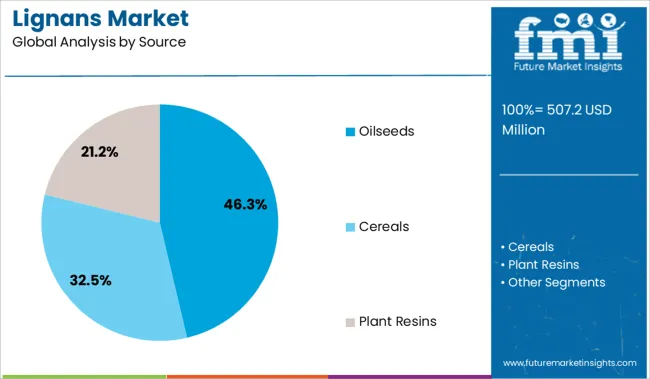
As per FMI, cereals segment leads the global lignans market and is likely to grow at a relatively higher CAGR during the forecast period, lowing to the rising end user preference for cereal based lignans.

Lignans derived from cereals have higher anti-inflammatory, antioxidant, and hormone mimicking effects in humans. As a result, both consumers and manufacturers use cereals based lignans.

Growing adoption of cereal derived lignans due to their possible estrogenic, antioxidant, anticarcinogenic, and antiestrogenic properties will therefore continue to stimulate the growth of cereals segment in the coming years.

Which is the Most Lucrative Application in Lignans Market?

Food & Beverage to Contribute Highest in Lignans Market

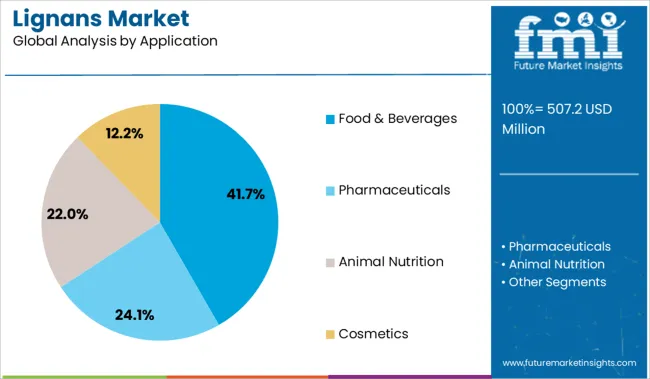
Based on application, food & beverages segment currently accounts for the largest share of the global lignans market and the trend is likely to continue during the forthcoming period, owing to the rising usage of lignans in food and beverage industry.

Lignans are commonly found in foods such as whole-grain breads, snack foods, pasta, energy bars, cereals, crackers, and meatless meal products. Increasing usage of lignans in these food products along with rising consumer spending on these products will therefore contribute towards the growth of this segment.

Plant lignans, found in high-fiber meals, are the forerunners of mammalian lignans, which have been linked to a lower risk of heart disease and cancer. As a result, the aforementioned elements boost the application of lignans in the food and beverage industries.
Get the data you need at a Fraction of the cost

Personalize your report by choosing insights you need
and save 40%!

Competitive Landscape

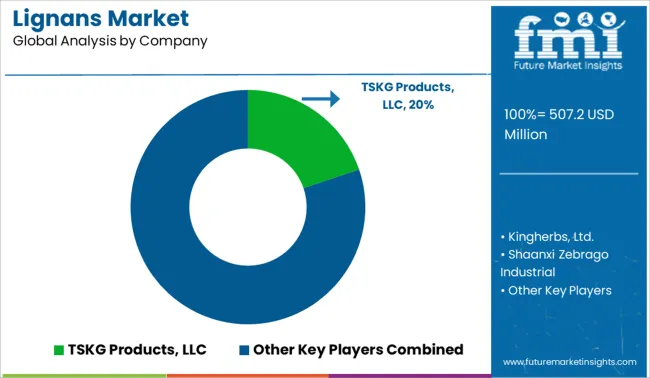
To strengthen their position and distribution channels globally, key players are pursuing a variety of strategies, including mergers and acquisitions. Furthermore, numerous firms are working on new product launches and development in order to expand their capacity as well as to increase their customer base.

Companies that make functional foods and beverages with lignan content are focusing on releasing new products and solutions while cutting their R&D costs significantly. They are also focusing on systematic ways to reinforce long-term contracts, invest/divest, launch marketing campaigns with care, and monitor lignan market developments on a regular basis.

Scope of the Report

Attributes Details
Estimated Market Size (2022) US$ 428.3 Million
Projected Market valuation (2032) US$ 676.7 Million
Anticipated CAGR (2022 to 2032) 5.8%
Forecast Period 2022 to 2032
Historical Data Available for 2017 to 2021
Market Analysis US$ Million for Value and MT for Volume
Key Regions Covered North America; Latin America; Europe; Asia Pacific; Oceania; and MEA
Key Countries Covered USA, Canada, Mexico, Germany, UK, France, Italy, Spain, China, Japan, India, South Korea, Australia, Brazil, Argentina, South Africa, and UAE
Key Segments Covered Source, Application and Region
Key Companies Profiled TSKG Products, LLC; Kingherbs, Ltd.; Shaanxi Zebrago Industrial; BioGin Biochemicals; FarmaSino Pharmaceuticals; Plamed Green Science Group; SPI Pharma; Xi'an Sinuotebio Tech; ADM; Arjuna Natural Pvt Ltd; Others
Report Coverage Market Forecast, Company Share Analysis, Competition Intelligence, DROT Analysis, Market Dynamics and Challenges, and Strategic Growth Initiatives

Lignans Market by Category

By Source, Lignans Market is Segmented as:

  • Cereals
  • Oilseeds
  • Plant Resins

By Application, Lignans Market is Segmented as:

  • Food & Beverages
  • Pharmaceuticals
  • Animal Nutrition
    • Horses
    • Ruminants
  • Cosmetics
    • Hair care
    • Toiletries
    • Skin Care

By Region, Lignans Market is Segmented as:

  • North America
  • Latin America
  • Europe
  • Asia Pacific
  • MEA

Frequently Asked Questions

How Big is the Lignans Market?

The lignans market currently stands at nearly US$ 428.3 Mn in 2022 and is expected to rise at a CAGR of 5.8% during the forecast period.

What is the North America Lignans Market Outlook?

The North American lignans market is expected to register a 5.2% CAGR between 2022 and 2032.

At What Rate will Lignans Demand Grow in the Asia Pacific?

The demand for lignans in the Asia Pacific is expected to grow at 5.7% CAGR between 2022 and 2032.

What Are the Key Trends Shaping Lignans Market?

Rising consumer inclination toward a healthy diet as a result of increasing incidence of lifestyle diseases such as diabetes, high blood pressure, and obesity around the world are driving growth in the global lignans market.

Table of Content
1. Executive Summary
    1.1. Global Market Outlook
    1.2. Demand-side Trends
    1.3. Supply-side Trends
    1.4. Technology Roadmap Analysis
    1.5. Analysis and Recommendations
2. Market Overview
    2.1. Market Coverage / Taxonomy
    2.2. Market Definition / Scope / Limitations
3. Market Background
    3.1. Market Dynamics
        3.1.1. Drivers
        3.1.2. Restraints
        3.1.3. Opportunity
        3.1.4. Trends
    3.2. Scenario Forecast
        3.2.1. Demand in Optimistic Scenario
        3.2.2. Demand in Likely Scenario
        3.2.3. Demand in Conservative Scenario
    3.3. Product launches & Recent Developments
    3.4. Product Life Cycle Analysis
    3.5. Value Chain Analysis
        3.5.1. Supply Side Participants and their Roles
            3.5.1.1. Producers
            3.5.1.2. Mid-Level Participants (Traders/ Agents/ Brokers)
            3.5.1.3. Wholesalers and Distributors
        3.5.2. % of Operating Margin Analysis
        3.5.3. List of Raw Material Suppliers
        3.5.4. List of Existing and Potential Buyer’s
    3.6. Global Market - Pricing Analysis
        3.6.1. Price Point Assessment by Region
        3.6.2. Price Point Assessment by Source
        3.6.3. Price Forecast till 2032
        3.6.4. Factors affecting pricing
    3.7. Forecast Factors - Relevance & Impact
    3.8. Regulatory Landscape
        3.8.1. Packaging & Labelling Regulations
        3.8.2. Certifications and Certifying Agency Overview
        3.8.3. Import/Export Policies
    3.9. Production and Consumption Statistics
    3.10. Import and Export Statistics
    3.11. Macro-Economic Factors
    3.12. Product Claims & Nutritional Information Scan by Buyers
4. Global Market Analysis 2017-2021 and Forecast, 2022-2032
    4.1. Historical Market Size Value (US$ Mn) & Volume (MT) Analysis, 2017-2021
    4.2. Current and Future Market Size Value (US$ Mn) & Volume (MT) Projections, 2022-2032
        4.2.1. Y-o-Y Growth Trend Analysis
        4.2.2. Absolute $ Opportunity Analysis
5. Global Market Analysis 2017-2021 and Forecast 2022-2032, By Source
    5.1. Introduction / Key Findings
    5.2. Historical Market Size Value (US$ Mn) & Volume (MT) Analysis By Source, 2017-2021
    5.3. Current and Future Market Size Value (US$ Mn) & Volume (MT) Analysis and Forecast By Source, 2022-2032
        5.3.1. Cereals
        5.3.2. Oilseeds
        5.3.3. Plant Resins
    5.4. Y-o-Y Growth Trend Analysis By Source, 2017-2021
    5.5. Absolute $ Opportunity Analysis By Source, 2022-2032
6. Global Market Analysis 2017-2021 and Forecast 2022-2032, By Application
    6.1. Introduction / Key Findings
    6.2. Historical Market Size Value (US$ Mn) & Volume (MT) Analysis By Application, 2017-2021
    6.3. Current and Future Market Size Value (US$ Mn) & Volume (MT) Analysis and Forecast By Application, 2022-2032
        6.3.1. Food & Beverages
        6.3.2. Pharmaceuticals
        6.3.3. Animal Nutrition
            6.3.3.1. Horses
            6.3.3.2. Ruminants
        6.3.4. Cosmetics
            6.3.4.1. Hair Care
            6.3.4.2. Toiletries
            6.3.4.3. Skin Care
    6.4. Y-o-Y Growth Trend Analysis By Application, 2017-2021
    6.5. Absolute $ Opportunity Analysis By Application, 2022-2032
7. Global Market Analysis 2017-2021 and Forecast 2022-2032, By Region
    7.1. Introduction
    7.2. Historical Market Size Value (US$ Mn) & Volume (MT) Analysis By Region, 2017-2021
    7.3. Current Market Size Value (US$ Mn) & Volume (MT) Analysis and Forecast By Region, 2022-2032
        7.3.1. North America
        7.3.2. Latin America
        7.3.3. Europe
        7.3.4. East Asia
        7.3.5. South Asia
        7.3.6. Oceania
        7.3.7. MEA
    7.4. Market Attractiveness Analysis By Region
8. North America Market Analysis 2017-2021 and Forecast 2022-2032, By Country
    8.1. Historical Market Size Value (US$ Mn) & Volume (MT) Trend Analysis By Market Taxonomy, 2017-2021
    8.2. Market Size Value (US$ Mn) & Volume (MT) Forecast By Market Taxonomy, 2022-2032
        8.2.1. By Country
            8.2.1.1. U.S.
            8.2.1.2. Canada
        8.2.2. By Source
        8.2.3. By Application
    8.3. Market Attractiveness Analysis
        8.3.1. By Country
        8.3.2. By Source
        8.3.3. By Application
    8.4. Key Takeaways
9. Latin America Market Analysis 2017-2021 and Forecast 2022-2032, By Country
    9.1. Historical Market Size Value (US$ Mn) & Volume (MT) Trend Analysis By Market Taxonomy, 2017-2021
    9.2. Market Size Value (US$ Mn) & Volume (MT) Forecast By Market Taxonomy, 2022-2032
        9.2.1. By Country
            9.2.1.1. Brazil
            9.2.1.2. Mexico
            9.2.1.3. Argentina
            9.2.1.4. Chile
            9.2.1.5. Peru
            9.2.1.6. Rest of Latin America
        9.2.2. By Source
        9.2.3. By Application
    9.3. Market Attractiveness Analysis
        9.3.1. By Country
        9.3.2. By Source
        9.3.3. By Application
    9.4. Key Takeaways
10. Europe Market Analysis 2017-2021 and Forecast 2022-2032, By Country
    10.1. Historical Market Size Value (US$ Mn) & Volume (MT) Trend Analysis By Market Taxonomy, 2017-2021
    10.2. Market Size Value (US$ Mn) & Volume (MT) Forecast By Market Taxonomy, 2022-2032
        10.2.1. By Country
            10.2.1.1. Germany
            10.2.1.2. Italy
            10.2.1.3. France
            10.2.1.4. U.K.
            10.2.1.5. Spain
            10.2.1.6. Russia
            10.2.1.7. BENELUX
            10.2.1.8. Poland
            10.2.1.9. Nordic Countries
            10.2.1.10. Rest of Europe
        10.2.2. By Source
        10.2.3. By Application
    10.3. Market Attractiveness Analysis
        10.3.1. By Country
        10.3.2. By Source
        10.3.3. By Application
    10.4. Key Takeaways
11. East Asia Market Analysis 2017-2021 and Forecast 2022-2032, By Country
    11.1. Historical Market Size Value (US$ Mn) & Volume (MT) Trend Analysis By Market Taxonomy, 2017-2021
    11.2. Market Size Value (US$ Mn) & Volume (MT) Forecast By Market Taxonomy, 2022-2032
        11.2.1. By Country
            11.2.1.1. China
            11.2.1.2. Japan
            11.2.1.3. South Korea
        11.2.2. By Source
        11.2.3. By Application
    11.3. Market Attractiveness Analysis
        11.3.1. By Country
        11.3.2. By Source
        11.3.3. By Application
    11.4. Key Takeaways
12. South Asia Market Analysis 2017-2021 and Forecast 2022-2032, By Country
    12.1. Historical Market Size Value (US$ Mn) & Volume (MT) Trend Analysis By Market Taxonomy, 2017-2021
    12.2. Market Size Value (US$ Mn) & Volume (MT) Forecast By Market Taxonomy, 2022-2032
        12.2.1. By Country
            12.2.1.1. India
            12.2.1.2. Thailand
            12.2.1.3. Malaysia
            12.2.1.4. Indonesia
            12.2.1.5. Singapore
            12.2.1.6. Rest of South Asia
        12.2.2. By Source
        12.2.3. By Application
    12.3. Market Attractiveness Analysis
        12.3.1. By Country
        12.3.2. By Source
        12.3.3. By Application
    12.4. Key Takeaways
13. Oceania Market Analysis 2017-2021 and Forecast 2022-2032, By Country
    13.1. Historical Market Size Value (US$ Mn) & Volume (MT) Trend Analysis By Market Taxonomy, 2017-2021
    13.2. Market Size Value (US$ Mn) & Volume (MT) Forecast By Market Taxonomy, 2022-2032
        13.2.1. By Country
            13.2.1.1. Australia
            13.2.1.2. New Zealand
        13.2.2. By Source
        13.2.3. By Application
    13.3. Market Attractiveness Analysis
        13.3.1. By Country
        13.3.2. By Source
        13.3.3. By Application
    13.4. Key Takeaways
14. MEA Market Analysis 2017-2021 and Forecast 2022-2032, By Country
    14.1. Historical Market Size Value (US$ Mn) & Volume (MT) Trend Analysis By Market Taxonomy, 2017-2021
    14.2. Market Size Value (US$ Mn) & Volume (MT) Forecast By Market Taxonomy, 2022-2032
        14.2.1. By Country
            14.2.1.1. GCC Countries
            14.2.1.2. South Africa
            14.2.1.3. Central Africa
            14.2.1.4. North Africa
        14.2.2. By Source
        14.2.3. By Application
    14.3. Market Attractiveness Analysis
        14.3.1. By Country
        14.3.2. By Source
        14.3.3. By Application
    14.4. Key Takeaways
15. Key Countries Market Analysis
    15.1. U.S.
        15.1.1. Pricing Analysis
        15.1.2. Market Share Analysis, 2021
            15.1.2.1. By Source
            15.1.2.2. By Application
    15.2. Canada
        15.2.1. Pricing Analysis
        15.2.2. Market Share Analysis, 2021
            15.2.2.1. By Source
            15.2.2.2. By Application
    15.3. Brazil
        15.3.1. Pricing Analysis
        15.3.2. Market Share Analysis, 2021
            15.3.2.1. By Source
            15.3.2.2. By Application
    15.4. Mexico
        15.4.1. Pricing Analysis
        15.4.2. Market Share Analysis, 2021
            15.4.2.1. By Source
            15.4.2.2. By Application
    15.5. Argentina
        15.5.1. Pricing Analysis
        15.5.2. Market Share Analysis, 2021
            15.5.2.1. By Source
            15.5.2.2. By Application
    15.6. Chile
        15.6.1. Pricing Analysis
        15.6.2. Market Share Analysis, 2021
            15.6.2.1. By Source
            15.6.2.2. By Application
    15.7. Peru
        15.7.1. Pricing Analysis
        15.7.2. Market Share Analysis, 2021
            15.7.2.1. By Source
            15.7.2.2. By Application
    15.8. Germany
        15.8.1. Pricing Analysis
        15.8.2. Market Share Analysis, 2021
            15.8.2.1. By Source
            15.8.2.2. By Application
    15.9. Italy
        15.9.1. Pricing Analysis
        15.9.2. Market Share Analysis, 2021
            15.9.2.1. By Source
            15.9.2.2. By Application
    15.10. France
        15.10.1. Pricing Analysis
        15.10.2. Market Share Analysis, 2021
            15.10.2.1. By Source
            15.10.2.2. By Application
    15.11. Spain
        15.11.1. Pricing Analysis
        15.11.2. Market Share Analysis, 2021
            15.11.2.1. By Source
            15.11.2.2. By Application
    15.12. U.K.
        15.12.1. Pricing Analysis
        15.12.2. Market Share Analysis, 2021
            15.12.2.1. By Source
            15.12.2.2. By Application
    15.13. Russia
        15.13.1. Pricing Analysis
        15.13.2. Market Share Analysis, 2021
            15.13.2.1. By Source
            15.13.2.2. By Application
    15.14. Poland
        15.14.1. Pricing Analysis
        15.14.2. Market Share Analysis, 2021
            15.14.2.1. By Source
            15.14.2.2. By Application
    15.15. BENELUX
        15.15.1. Pricing Analysis
        15.15.2. Market Share Analysis, 2021
            15.15.2.1. By Source
            15.15.2.2. By Application
    15.16. Nordic Countries
        15.16.1. Pricing Analysis
        15.16.2. Market Share Analysis, 2021
            15.16.2.1. By Source
            15.16.2.2. By Application
    15.17. China
        15.17.1. Pricing Analysis
        15.17.2. Market Share Analysis, 2021
            15.17.2.1. By Source
            15.17.2.2. By Application
    15.18. Japan
        15.18.1. Pricing Analysis
        15.18.2. Market Share Analysis, 2021
            15.18.2.1. By Source
            15.18.2.2. By Application
    15.19. South Korea
        15.19.1. Pricing Analysis
        15.19.2. Market Share Analysis, 2021
            15.19.2.1. By Source
            15.19.2.2. By Application
    15.20. India
        15.20.1. Pricing Analysis
        15.20.2. Market Share Analysis, 2021
            15.20.2.1. By Source
            15.20.2.2. By Application
    15.21. Thailand
        15.21.1. Pricing Analysis
        15.21.2. Market Share Analysis, 2021
            15.21.2.1. By Source
            15.21.2.2. By Application
    15.22. Indonesia
        15.22.1. Pricing Analysis
        15.22.2. Market Share Analysis, 2021
            15.22.2.1. By Source
            15.22.2.2. By Application
    15.23. Malaysia
        15.23.1. Pricing Analysis
        15.23.2. Market Share Analysis, 2021
            15.23.2.1. By Source
            15.23.2.2. By Application
    15.24. Singapore
        15.24.1. Pricing Analysis
        15.24.2. Market Share Analysis, 2021
            15.24.2.1. By Source
            15.24.2.2. By Application
    15.25. Australia
        15.25.1. Pricing Analysis
        15.25.2. Market Share Analysis, 2021
            15.25.2.1. By Source
            15.25.2.2. By Application
    15.26. New Zealand
        15.26.1. Pricing Analysis
        15.26.2. Market Share Analysis, 2021
            15.26.2.1. By Source
            15.26.2.2. By Application
    15.27. GCC Countries
        15.27.1. Pricing Analysis
        15.27.2. Market Share Analysis, 2021
            15.27.2.1. By Source
            15.27.2.2. By Application
    15.28. South Africa
        15.28.1. Pricing Analysis
        15.28.2. Market Share Analysis, 2021
            15.28.2.1. By Source
            15.28.2.2. By Application
    15.29. North Africa
        15.29.1. Pricing Analysis
        15.29.2. Market Share Analysis, 2021
            15.29.2.1. By Source
            15.29.2.2. By Application
    15.30. Central Africa
        15.30.1. Pricing Analysis
        15.30.2. Market Share Analysis, 2021
            15.30.2.1. By Source
            15.30.2.2. By Application
16. Market Structure Analysis
    16.1. Competition Dashboard
    16.2. Competition Benchmarking
    16.3. Market Share Analysis of Top Players
        16.3.1. By Regional
        16.3.2. By Source
        16.3.3. By Application
17. Competition Analysis
    17.1. Competition Deep Dive
        17.1.1. TSKG Products, LLC
            17.1.1.1. Overview
            17.1.1.2. Product Portfolio
            17.1.1.3. Profitability by Market Segments (Source/Application/Region)
            17.1.1.4. Sales Footprint
            17.1.1.5. Strategy Overview
                17.1.1.5.1. Marketing Strategy
                17.1.1.5.2. Product Strategy
                17.1.1.5.3. Channel Strategy
        17.1.2. Kingherbs, Ltd.
            17.1.2.1. Overview
            17.1.2.2. Product Portfolio
            17.1.2.3. Profitability by Market Segments (Source/Application/Region)
            17.1.2.4. Sales Footprint
            17.1.2.5. Strategy Overview
                17.1.2.5.1. Marketing Strategy
                17.1.2.5.2. Product Strategy
                17.1.2.5.3. Channel Strategy
        17.1.3. Shaanxi Zebrago Industrial
            17.1.3.1. Overview
            17.1.3.2. Product Portfolio
            17.1.3.3. Profitability by Market Segments (Source/Application/Region)
            17.1.3.4. Sales Footprint
            17.1.3.5. Strategy Overview
                17.1.3.5.1. Marketing Strategy
                17.1.3.5.2. Product Strategy
                17.1.3.5.3. Channel Strategy
        17.1.4. BioGin Biochemicals
            17.1.4.1. Overview
            17.1.4.2. Product Portfolio
            17.1.4.3. Profitability by Market Segments (Source/Application/Region)
            17.1.4.4. Sales Footprint
            17.1.4.5. Strategy Overview
                17.1.4.5.1. Marketing Strategy
                17.1.4.5.2. Product Strategy
                17.1.4.5.3. Channel Strategy
        17.1.5. FarmaSino Pharmaceuticals
            17.1.5.1. Overview
            17.1.5.2. Product Portfolio
            17.1.5.3. Profitability by Market Segments (Source/Application/Region)
            17.1.5.4. Sales Footprint
            17.1.5.5. Strategy Overview
                17.1.5.5.1. Marketing Strategy
                17.1.5.5.2. Product Strategy
                17.1.5.5.3. Channel Strategy
        17.1.6. Plamed Green Science Group
            17.1.6.1. Overview
            17.1.6.2. Product Portfolio
            17.1.6.3. Profitability by Market Segments (Source/Application/Region)
            17.1.6.4. Sales Footprint
            17.1.6.5. Strategy Overview
                17.1.6.5.1. Marketing Strategy
                17.1.6.5.2. Product Strategy
                17.1.6.5.3. Channel Strategy
        17.1.7. SPI Pharma
            17.1.7.1. Overview
            17.1.7.2. Product Portfolio
            17.1.7.3. Profitability by Market Segments (Source/Application/Region)
            17.1.7.4. Sales Footprint
            17.1.7.5. Strategy Overview
                17.1.7.5.1. Marketing Strategy
                17.1.7.5.2. Product Strategy
                17.1.7.5.3. Channel Strategy
        17.1.8. Xi'an Sinuotebio Tech
            17.1.8.1. Overview
            17.1.8.2. Product Portfolio
            17.1.8.3. Profitability by Market Segments (Source/Application/Region)
            17.1.8.4. Sales Footprint
            17.1.8.5. Strategy Overview
                17.1.8.5.1. Marketing Strategy
                17.1.8.5.2. Product Strategy
                17.1.8.5.3. Channel Strategy
        17.1.9. ADM
            17.1.9.1. Overview
            17.1.9.2. Product Portfolio
            17.1.9.3. Profitability by Market Segments (Source/Application/Region)
            17.1.9.4. Sales Footprint
            17.1.9.5. Strategy Overview
                17.1.9.5.1. Marketing Strategy
                17.1.9.5.2. Product Strategy
                17.1.9.5.3. Channel Strategy
        17.1.10. Arjuna Natural Pvt Ltd.
            17.1.10.1. Overview
            17.1.10.2. Product Portfolio
            17.1.10.3. Profitability by Market Segments (Source/Application/Region)
            17.1.10.4. Sales Footprint
            17.1.10.5. Strategy Overview
                17.1.10.5.1. Marketing Strategy
                17.1.10.5.2. Product Strategy
                17.1.10.5.3. Channel Strategy
        17.1.11. Others on Additional Request
            17.1.11.1. Overview
            17.1.11.2. Product Portfolio
            17.1.11.3. Profitability by Market Segments (Source/Application/Region)
            17.1.11.4. Sales Footprint
            17.1.11.5. Strategy Overview
                17.1.11.5.1. Marketing Strategy
                17.1.11.5.2. Product Strategy
                17.1.11.5.3. Channel Strategy
18. Assumptions & Acronyms Used
19. Research Methodology
Recommendations

Food and Beverage

Food and Beverage Additive Market

April 2024

REP-GB-911

324 pages

Food and Beverage

Food Additive Market

January 2024

REP-GB-218

212 pages

Chemicals & Materials

Antimicrobial Additives Market

June 2023

REP-GB-94

339 pages

Explore Food and Beverage Insights

View Reports
Future Market Insights

Lignans Market

Schedule a Call