Seed Paper Bag Market Size and Forecast Outlook (2024 to 2034)

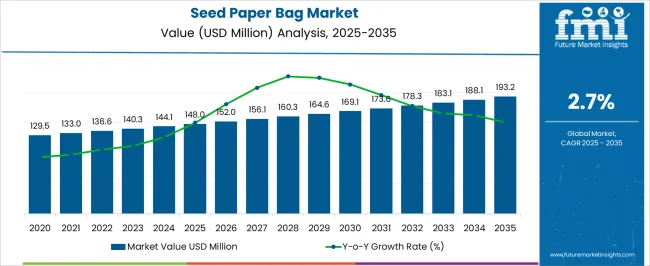
The sustainability fad among the general populace has led to the growth in sales of a multitude of product offerings in the international marketplace. Today’s environmentally conscious consumers are seeking ways to make their surroundings green but sustainably and practically and seed paper bags are one of the very few ideas to do that. Therefore, the seed paper bag market is set to develop at a sluggish but consistent CAGR of 2.70% through 2034.

Seed paper bags are in great demand, thanks to their application in various individual as well as commercial settings. These bags are utilized in industries to distribute, store, and package perishable seeds and saplings so that they can be directly sowed into the earth. In developed countries with limited space, consumers increasingly prefer these seed bags to practice terrace and vertical farming. This is ready to take the market valuation to a staggering USD 144.10 million in 2024.

Apart from plantations, these bags are also utilized for marketing purposes. By investing in such packaging materials, brands can make a good impact on their consumers. The sales of these bags are also touching the skies among gift shops, where they are used as eco-friendly gift packaging for small items such as jewelry, cosmetics, or small accessories. All these factors, along with a couple of others, are projected to take the market valuation to USD 213.20 million by 2034.

Attributes Details
Market Value for 2024 USD 144.10 million
Projected Market Value for 2034 USD 213.20 million
Value-based CAGR of the Market for 2024 to 2034 2.70%

Trends Shaping the Global Seed Paper Bag Market Landscape

  • Brands are leveraging the space on these bags to market their product offerings. With advancements in digital printing technology and affordable printing procedures, this is one of the most cost-effective methods to expand the consumer base.
  • The ongoing trend of vertical and terrace farming in corporate offices is also benefitting the sales of these bags significantly. Corporations committed to sustainability are one of the largest consumers of these bags.
  • Governments in various countries, for their smart cities, are extensively demanding these bags for roadside cultivation of plants and trees. Companies in this market can leverage this opportunity to expand their business and contribute to environmental conservation.

Seed Paper Bag Market by Material, Seed Type, Application, and Region

Brown Kraft to Garner Consumer Admiration as Preferred Seed Paper Bag Material

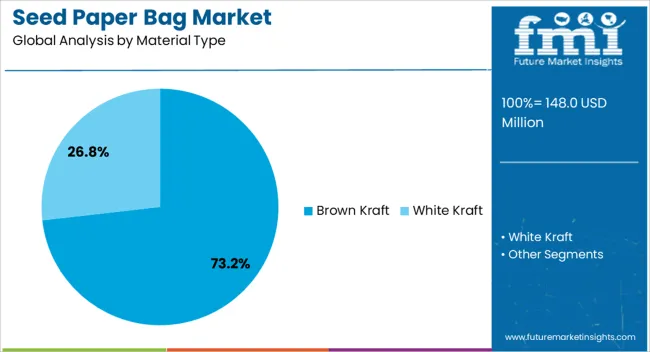
On the basis of materials, seed paper bags usually come in two variants, which are brown kraft and white kraft. Among these, the brown kraft segment holds a market share of 73.20% as of 2024.

Attributes Details
Material Brown Kraft
Market Share (2024) 73.20%

Brown kraft seed paper bags are in great demand, primarily due to their sustainability and eco-friendliness. These bags are the perfect solution for brands looking to reduce their environmental impact and offer a biodegradable alternative to traditional plastic bags. Besides this, these bags are highly recyclable as they can be planted directly into the soil, where the paper will decompose, and the seeds will germinate, ultimately growing into plants, flowers, or herbs. Features like these have contributed to their increased adoption.

Pinched-bottom Open-mouth Bags to Turn out to be the Best Sellers

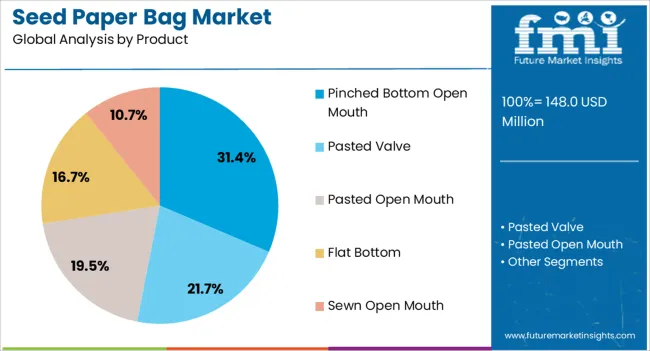
Seed paper bags are of different types, such as sewn open mouth, pinched bottom open mouth, pasted valve, pasted open mouth, flat bottom, etc. On the basis of product type, pinched-bottom open-mouth bags are the most popular, holding a market share of 31.40% in 2024.

Attributes Details
Product Pinched-bottom Open-mouth Bags
Market Share (2024) 31.40%

The clamor for pinched-bottom open-mouth bags in the general populace is increasing day by day as these bags offer a convenient and eco-friendly packaging solution. A multitude of commodities, such as food items, grains, pet food, etc., can be packaged in them. Apart from this, these bags are versatile and can be used for a wide range of products, including dry goods, powders, granules, and more. Their increased sales in the last few years are proof of their cost-effectiveness and versatility as well.

Country-wise Insights into Seed Paper Bag Adoption and Sustainability Focus

Countries CAGR (2024 to 2034)
India 5.70%
China 5.10%
Thailand 4.70%
United Kingdom 3.80%
Canada 3.70%

Expanding Food and Beverage Industry in India Aids Market Growth

India is one of the leading markets in the world when it comes to seed paper bags. The market in India is estimated to grow at a CAGR of 5.70% through 2034.

India is a heaven for the food and beverage industry, thanks to its expanding eCommerce sector, rising disposable incomes among the middle class, and enormous population. This industry, from the past few years, has been increasingly adopting sustainable packaging solutions to cater to the demands of eco-conscious consumers and businesses. Thus, companies in this sector in India are investing heftily in adding seed paper bags to their offerings so that they can contribute to environmental conservation while meeting the growing demand for sustainable packaging.

Growing Emphasis on Green Economy Benefits Market Growth in China

The seed paper bag market in China is also a lucrative one. It is anticipated to expand at a CAGR of 5.10% through 2034.

China is one of the pioneers in taking care of its carbon footprint. The government’s initiative to make industries embrace sustainability has largely been successful. This can be seen in their emphasis on the green economy and the increasing demand for seed paper bags across industries. Besides this, awareness regarding the ill effects of plastic and polymer bags has also pushed consumers to opt for seed paper bags as they are perceived as less harmful to the environment.

Thailand’s Hospitality Sector Takes Care of its Seed Paper Bag Market

The market in Thailand is also predicted to flourish in the coming future. It is very likely to progress at a CAGR of 4.70%.

A substantial part of Thai GDP comes from its hospitality and tourism sector. Every year, millions of tourists flock to the nation to take advantage of its lush mountains and pristine beaches. Hotels and restaurants in the country are largely decorated with indoor plants to give the interior a more sophisticated look. This has largely benefitted the market in Thailand. Besides this, these bags are also purchased as souvenirs by foreign tourists as a reminder of their trip to Thailand.

Corporate Sustainability Initiatives to Drive Sales in the United Kingdom

The United Kingdom is also one of the top countries in the seed paper bag market. It is slated to progress at an outstanding CAGR of 3.80% through 2034.

Industries in the United Kingdom are increasingly adopting sustainable practices and seeking eco-friendly alternatives for packaging. The ongoing trend of tote bags has also increased the sales of seed paper bags in the country. Companies across various industries, including retail, food and beverage, and eCommerce, are transitioning toward eco-friendly packaging solutions like seed paper bags to reduce their environmental impact and meet market demand.

Canada’s Market to Exhibit Decent Growth in the Coming Future

The market in Canada is also a promising one. It is anticipated to progress at a CAGR of 3.70% through 2034.

There has been a rise in environmental consciousness among individuals in this country in the past few decades. This has prompted them to opt for seed paper bags for their daily use. Government bans on single-use plastics, such as plastic bags, straws, and cutlery, have also created opportunities for eco-friendly alternatives like seed paper bags.
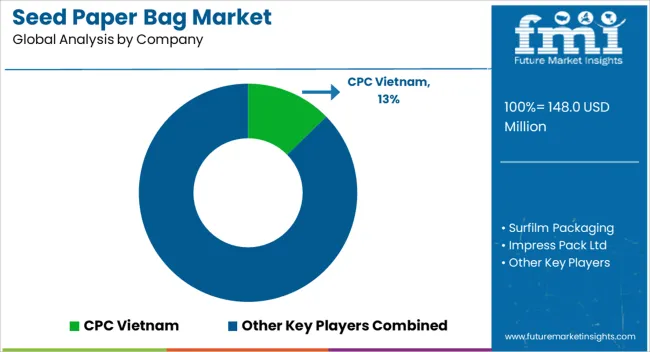
Competitive Landscape of the Seed Paper Bag Industry

The seed paper bag market is still in its nascent stages. There are a very companies in the international marketplace. The market is expected to have a promising future with the ongoing sustainability fad among businesses as well as consumers. These companies are also using these bags as a cost-effective tool to market their products.

Some of the most prominent companies in the market are Botanical PaperWorks, Green Field Paper Company, Seed Paper India, Bloomin, EcoEnclose, Plantable Seed Paper, Seeding Square, and Seedlings Cards & Gifts.

Recent Developments

  • In August 2018, Sapphire, a leading fashion brand in Pakistan, became the first to introduce recycled seed bags to tackle pollution. The initiative, led by Manghi Communication Solutions, aimed to address fashion's contribution to pollution by offering eco-friendly alternatives.
  • In September 2008, Monsanto Company announced the introduction of the AccuSure Seed Count System for Asgrow® Brand Roundup Ready 2 Yield™ soybean seed. This innovative system provided precise seed counts in both paper and mini-bulk bags, benefiting growers and dealers.
  • In October 2019, Chulalongkorn University collaborated with the Royal Forest Department to develop paper cups coated with bioplastic, aimed at replacing plastic seedling bags. These zero-waste cups, developed by the university's PETROMAT, degrade in soil and serve as eco-friendly seed pots.

Key Companies Operating in the Seed Paper Bag Sector

  • Botanical PaperWorks (Canada)
  • Green Field Paper Company (USA)
  • Seed Paper India (India)
  • Bloomin (USA)
  • EcoEnclose (USA)
  • Plantable Seed Paper (USA)
  • Seeding Square (Canada)
  • Seedlings Cards & Gifts (UK)
  • Sprout World (Sweden)
  • Earthly Goods (Australia)
  • Castor & Pollux (India)
  • Green Oath (Thailand)
  • Sow 'n Sow (Australia)
  • The Paper Seed Co. (USA)
  • Wildflower Seed & Tool Company (USA)
  • Recycled Paper Greetings (USA)
  • Le Jardin Perdu (UK)
  • Re-wrapped (UK)
  • Wildflower Seed Paper (Canada)
  • Green Banana Paper (USA)

Coverage Areas in the Global Seed Paper Bag Market Report

  • Growth Prospects for Seed Paper Packaging
  • Market Opportunities for Seed Paper Bag Applications in Various Industries
  • Regional Variations in Demand and Adoption of Seed Paper Bag Products
  • Market Trends and Drivers for Sustainable Packaging Solutions
  • Market Opportunities For Seed Paper Bag Applications in Various Industries

Segmentation of the Seed Paper Bag Market by Usage Format, Coating Type, and End Use

By Material Type:

  • Brown Kraft
  • White Kraft

By Product:

  • Sewn Open Mouth
  • Pinched Bottom Open Mouth
  • Pasted Valve
  • Pasted Open Mouth
  • Flat Bottom

By Thickness:

  • <2 ply
  • 2 ply
  • 3 ply
  • > 3 ply

By Region:

  • North America
  • Latin America
  • Europe
  • Asia Pacific
  • Middle East and Africa

Table of Content

  • 1. Executive Summary
  • 2. Market Overview
  • 3. Market Background
  • 4. Global Market Analysis 2019 to 2023 and Forecast, 2024 to 2034
  • 5. Global Market Analysis 2019 to 2023 and Forecast 2024 to 2034, By Material Type
    • 5.1. Brown Kraft
    • 5.2. White Kraft
  • 6. Global Market Analysis 2019 to 2023 and Forecast 2024 to 2034, By Product
    • 6.1. Sewn Open Mouth
    • 6.2. Pinched Bottom Open Mouth
    • 6.3. Pasted Valve
    • 6.4. Pasted Open Mouth
    • 6.5. Flat Bottom
  • 7. Global Market Analysis 2019 to 2023 and Forecast 2024 to 2034, By Thickness
    • 7.1. <2 ply
    • 7.2. 2 ply
    • 7.3. 3 ply
    • 7.4. > 3 ply
  • 8. Global Market Analysis 2019 to 2023 and Forecast 2024 to 2034, By Region
    • 8.1. North America
    • 8.2. Latin America
    • 8.3. Western Europe
    • 8.4. Eastern Europe
    • 8.5. South Asia and Pacific
    • 8.6. East Asia
    • 8.7. Middle East and Africa
  • 9. North America Market Analysis 2019 to 2023 and Forecast 2024 to 2034, By Country
  • 10. Latin America Market Analysis 2019 to 2023 and Forecast 2024 to 2034, By Country
  • 11. Western Europe Market Analysis 2019 to 2023 and Forecast 2024 to 2034, By Country
  • 12. Eastern Europe Market Analysis 2019 to 2023 and Forecast 2024 to 2034, By Country
  • 13. South Asia and Pacific Market Analysis 2019 to 2023 and Forecast 2024 to 2034, By Country
  • 14. East Asia Market Analysis 2019 to 2023 and Forecast 2024 to 2034, By Country
  • 15. Middle East and Africa Market Analysis 2019 to 2023 and Forecast 2024 to 2034, By Country
  • 16. Key Countries Market Analysis
  • 17. Market Structure Analysis
  • 18. Competition Analysis
    • 18.1. CPC Vietnam
    • 18.2. Surfilm Packaging
    • 18.3. Impress Pack Ltd
    • 18.4. Palmetto Industries
    • 18.5. Ronpak
    • 18.6. Gilchrist Bag Manufacturing LLC
    • 18.7. Ross & Wallace
    • 18.8. Bloom Green
  • 19. Assumptions & Acronyms Used
  • 20. Research Methodology

List of Tables

Table 1: Global Market Value (US$ Million) Forecast by Region, 2019 to 2034

Table 2: Global Market Volume (Unit) Forecast by Region, 2019 to 2034

Table 3: Global Market Value (US$ Million) Forecast by Material Type, 2019 to 2034

Table 4: Global Market Volume (Unit) Forecast by Material Type, 2019 to 2034

Table 5: Global Market Value (US$ Million) Forecast by Product, 2019 to 2034

Table 6: Global Market Volume (Unit) Forecast by Product, 2019 to 2034

Table 7: Global Market Value (US$ Million) Forecast by Thickness, 2019 to 2034

Table 8: Global Market Volume (Unit) Forecast by Thickness, 2019 to 2034

Table 9: North America Market Value (US$ Million) Forecast by Country, 2019 to 2034

Table 10: North America Market Volume (Unit) Forecast by Country, 2019 to 2034

Table 11: North America Market Value (US$ Million) Forecast by Material Type, 2019 to 2034

Table 12: North America Market Volume (Unit) Forecast by Material Type, 2019 to 2034

Table 13: North America Market Value (US$ Million) Forecast by Product, 2019 to 2034

Table 14: North America Market Volume (Unit) Forecast by Product, 2019 to 2034

Table 15: North America Market Value (US$ Million) Forecast by Thickness, 2019 to 2034

Table 16: North America Market Volume (Unit) Forecast by Thickness, 2019 to 2034

Table 17: Latin America Market Value (US$ Million) Forecast by Country, 2019 to 2034

Table 18: Latin America Market Volume (Unit) Forecast by Country, 2019 to 2034

Table 19: Latin America Market Value (US$ Million) Forecast by Material Type, 2019 to 2034

Table 20: Latin America Market Volume (Unit) Forecast by Material Type, 2019 to 2034

Table 21: Latin America Market Value (US$ Million) Forecast by Product, 2019 to 2034

Table 22: Latin America Market Volume (Unit) Forecast by Product, 2019 to 2034

Table 23: Latin America Market Value (US$ Million) Forecast by Thickness, 2019 to 2034

Table 24: Latin America Market Volume (Unit) Forecast by Thickness, 2019 to 2034

Table 25: Western Europe Market Value (US$ Million) Forecast by Country, 2019 to 2034

Table 26: Western Europe Market Volume (Unit) Forecast by Country, 2019 to 2034

Table 27: Western Europe Market Value (US$ Million) Forecast by Material Type, 2019 to 2034

Table 28: Western Europe Market Volume (Unit) Forecast by Material Type, 2019 to 2034

Table 29: Western Europe Market Value (US$ Million) Forecast by Product, 2019 to 2034

Table 30: Western Europe Market Volume (Unit) Forecast by Product, 2019 to 2034

Table 31: Western Europe Market Value (US$ Million) Forecast by Thickness, 2019 to 2034

Table 32: Western Europe Market Volume (Unit) Forecast by Thickness, 2019 to 2034

Table 33: Eastern Europe Market Value (US$ Million) Forecast by Country, 2019 to 2034

Table 34: Eastern Europe Market Volume (Unit) Forecast by Country, 2019 to 2034

Table 35: Eastern Europe Market Value (US$ Million) Forecast by Material Type, 2019 to 2034

Table 36: Eastern Europe Market Volume (Unit) Forecast by Material Type, 2019 to 2034

Table 37: Eastern Europe Market Value (US$ Million) Forecast by Product, 2019 to 2034

Table 38: Eastern Europe Market Volume (Unit) Forecast by Product, 2019 to 2034

Table 39: Eastern Europe Market Value (US$ Million) Forecast by Thickness, 2019 to 2034

Table 40: Eastern Europe Market Volume (Unit) Forecast by Thickness, 2019 to 2034

Table 41: South Asia and Pacific Market Value (US$ Million) Forecast by Country, 2019 to 2034

Table 42: South Asia and Pacific Market Volume (Unit) Forecast by Country, 2019 to 2034

Table 43: South Asia and Pacific Market Value (US$ Million) Forecast by Material Type, 2019 to 2034

Table 44: South Asia and Pacific Market Volume (Unit) Forecast by Material Type, 2019 to 2034

Table 45: South Asia and Pacific Market Value (US$ Million) Forecast by Product, 2019 to 2034

Table 46: South Asia and Pacific Market Volume (Unit) Forecast by Product, 2019 to 2034

Table 47: South Asia and Pacific Market Value (US$ Million) Forecast by Thickness, 2019 to 2034

Table 48: South Asia and Pacific Market Volume (Unit) Forecast by Thickness, 2019 to 2034

Table 49: East Asia Market Value (US$ Million) Forecast by Country, 2019 to 2034

Table 50: East Asia Market Volume (Unit) Forecast by Country, 2019 to 2034

Table 51: East Asia Market Value (US$ Million) Forecast by Material Type, 2019 to 2034

Table 52: East Asia Market Volume (Unit) Forecast by Material Type, 2019 to 2034

Table 53: East Asia Market Value (US$ Million) Forecast by Product, 2019 to 2034

Table 54: East Asia Market Volume (Unit) Forecast by Product, 2019 to 2034

Table 55: East Asia Market Value (US$ Million) Forecast by Thickness, 2019 to 2034

Table 56: East Asia Market Volume (Unit) Forecast by Thickness, 2019 to 2034

Table 57: Middle East and Africa Market Value (US$ Million) Forecast by Country, 2019 to 2034

Table 58: Middle East and Africa Market Volume (Unit) Forecast by Country, 2019 to 2034

Table 59: Middle East and Africa Market Value (US$ Million) Forecast by Material Type, 2019 to 2034

Table 60: Middle East and Africa Market Volume (Unit) Forecast by Material Type, 2019 to 2034

Table 61: Middle East and Africa Market Value (US$ Million) Forecast by Product, 2019 to 2034

Table 62: Middle East and Africa Market Volume (Unit) Forecast by Product, 2019 to 2034

Table 63: Middle East and Africa Market Value (US$ Million) Forecast by Thickness, 2019 to 2034

Table 64: Middle East and Africa Market Volume (Unit) Forecast by Thickness, 2019 to 2034

List of Figures

Figure 1: Global Market Value (US$ Million) by Material Type, 2024 to 2034

Figure 2: Global Market Value (US$ Million) by Product, 2024 to 2034

Figure 3: Global Market Value (US$ Million) by Thickness, 2024 to 2034

Figure 4: Global Market Value (US$ Million) by Region, 2024 to 2034

Figure 5: Global Market Value (US$ Million) Analysis by Region, 2019 to 2034

Figure 6: Global Market Volume (Unit) Analysis by Region, 2019 to 2034

Figure 7: Global Market Value Share (%) and BPS Analysis by Region, 2024 to 2034

Figure 8: Global Market Y-o-Y Growth (%) Projections by Region, 2024 to 2034

Figure 9: Global Market Value (US$ Million) Analysis by Material Type, 2019 to 2034

Figure 10: Global Market Volume (Unit) Analysis by Material Type, 2019 to 2034

Figure 11: Global Market Value Share (%) and BPS Analysis by Material Type, 2024 to 2034

Figure 12: Global Market Y-o-Y Growth (%) Projections by Material Type, 2024 to 2034

Figure 13: Global Market Value (US$ Million) Analysis by Product, 2019 to 2034

Figure 14: Global Market Volume (Unit) Analysis by Product, 2019 to 2034

Figure 15: Global Market Value Share (%) and BPS Analysis by Product, 2024 to 2034

Figure 16: Global Market Y-o-Y Growth (%) Projections by Product, 2024 to 2034

Figure 17: Global Market Value (US$ Million) Analysis by Thickness, 2019 to 2034

Figure 18: Global Market Volume (Unit) Analysis by Thickness, 2019 to 2034

Figure 19: Global Market Value Share (%) and BPS Analysis by Thickness, 2024 to 2034

Figure 20: Global Market Y-o-Y Growth (%) Projections by Thickness, 2024 to 2034

Figure 21: Global Market Attractiveness by Material Type, 2024 to 2034

Figure 22: Global Market Attractiveness by Product, 2024 to 2034

Figure 23: Global Market Attractiveness by Thickness, 2024 to 2034

Figure 24: Global Market Attractiveness by Region, 2024 to 2034

Figure 25: North America Market Value (US$ Million) by Material Type, 2024 to 2034

Figure 26: North America Market Value (US$ Million) by Product, 2024 to 2034

Figure 27: North America Market Value (US$ Million) by Thickness, 2024 to 2034

Figure 28: North America Market Value (US$ Million) by Country, 2024 to 2034

Figure 29: North America Market Value (US$ Million) Analysis by Country, 2019 to 2034

Figure 30: North America Market Volume (Unit) Analysis by Country, 2019 to 2034

Figure 31: North America Market Value Share (%) and BPS Analysis by Country, 2024 to 2034

Figure 32: North America Market Y-o-Y Growth (%) Projections by Country, 2024 to 2034

Figure 33: North America Market Value (US$ Million) Analysis by Material Type, 2019 to 2034

Figure 34: North America Market Volume (Unit) Analysis by Material Type, 2019 to 2034

Figure 35: North America Market Value Share (%) and BPS Analysis by Material Type, 2024 to 2034

Figure 36: North America Market Y-o-Y Growth (%) Projections by Material Type, 2024 to 2034

Figure 37: North America Market Value (US$ Million) Analysis by Product, 2019 to 2034

Figure 38: North America Market Volume (Unit) Analysis by Product, 2019 to 2034

Figure 39: North America Market Value Share (%) and BPS Analysis by Product, 2024 to 2034

Figure 40: North America Market Y-o-Y Growth (%) Projections by Product, 2024 to 2034

Figure 41: North America Market Value (US$ Million) Analysis by Thickness, 2019 to 2034

Figure 42: North America Market Volume (Unit) Analysis by Thickness, 2019 to 2034

Figure 43: North America Market Value Share (%) and BPS Analysis by Thickness, 2024 to 2034

Figure 44: North America Market Y-o-Y Growth (%) Projections by Thickness, 2024 to 2034

Figure 45: North America Market Attractiveness by Material Type, 2024 to 2034

Figure 46: North America Market Attractiveness by Product, 2024 to 2034

Figure 47: North America Market Attractiveness by Thickness, 2024 to 2034

Figure 48: North America Market Attractiveness by Country, 2024 to 2034

Figure 49: Latin America Market Value (US$ Million) by Material Type, 2024 to 2034

Figure 50: Latin America Market Value (US$ Million) by Product, 2024 to 2034

Figure 51: Latin America Market Value (US$ Million) by Thickness, 2024 to 2034

Figure 52: Latin America Market Value (US$ Million) by Country, 2024 to 2034

Figure 53: Latin America Market Value (US$ Million) Analysis by Country, 2019 to 2034

Figure 54: Latin America Market Volume (Unit) Analysis by Country, 2019 to 2034

Figure 55: Latin America Market Value Share (%) and BPS Analysis by Country, 2024 to 2034

Figure 56: Latin America Market Y-o-Y Growth (%) Projections by Country, 2024 to 2034

Figure 57: Latin America Market Value (US$ Million) Analysis by Material Type, 2019 to 2034

Figure 58: Latin America Market Volume (Unit) Analysis by Material Type, 2019 to 2034

Figure 59: Latin America Market Value Share (%) and BPS Analysis by Material Type, 2024 to 2034

Figure 60: Latin America Market Y-o-Y Growth (%) Projections by Material Type, 2024 to 2034

Figure 61: Latin America Market Value (US$ Million) Analysis by Product, 2019 to 2034

Figure 62: Latin America Market Volume (Unit) Analysis by Product, 2019 to 2034

Figure 63: Latin America Market Value Share (%) and BPS Analysis by Product, 2024 to 2034

Figure 64: Latin America Market Y-o-Y Growth (%) Projections by Product, 2024 to 2034

Figure 65: Latin America Market Value (US$ Million) Analysis by Thickness, 2019 to 2034

Figure 66: Latin America Market Volume (Unit) Analysis by Thickness, 2019 to 2034

Figure 67: Latin America Market Value Share (%) and BPS Analysis by Thickness, 2024 to 2034

Figure 68: Latin America Market Y-o-Y Growth (%) Projections by Thickness, 2024 to 2034

Figure 69: Latin America Market Attractiveness by Material Type, 2024 to 2034

Figure 70: Latin America Market Attractiveness by Product, 2024 to 2034

Figure 71: Latin America Market Attractiveness by Thickness, 2024 to 2034

Figure 72: Latin America Market Attractiveness by Country, 2024 to 2034

Figure 73: Western Europe Market Value (US$ Million) by Material Type, 2024 to 2034

Figure 74: Western Europe Market Value (US$ Million) by Product, 2024 to 2034

Figure 75: Western Europe Market Value (US$ Million) by Thickness, 2024 to 2034

Figure 76: Western Europe Market Value (US$ Million) by Country, 2024 to 2034

Figure 77: Western Europe Market Value (US$ Million) Analysis by Country, 2019 to 2034

Figure 78: Western Europe Market Volume (Unit) Analysis by Country, 2019 to 2034

Figure 79: Western Europe Market Value Share (%) and BPS Analysis by Country, 2024 to 2034

Figure 80: Western Europe Market Y-o-Y Growth (%) Projections by Country, 2024 to 2034

Figure 81: Western Europe Market Value (US$ Million) Analysis by Material Type, 2019 to 2034

Figure 82: Western Europe Market Volume (Unit) Analysis by Material Type, 2019 to 2034

Figure 83: Western Europe Market Value Share (%) and BPS Analysis by Material Type, 2024 to 2034

Figure 84: Western Europe Market Y-o-Y Growth (%) Projections by Material Type, 2024 to 2034

Figure 85: Western Europe Market Value (US$ Million) Analysis by Product, 2019 to 2034

Figure 86: Western Europe Market Volume (Unit) Analysis by Product, 2019 to 2034

Figure 87: Western Europe Market Value Share (%) and BPS Analysis by Product, 2024 to 2034

Figure 88: Western Europe Market Y-o-Y Growth (%) Projections by Product, 2024 to 2034

Figure 89: Western Europe Market Value (US$ Million) Analysis by Thickness, 2019 to 2034

Figure 90: Western Europe Market Volume (Unit) Analysis by Thickness, 2019 to 2034

Figure 91: Western Europe Market Value Share (%) and BPS Analysis by Thickness, 2024 to 2034

Figure 92: Western Europe Market Y-o-Y Growth (%) Projections by Thickness, 2024 to 2034

Figure 93: Western Europe Market Attractiveness by Material Type, 2024 to 2034

Figure 94: Western Europe Market Attractiveness by Product, 2024 to 2034

Figure 95: Western Europe Market Attractiveness by Thickness, 2024 to 2034

Figure 96: Western Europe Market Attractiveness by Country, 2024 to 2034

Figure 97: Eastern Europe Market Value (US$ Million) by Material Type, 2024 to 2034

Figure 98: Eastern Europe Market Value (US$ Million) by Product, 2024 to 2034

Figure 99: Eastern Europe Market Value (US$ Million) by Thickness, 2024 to 2034

Figure 100: Eastern Europe Market Value (US$ Million) by Country, 2024 to 2034

Figure 101: Eastern Europe Market Value (US$ Million) Analysis by Country, 2019 to 2034

Figure 102: Eastern Europe Market Volume (Unit) Analysis by Country, 2019 to 2034

Figure 103: Eastern Europe Market Value Share (%) and BPS Analysis by Country, 2024 to 2034

Figure 104: Eastern Europe Market Y-o-Y Growth (%) Projections by Country, 2024 to 2034

Figure 105: Eastern Europe Market Value (US$ Million) Analysis by Material Type, 2019 to 2034

Figure 106: Eastern Europe Market Volume (Unit) Analysis by Material Type, 2019 to 2034

Figure 107: Eastern Europe Market Value Share (%) and BPS Analysis by Material Type, 2024 to 2034

Figure 108: Eastern Europe Market Y-o-Y Growth (%) Projections by Material Type, 2024 to 2034

Figure 109: Eastern Europe Market Value (US$ Million) Analysis by Product, 2019 to 2034

Figure 110: Eastern Europe Market Volume (Unit) Analysis by Product, 2019 to 2034

Figure 111: Eastern Europe Market Value Share (%) and BPS Analysis by Product, 2024 to 2034

Figure 112: Eastern Europe Market Y-o-Y Growth (%) Projections by Product, 2024 to 2034

Figure 113: Eastern Europe Market Value (US$ Million) Analysis by Thickness, 2019 to 2034

Figure 114: Eastern Europe Market Volume (Unit) Analysis by Thickness, 2019 to 2034

Figure 115: Eastern Europe Market Value Share (%) and BPS Analysis by Thickness, 2024 to 2034

Figure 116: Eastern Europe Market Y-o-Y Growth (%) Projections by Thickness, 2024 to 2034

Figure 117: Eastern Europe Market Attractiveness by Material Type, 2024 to 2034

Figure 118: Eastern Europe Market Attractiveness by Product, 2024 to 2034

Figure 119: Eastern Europe Market Attractiveness by Thickness, 2024 to 2034

Figure 120: Eastern Europe Market Attractiveness by Country, 2024 to 2034

Figure 121: South Asia and Pacific Market Value (US$ Million) by Material Type, 2024 to 2034

Figure 122: South Asia and Pacific Market Value (US$ Million) by Product, 2024 to 2034

Figure 123: South Asia and Pacific Market Value (US$ Million) by Thickness, 2024 to 2034

Figure 124: South Asia and Pacific Market Value (US$ Million) by Country, 2024 to 2034

Figure 125: South Asia and Pacific Market Value (US$ Million) Analysis by Country, 2019 to 2034

Figure 126: South Asia and Pacific Market Volume (Unit) Analysis by Country, 2019 to 2034

Figure 127: South Asia and Pacific Market Value Share (%) and BPS Analysis by Country, 2024 to 2034

Figure 128: South Asia and Pacific Market Y-o-Y Growth (%) Projections by Country, 2024 to 2034

Figure 129: South Asia and Pacific Market Value (US$ Million) Analysis by Material Type, 2019 to 2034

Figure 130: South Asia and Pacific Market Volume (Unit) Analysis by Material Type, 2019 to 2034

Figure 131: South Asia and Pacific Market Value Share (%) and BPS Analysis by Material Type, 2024 to 2034

Figure 132: South Asia and Pacific Market Y-o-Y Growth (%) Projections by Material Type, 2024 to 2034

Figure 133: South Asia and Pacific Market Value (US$ Million) Analysis by Product, 2019 to 2034

Figure 134: South Asia and Pacific Market Volume (Unit) Analysis by Product, 2019 to 2034

Figure 135: South Asia and Pacific Market Value Share (%) and BPS Analysis by Product, 2024 to 2034

Figure 136: South Asia and Pacific Market Y-o-Y Growth (%) Projections by Product, 2024 to 2034

Figure 137: South Asia and Pacific Market Value (US$ Million) Analysis by Thickness, 2019 to 2034

Figure 138: South Asia and Pacific Market Volume (Unit) Analysis by Thickness, 2019 to 2034

Figure 139: South Asia and Pacific Market Value Share (%) and BPS Analysis by Thickness, 2024 to 2034

Figure 140: South Asia and Pacific Market Y-o-Y Growth (%) Projections by Thickness, 2024 to 2034

Figure 141: South Asia and Pacific Market Attractiveness by Material Type, 2024 to 2034

Figure 142: South Asia and Pacific Market Attractiveness by Product, 2024 to 2034

Figure 143: South Asia and Pacific Market Attractiveness by Thickness, 2024 to 2034

Figure 144: South Asia and Pacific Market Attractiveness by Country, 2024 to 2034

Figure 145: East Asia Market Value (US$ Million) by Material Type, 2024 to 2034

Figure 146: East Asia Market Value (US$ Million) by Product, 2024 to 2034

Figure 147: East Asia Market Value (US$ Million) by Thickness, 2024 to 2034

Figure 148: East Asia Market Value (US$ Million) by Country, 2024 to 2034

Figure 149: East Asia Market Value (US$ Million) Analysis by Country, 2019 to 2034

Figure 150: East Asia Market Volume (Unit) Analysis by Country, 2019 to 2034

Figure 151: East Asia Market Value Share (%) and BPS Analysis by Country, 2024 to 2034

Figure 152: East Asia Market Y-o-Y Growth (%) Projections by Country, 2024 to 2034

Figure 153: East Asia Market Value (US$ Million) Analysis by Material Type, 2019 to 2034

Figure 154: East Asia Market Volume (Unit) Analysis by Material Type, 2019 to 2034

Figure 155: East Asia Market Value Share (%) and BPS Analysis by Material Type, 2024 to 2034

Figure 156: East Asia Market Y-o-Y Growth (%) Projections by Material Type, 2024 to 2034

Figure 157: East Asia Market Value (US$ Million) Analysis by Product, 2019 to 2034

Figure 158: East Asia Market Volume (Unit) Analysis by Product, 2019 to 2034

Figure 159: East Asia Market Value Share (%) and BPS Analysis by Product, 2024 to 2034

Figure 160: East Asia Market Y-o-Y Growth (%) Projections by Product, 2024 to 2034

Figure 161: East Asia Market Value (US$ Million) Analysis by Thickness, 2019 to 2034

Figure 162: East Asia Market Volume (Unit) Analysis by Thickness, 2019 to 2034

Figure 163: East Asia Market Value Share (%) and BPS Analysis by Thickness, 2024 to 2034

Figure 164: East Asia Market Y-o-Y Growth (%) Projections by Thickness, 2024 to 2034

Figure 165: East Asia Market Attractiveness by Material Type, 2024 to 2034

Figure 166: East Asia Market Attractiveness by Product, 2024 to 2034

Figure 167: East Asia Market Attractiveness by Thickness, 2024 to 2034

Figure 168: East Asia Market Attractiveness by Country, 2024 to 2034

Figure 169: Middle East and Africa Market Value (US$ Million) by Material Type, 2024 to 2034

Figure 170: Middle East and Africa Market Value (US$ Million) by Product, 2024 to 2034

Figure 171: Middle East and Africa Market Value (US$ Million) by Thickness, 2024 to 2034

Figure 172: Middle East and Africa Market Value (US$ Million) by Country, 2024 to 2034

Figure 173: Middle East and Africa Market Value (US$ Million) Analysis by Country, 2019 to 2034

Figure 174: Middle East and Africa Market Volume (Unit) Analysis by Country, 2019 to 2034

Figure 175: Middle East and Africa Market Value Share (%) and BPS Analysis by Country, 2024 to 2034

Figure 176: Middle East and Africa Market Y-o-Y Growth (%) Projections by Country, 2024 to 2034

Figure 177: Middle East and Africa Market Value (US$ Million) Analysis by Material Type, 2019 to 2034

Figure 178: Middle East and Africa Market Volume (Unit) Analysis by Material Type, 2019 to 2034

Figure 179: Middle East and Africa Market Value Share (%) and BPS Analysis by Material Type, 2024 to 2034

Figure 180: Middle East and Africa Market Y-o-Y Growth (%) Projections by Material Type, 2024 to 2034

Figure 181: Middle East and Africa Market Value (US$ Million) Analysis by Product, 2019 to 2034

Figure 182: Middle East and Africa Market Volume (Unit) Analysis by Product, 2019 to 2034

Figure 183: Middle East and Africa Market Value Share (%) and BPS Analysis by Product, 2024 to 2034

Figure 184: Middle East and Africa Market Y-o-Y Growth (%) Projections by Product, 2024 to 2034

Figure 185: Middle East and Africa Market Value (US$ Million) Analysis by Thickness, 2019 to 2034

Figure 186: Middle East and Africa Market Volume (Unit) Analysis by Thickness, 2019 to 2034

Figure 187: Middle East and Africa Market Value Share (%) and BPS Analysis by Thickness, 2024 to 2034

Figure 188: Middle East and Africa Market Y-o-Y Growth (%) Projections by Thickness, 2024 to 2034

Figure 189: Middle East and Africa Market Attractiveness by Material Type, 2024 to 2034

Figure 190: Middle East and Africa Market Attractiveness by Product, 2024 to 2034

Figure 191: Middle East and Africa Market Attractiveness by Thickness, 2024 to 2034

Figure 192: Middle East and Africa Market Attractiveness by Country, 2024 to 2034

Frequently Asked Questions

How much is the Seed Paper Bag Market Currently Worth?

The market is expected to be worth USD 144.10 million in 2024.

What is the Sales Forecast for Seed Paper Bags through 2034?

The seed paper bag market is expected to reach USD 213.20 million by 2034.

At What Rate is the Seed Paper Bag Market Growing?

The market is set to develop at a CAGR of 2.70% from 2024 to 2034.

Which are the key Companies in the Seed Paper Bag Market?

Botanical PaperWorks, Green Field Paper Company, Seed Paper India, Bloomin, EcoEnclose, Plantable Seed Paper, Seeding Square, and Seedlings Cards & Gifts, are some of the major players in the market.

What was the overall Value of The Seed Paper Bag Market in 2023?

The market valuation in 2023 was USD 136.70 million.

Explore Packaging Formats Insights

Future Market Insights

Seed Paper Bag Market