Butyrate Additives Market Size and Share Forecast Outlook 2025 to 2035

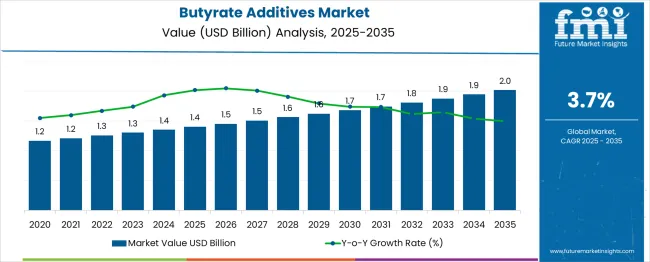
The butyrate additives market shows a stable upward trajectory, expanding from USD 1.4 billion in 2025 to USD 1.9 billion by 2035. Year-on-year increases are modest but consistent, beginning with USD 0.05 billion in 2026 and gradually reaching about USD 0.06-0.07 billion by the early 2030s.

This steady pattern reflects compound-driven gains rather than sharp jumps, indicating market maturity and dependence on incremental demand. Growth is expected from feed manufacturers optimizing animal gut health, especially in poultry and swine applications. Regional traction in Asia and Latin America will support broader expansion, while Europe may drive value via specialized blends. The forecasted pace signals constant investment interest from feed additive suppliers in precision nutrition segments.
Quick Stats of the Butyrate Additives Market

  • Butyrate Additives Market Size (2025): USD 1.4 billion
  • Projected Butyrate Additives Market Size (2035): USD 1.9 billion
  • Forecast CAGR of Butyrate Additives Market (2025 to 2035): 3.7%
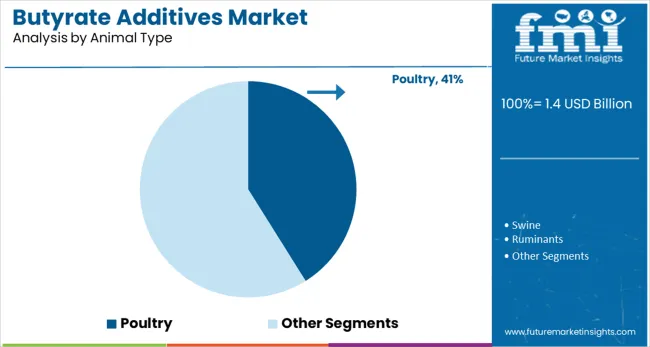
  • Leading Segment of Butyrate Additives Market (2025): Poultry (41.1%)
  • Key Growth Regions of Butyrate Additives Market: North America, Asia-Pacific, Europe
  • Top Key Players of Butyrate Additives Market: Perstorp Group, Novus International, ADDCON GmbH, Kemin Industries, Impextraco

Butyrate Additives Market Market Value Analysis

Metric Value
Industry Size (2025E) USD 1.4 billion
Industry Value (2035F) USD 1.9 billion
CAGR (2025 to 2035) 3.7%

On January 13, 2025, Perstorp Group, a wholly-owned subsidiary of PETRONAS Chemicals Group Berhad (PCG), announced the appointment of Ian Atterbury as Senior Vice President of its Animal Nutrition business. With over 30 years of global experience in the animal nutrition industry, Atterbury brings a wealth of leadership expertise.

Perstorp CEO Ib Jensen highlighted the company’s ambitious growth strategy, emphasizing the importance of Animal Nutrition in Perstorp's future and the opportunity to expand the business through a differentiated product pipeline. Atterbury expressed excitement about joining Perstorp’s innovative team.

The butyrate additives market holds an estimated 2-4% share of the global feed additives market, which is valued at above USD 45 billion. Within the broader animal nutrition market, its share narrows to around 1-2%, as it competes with amino acids, enzymes, and vitamins. In the livestock and poultry feed segment, particularly poultry, butyrates represent a more prominent niche, accounting for nearly 5-6% due to their role in gut health and pathogen control.

Among functional feed ingredients, which include organic acids and prebiotics, butyrates form approximately 6-8% of the value. Within gut health solutions, they are a major contributor, comprising about 10-12% of the segment. Their strategic relevance exceeds their size, as they directly influence productivity and antibiotic-free livestock initiatives.

Analyzing Butyrate Additives Market by Top Segments

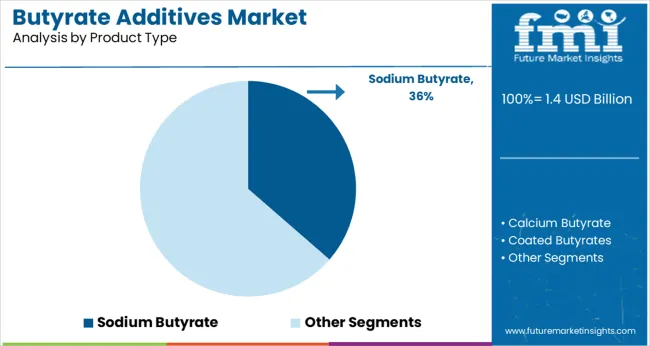
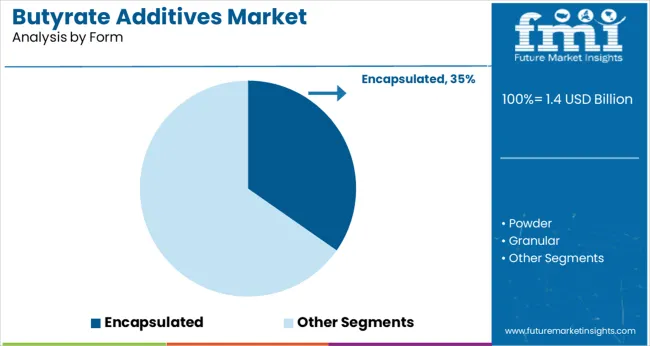
The industry is led by poultry with a 41.1% share, driven by its significant role in improving gut health and feed efficiency. Sodium butyrate is the dominant product type at 36.40%, while encapsulated forms account for 34.70% due to their controlled release benefits. Direct B2B sales dominate the sales channel with a 44.20% share, while compound feed leads in end-use applications at 39.60%. Lipid-coated additives hold a 35.80% share in coating technology.
Poultry Segment Dominance in Animal Type Category

Butyrate Additives Market Analysis By Animal Type

The poultry segment is the largest in the industry, capturing 41.1% of the industry share. Poultry farming heavily relies on these additives to improve gut health, enhance digestion, and boost overall productivity. By promoting a balanced microbiome and strengthening immune functions, these additives reduce disease risks and foster optimal growth. Their role in enhancing feed efficiency has made them essential in the poultry industry, especially for improving feed conversion rates and overall performance.
  • Poultry benefits significantly from gut health-enhancing butyrate supplements.
  • These additives support poultry growth and improve feed efficiency.
  • Adoption is rising due to their effectiveness in disease prevention and productivity.

Sodium Butyrate Leading Product Type

Butyrate Additives Market Analysis By Product Type

Sodium butyrate is the most popular product type in the industry, accounting for 36.40% of the industry share. It is valued for its ability to support gut health and improve feed efficiency in livestock, particularly in poultry. Sodium butyrate helps reduce gut inflammation and enhances the immune system. This product type is widely used because of its superior digestibility, which promotes growth and feed conversion in animals. Its widespread application across farms solidifies its dominance in the industry.
  • Sodium butyrate enhances digestibility and feed conversion in livestock.
  • It plays a critical role in improving gut health and immune functions.
  • The product’s widespread use ensures its leadership in the industry.

Encapsulated Form Gaining Popularity

Butyrate Additives Market Analysis By Form

Encapsulated form, accounting for 34.70% of the industry share, is gaining traction due to its controlled-release capabilities. Encapsulation ensures that the active ingredient is protected from degradation, ensuring it reaches the gut effectively for maximum benefit. This technology extends the product’s stability and bioavailability, providing steady effects. Encapsulated butyrate is preferred in livestock feeds where targeted release and gradual absorption are critical to achieving optimal results.
  • Encapsulation allows for controlled release and efficacy in livestock feed.
  • It improves stability and prevents the degradation of butyrate during digestion.
  • This form is ideal for targeted gut health enhancement in animals.

Gut Health Enhancer Leading Functionality

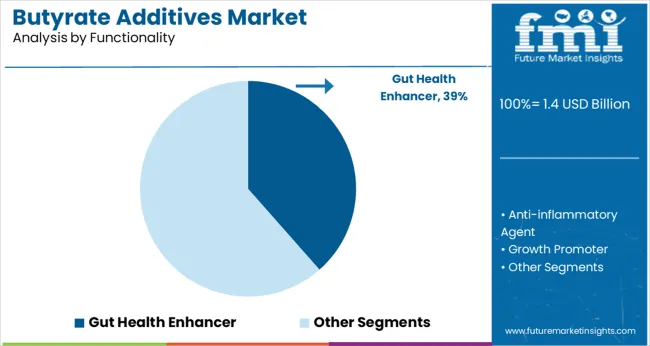
Butyrate Additives Market Analysis By Functionality

The gut health enhancer functionality leads the industry with a 38.5% share. Butyrate supplements are known for improving gut health by promoting a balanced microbiome and boosting nutrient absorption. These benefits result in better growth rates and enhanced animal productivity. Gut health is critical for livestock, as it directly influences feed efficiency, immunity, and overall animal performance. The increasing focus on gut health in livestock farming has significantly driven the demand for these additives with gut health-enhancing properties.
  • Butyrate supports gut health, boosting nutrient absorption and immunity.
  • It plays a crucial role in enhancing feed efficiency and animal performance.
  • The growing focus on gut health drives the demand for these additives.

Direct Sales B2B Dominating Sales Channel

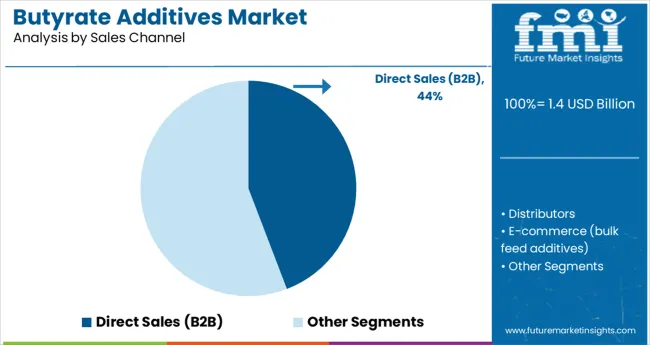
Butyrate Additives Market Analysis By Sales Channel>

Direct sales (B2B) dominate the sales channel segment, capturing 44.20% of the industry share. This sales model is preferred by large-scale feed manufacturers and integrators due to the benefits of bulk purchasing and cost-effective pricing. B2B sales allow for tailored solutions to meet specific customer needs, ensuring that the additives are suitable for particular farming requirements. The direct model also strengthens long-term relationships between producers and end-users, ensuring a consistent supply of butyrate supplements.
  • B2B sales offer bulk purchasing advantages and cost-effective pricing.
  • Tailored solutions ensure additives meet specific farm requirements.
  • Direct sales foster strong relationships between producers and end-users, ensuring reliability.

Lipid-Coated Technology Leading in Coating Segment

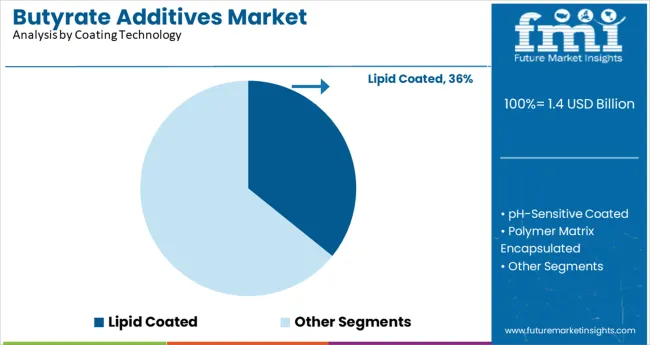
Butyrate Additives Market Analysis By Coating Technology

Lipid-coated additives hold a 35.80% share in the coating technology segment. This coating protects butyrate from degradation, ensuring it is released effectively within the gut. Lipid-coated technology enhances the stability and bioavailability of the active ingredient, making it more effective in livestock feed. The controlled release of butyrate through lipid coatings ensures that it provides benefits to animals, improving their overall health and feed efficiency.
  • Lipid coatings enhance the stability and controlled release of butyrate.
  • This technology improves bioavailability, ensuring effective delivery in the gut.
  • Lipid-coated butyrate is especially beneficial for poultry, ensuring optimal results.

Compound Feed Leading End Use Application

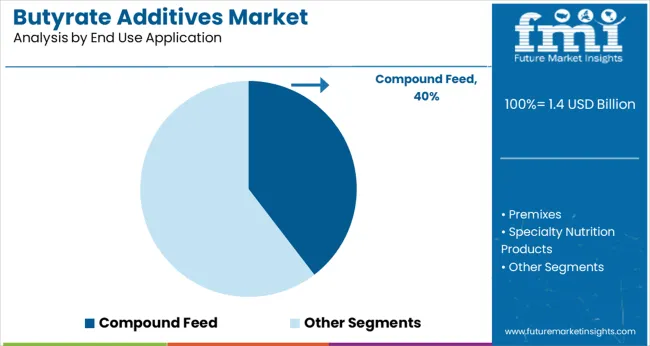
Butyrate Additives Market Analysis By End Use Application

Compound feed is the largest application segment with a 39.60% share. Butyrate supplements are widely incorporated into compound feeds to enhance digestion and optimize nutrient absorption. This application contributes to better feed efficiency, growth, and overall performance in livestock. The demand for compound feed continues to rise as farmers increasingly recognize the value of these additives in improving feed quality. Butyrate’s role in maintaining gut health is essential for producing high-quality livestock and improving farm productivity.

  • Compound feed is the primary application for butyrate supplements.
  • It improves nutrient absorption and feed efficiency in livestock.
  • The growing demand for high-quality feed drives the adoption of butyrate supplements.

Top Dynamics in Butyrate Additives Market

The global market is expanding due to rising demand for animal protein, a shift towards eco-friendly feed solutions, and increasing emphasis on gut health. Butyrate supplements support livestock productivity by improving feed efficiency and promoting gut health. However, challenges such as high production costs and regulatory barriers may impact industry growth.

Rising Demand for Gut Health and Antibiotic Alternatives

The market is driven by the need for healthier livestock and alternatives to antibiotics. Butyrate has demonstrated significant benefits in improving gut health, boosting feed efficiency, and promoting immune function in animals. As of 2025, these additives are responsible for a 36.4% share of the global feed additives industry. With rising consumer demand for antibiotic-free meat, the adoption of butyrate supplements is increasing across the animal feed industry.

  • Butyrate supplements improve gut microbiome health and feed efficiency, directly boosting animal growth rates.
  • 40% of global livestock producers are adopting butyrate as an antibiotic alternative.
  • The demand for butyrate-based feed solutions is expected to grow by 9% annually in North America and Europe.

Cost Pressures and Regulatory Challenges

The high production costs associated with butyrate additives, especially sodium butyrate, pose a challenge to the market. Raw material costs have increased by 13% since 2022, and the complex regulatory environment for feed additives further hampers growth. Despite these challenges, regulatory changes favoring natural and eco-friedndly additives are expected to support industry expansion.

  • Sodium butyrate costs have increased by 9-13% due to fluctuations in raw material prices.
  • The regulatory approval process for feed additives can take 2-3 years, increasing market entry barriers.
  • Compliance with evolving regulations on feed traceability and ingredient labeling is increasing costs by 4% annually for manufacturers.

Top Countries Producing, Applying, and Expanding Butyrate Additives in Feed Chains

The report includes analysis of over 40 countries, with five profiled below for reference.
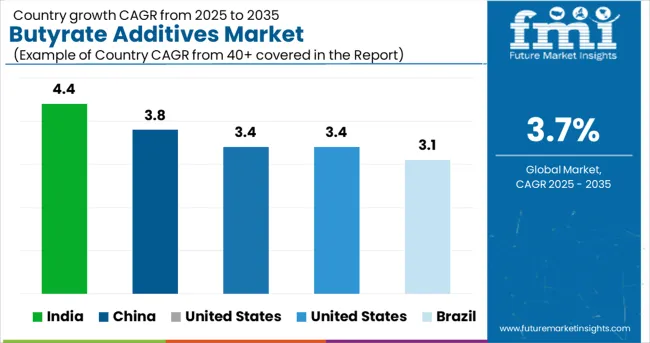
Butyrate Additives Market Cagr Analysis By Country

Countries CAGR (2025-2035)
India 4.4%
China 3.8%
United States 3.4%
Australia 3.4%
Brazil 3.1%

The global butyrate additives market is projected to grow at 3.7% CAGR from 2025 to 2035. India leads with 4.4%, outperforming the global average by 0.7 percentage points, driven by expanding poultry integration and high uptake in aquaculture feed. China follows at 3.8%, with rising adoption in swine diets and a shift toward encapsulated delivery formats. The United States and Australia, both at 3.4%, remain slightly below the global trend due to limited penetration in cost-sensitive formulations. Brazil lags at 3.1%, impacted by slow regulatory transitions and reliance on traditional acidifiers. BRICS economies are driving growth through intensive livestock systems and functional nutrition mandates, while OECD industries exhibit plateauing demand linked to mature feed manufacturing practices and cost-performance constraints.

In-depth Analysis of Butyrate Additives Market in India

The butyrate additives market in India is forecasted to rise at a CAGR of 4.4% between 2025 and 2035. This growth is fueled by an expanding livestock industry, particularly in poultry and swine farming. With rising health awareness, the demand for functional feed additives that enhance gut health is increasing. The regulatory environment is becoming more conducive to the adoption of bio-based additives, encouraging green practices in animal husbandry. Local players are focusing on cost-effective, tailored solutions to meet the needs of small and medium-sized poultry farms.

  • 35% of butyrate supplement sales are from the poultry sector in 2028
  • Local suppliers are targeting mid-sized farms with cost-efficient products
  • Over 40% of new product launches emphasize gut health benefits

Sales Analysis of Butyrate Additives Market in China

Demand for butyrate additives in China is expected to expand at a CAGR of 3.8% from 2025 to 2035. The market is driven by the country’s extensive livestock sector and a heightened focus on animal health. The demand for these additives in China is particularly strong within the poultry and swine segments, which are seeking solutions to enhance productivity and health. Domestic manufacturers are increasingly formulating products to meet the needs of the growing number of bio-secure farms, while international suppliers dominate the e-commerce channel.

  • Swine feed accounts for 45% of butyrate additive demand in 2029
  • Local brands are innovating with tailored additives for bio-secure farms
  • 50% of butyrate product launches feature enhanced gut health claims

Demand Outlook for Butyrate Additives Market in the United States

The U.S. butyrate additives market is projected to grow at a CAGR of 3.4% from 2025 to 2035. The demand is primarily driven by innovations in animal feed, with a focus on optimizing gut health and improving feed efficiency. U.S. poultry and cattle farms are the primary consumers of butyrate supplements, as they seek eco-friednly and cost-effective solutions for high productivity. The trend toward natural and organic feed additives is also gaining traction among consumers, especially in the premium sector.

  • Over 55% of the industry growth comes from poultry and cattle feed
  • The trend of organic feed additives is expected to rise by 30% by 2030
  • More than 40% of new butyrate product launches feature organic certifications

Opportunity Analysis of Butyrate Additives Market in Australia

Demand for butyrate additives in Australia is growing at a CAGR of 3.4% through 2035. The Australian agricultural sector places a strong emphasis on environmental responsibility, driving the demand for natural feed additives like butyrate. With the country’s focus on export-quality meat and dairy products, there is increasing use of butyrate supplements to improve animal health and productivity. The growing trend of urbanization and increased animal product consumption is fostering a higher demand for functional feed solutions in both poultry and livestock farming.

  • 38% of butyrate products are used in poultry feed by 2028
  • 25% of Australian farms are expected to adopt eco-friendly feed solutions by 2030
  • The demand for organic and bio-based butyrate products is growing at 7% annually

Demand Analysis for Butyrate Additives Market in Brazil

Sales of butyrate additives in Brazilare expanding at a CAGR of 3.1% through 2035. The prominence in poultry and beef production is a significant driver of demand for butyrate supplements, which enhance gut health and feed efficiency. The country’s focus on increasing meat exports to international markets is leading to greater adoption of additives that improve overall livestock performance. Local manufacturers are focusing on providing affordable, effective additives suited to Brazil’s diverse farming environment, especially in secondary cities.

  • Poultry feed accounts for over 45% of the industry share by 2029
  • Veterinary clinics are increasingly recommending butyrate supplements for disease prevention
  • Local formulations are being developed to cater to small and medium-sized farms across Brazil

Leading Players in Butyrate Additives Market

The butyrate additives industry is dominated by key players with strong portfolios and innovation. Perstorp Group is a leader with its Glycare® and ProPhorce™ SR, which focus on gut health and feed efficiency. Novus International follows closely with products like Next Enhance® and Activate® DA, targeting improved animal performance.

ADDCON GmbH is strengthening its market presence with ADDCON Butyrate and Formi®, offering solutions to enhance livestock productivity. Kemin Industries leads in the formulation of ButiPearl™ and EnteroPearl™, emphasizing targeted release for improved gut health. Impextraco remains competitive with XARACOL® and its proprietary butyrate additives, focusing on improving feed conversion and animal growth.
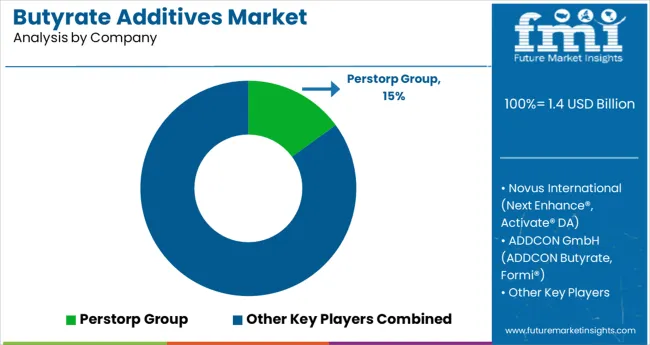
Leading Company- Perstorp Group

Butyrate Additives Market Analysis By Company

Recent Industry News

  • In May 2025, Kemin Industries launched BACTAN™, a water-soluble feed additive designed to enhance gut health and feed efficiency in livestock.This product underscores Kemin's commitment to innovation in animal nutrition
  • Palital Feed Additives continues to specialize in high-end additives, particularly coated butyrates, gradual release urea, enzymes, and essential oils. Their focus remains on providing advanced solutions for animal nutrition.

Leading Companies in Butyrate Additives Market

  • Perstorp Group (Glycare®, ProPhorce™ SR)
  • Novus International (Next Enhance®, Activate® DA)
  • ADDCON GmbH (ADDCON Butyrate, Formi®)
  • Kemin Industries (ButiPearl™, EnteroPearl™)
  • Impextraco (XARACOL®, Impextraco Butyrates)

Research Coverage and Scope Summary

Report Attributes Details
Market Size (2025) USD 1.4 billion
Projected Market Size (2035) USD 1.9 billion
CAGR (2025 to 2035) 3.7%
Base Year for Estimation 2024
Historical Period 2020 to 2024
Projections Period 2025 to 2035
Quantitative Units USD billion for value and thousand metric tons for volume
Product Types Analyzed (Segment 1) Sodium Butyrate, Calcium Butyrate, Coated Butyrates, Tributyrin, Butyric Acid Blends
Form Types Analyzed (Segment 2) Powder, Granular, Liquid, Encapsulated
Animal Types Analyzed (Segment 3) Poultry, Swine, Ruminants, Aquaculture, Pets
Functionalities Analyzed (Segment 4) Gut Health Enhancer, Anti-inflammatory Agent, Growth Promoter, Feed Efficiency Booster, Pathogen Inhibitor
Sales Channels Analyzed (Segment 5) Direct Sales (B2B), Distributors, E-commerce (bulk feed additives)
Coating Technologies Analyzed (Segment 6) Lipid Coated, pH-Sensitive Coated, Polymer Matrix Encapsulated, Slow-Release Microencapsulation
End Use Applications Analyzed (Segment 7) Compound Feed, Premixes, Specialty Nutrition Products, Veterinary Supplements
Regions Covered North America, Europe, Latin America, East Asia, South Asia & Pacific, Middle East & Africa
Countries Covered United States, Canada, Germany, United Kingdom, France, Italy, Spain, China, India, Japan, South Korea, Australia, Brazil, Mexico, Argentina, Saudi Arabia, UAE, South Africa
Key Players Perstorp Group (Glycare®, ProPhorce™ SR), Novus International (Next Enhance®, Activate® DA), ADDCON GmbH (ADDCON Butyrate, Formi®), Kemin Industries (ButiPearl™, EnteroPearl™), Impextraco (XARACOL®, Impextraco Butyrates)
Additional Attributes Dollar sales, share by coating and product type, growing demand in poultry and swine nutrition, rise in encapsulated feed solutions, expanding role of butyrates in pathogen control across feed channels

Key Segments

By Product Type:

The segment is categorized into Sodium Butyrate, Calcium Butyrate, Coated Butyrates, Tributyrin, and Butyric Acid Blends.

By Form Type:

This includes Powder, Granular, Liquid, and Encapsulated forms.

By Animal Type:

The segment covers Poultry, Swine, Ruminants, Aquaculture, and Pets.

By Functionality:

This segment is categorized into Gut Health Enhancer, Anti-inflammatory Agent, Growth Promoter, Feed Efficiency Booster, and Pathogen Inhibitor.

By Sales Channel:

The industry is segmented into Direct Sales (B2B), Distributors, and E-commerce (bulk feed additives).

By Coating Technology:

The segment covers Lipid Coated, pH-Sensitive Coated, Polymer Matrix Encapsulated, and Slow-Release Microencapsulation.

By End Use Application:

This includes Compound Feed, Premixes, Specialty Nutrition Products, and Veterinary Supplements.

By Region:

Regional analysis includes North America, Europe, Latin America, East Asia, South Asia & Pacific, and Middle East & Africa.

Table of Content

  1. Executive Summary
    • Global Market Outlook
    • Demand-side Trends
    • Supply-side Trends
    • Technology Roadmap Analysis
    • Analysis and Recommendations
  2. Market Overview
    • Market Coverage / Taxonomy
    • Market Definition / Scope / Limitations
  3. Market Background
    • Market Dynamics
      • Drivers
      • Restraints
      • Opportunity
      • Trends
    • Scenario Forecast
      • Demand in Optimistic Scenario
      • Demand in Likely Scenario
      • Demand in Conservative Scenario
    • Opportunity Map Analysis
    • Product Life Cycle Analysis
    • Supply Chain Analysis
      • Supply Side Participants and their Roles
        • Producers
        • Mid-Level Participants (Traders/ Agents/ Brokers)
        • Wholesalers and Distributors
      • Value Added and Value Created at Node in the Supply Chain
      • List of Raw Material Suppliers
      • List of Existing and Potential Buyer’s
    • Investment Feasibility Matrix
    • Value Chain Analysis
      • Profit Margin Analysis
      • Wholesalers and Distributors
      • Retailers
    • PESTLE and Porter’s Analysis
    • Regulatory Landscape
      • By Key Regions
      • By Key Countries
    • Regional Parent Market Outlook
    • Production and Consumption Statistics
    • Import and Export Statistics
  4. Global Market Analysis 2020 to 2024 and Forecast, 2025 to 2035
    • Historical Market Size Value (USD Billion) & Volume (Thousand Metric Tons) Analysis, 2020 to 2024
    • Current and Future Market Size Value (USD Billion) & Volume (Thousand Metric Tons) Projections, 2025 to 2035
      • Y-o-Y Growth Trend Analysis
      • Absolute $ Opportunity Analysis
  5. Global Market Analysis Pricing Analysis 2020 to 2024 and Forecast 2025 to 2035
  6. Global Market Analysis 2020 to 2024 and Forecast 2025 to 2035, By Product Type
    • Introduction / Key Findings
    • Historical Market Size Value (USD Billion) & Volume (Thousand Metric Tons) Analysis By Product Type, 2020 to 2024
    • Current and Future Market Size Value (USD Billion) & Volume (Thousand Metric Tons) Analysis and Forecast By Product Type, 2025 to 2035
      • Sodium Butyrate
      • Calcium Butyrate
      • Coated Butyrates
      • Tributyrin
      • Butyric Acid Blends
    • Y-o-Y Growth Trend Analysis By Product Type, 2020 to 2024
    • Absolute $ Opportunity Analysis By Product Type, 2025 to 2035
  7. Global Market Analysis 2020 to 2024 and Forecast 2025 to 2035, By Form
    • Introduction / Key Findings
    • Historical Market Size Value (USD Billion) & Volume (Thousand Metric Tons) Analysis By Form, 2020 to 2024
    • Current and Future Market Size Value (USD Billion) & Volume (Thousand Metric Tons) Analysis and Forecast By Form, 2025 to 2035
      • Powder
      • Granular
      • Liquid
      • Encapsulated
    • Y-o-Y Growth Trend Analysis By Form, 2020 to 2024
    • Absolute $ Opportunity Analysis By Form, 2025 to 2035
  8. Global Market Analysis 2020 to 2024 and Forecast 2025 to 2035, By Animal Type
    • Introduction / Key Findings
    • Historical Market Size Value (USD Billion) & Volume (Thousand Metric Tons) Analysis By Animal Type, 2020 to 2024
    • Current and Future Market Size Value (USD Billion) & Volume (Thousand Metric Tons) Analysis and Forecast By Animal Type, 2025 to 2035
      • Poultry
      • Swine
      • Ruminants
      • Aquaculture
      • Pets
    • Y-o-Y Growth Trend Analysis By Animal Type, 2020 to 2024
    • Absolute $ Opportunity Analysis By Animal Type, 2025 to 2035
  9. Global Market Analysis 2020 to 2024 and Forecast 2025 to 2035, By Functionality
    • Introduction / Key Findings
    • Historical Market Size Value (USD Billion) & Volume (Thousand Metric Tons) Analysis By Functionality, 2020 to 2024
    • Current and Future Market Size Value (USD Billion) & Volume (Thousand Metric Tons) Analysis and Forecast By Functionality, 2025 to 2035
      • Gut Health Enhancer
      • Anti-inflammatory Agent
      • Growth Promoter
      • Feed Efficiency Booster
      • Pathogen Inhibitor
    • Y-o-Y Growth Trend Analysis By Functionality, 2020 to 2024
    • Absolute $ Opportunity Analysis By Functionality, 2025 to 2035
  10. Global Market Analysis 2020 to 2024 and Forecast 2025 to 2035, By Sales Channel
    • Introduction / Key Findings
    • Historical Market Size Value (USD Billion) & Volume (Thousand Metric Tons) Analysis By Sales Channel, 2020 to 2024
    • Current and Future Market Size Value (USD Billion) & Volume (Thousand Metric Tons) Analysis and Forecast By Sales Channel, 2025 to 2035
      • Direct Sales (B2B)
      • Distributors
      • E-commerce (bulk feed additives)
    • Y-o-Y Growth Trend Analysis By Sales Channel, 2020 to 2024
    • Absolute $ Opportunity Analysis By Sales Channel, 2025 to 2035
  11. Global Market Analysis 2020 to 2024 and Forecast 2025 to 2035, By Coating Technology
    • Introduction / Key Findings
    • Historical Market Size Value (USD Billion) & Volume (Thousand Metric Tons) Analysis By Coating Technology, 2020 to 2024
    • Current and Future Market Size Value (USD Billion) & Volume (Thousand Metric Tons) Analysis and Forecast By Coating Technology, 2025 to 2035
      • Lipid Coated
      • pH-Sensitive Coated
      • Polymer Matrix Encapsulated
      • Slow-Release Microencapsulation
    • Y-o-Y Growth Trend Analysis By Coating Technology, 2020 to 2024
    • Absolute $ Opportunity Analysis By Coating Technology, 2025 to 2035
  12. Global Market Analysis 2020 to 2024 and Forecast 2025 to 2035, By End Use Application
    • Introduction / Key Findings
    • Historical Market Size Value (USD Billion) & Volume (Thousand Metric Tons) Analysis By End Use Application, 2020 to 2024
    • Current and Future Market Size Value (USD Billion) & Volume (Thousand Metric Tons) Analysis and Forecast By End Use Application, 2025 to 2035
      • Compound Feed
      • Premixes
      • Specialty Nutrition Products
      • Veterinary Supplements
    • Y-o-Y Growth Trend Analysis By End Use Application, 2020 to 2024
    • Absolute $ Opportunity Analysis By End Use Application, 2025 to 2035
  13. Global Market Analysis 2020 to 2024 and Forecast 2025 to 2035, By Region
    • Introduction
    • Historical Market Size Value (USD Billion) & Volume (Thousand Metric Tons) Analysis By Region, 2020 to 2024
    • Current Market Size Value (USD Billion) & Volume (Thousand Metric Tons) Analysis and Forecast By Region, 2025 to 2035
      • North America
      • Latin America
      • Western Europe
      • Eastern Europe
      • East Asia
      • South Asia & Pacific
      • Middle East and Africa
    • Market Attractiveness Analysis By Region
  14. North America Market Analysis 2020 to 2024 and Forecast 2025 to 2035, By Country
    • Historical Market Size Value (USD Billion) & Volume (Thousand Metric Tons) Trend Analysis By Market Taxonomy, 2020 to 2024
    • Market Size Value (USD Billion) & Volume (Thousand Metric Tons) Forecast By Market Taxonomy, 2025 to 2035
      • By Country
        • U.S.
        • Canada
        • Mexico
      • By Product Type
      • By Form
      • By Animal Type
      • By Functionality
      • By Sales Channel
      • By Coating Technology
      • By End Use Application
    • Market Attractiveness Analysis
      • By Country
      • By Product Type
      • By Form
      • By Animal Type
      • By Functionality
      • By Sales Channel
      • By Coating Technology
      • By End Use Application
    • Key Takeaways
  15. Latin America Market Analysis 2020 to 2024 and Forecast 2025 to 2035, By Country
    • Historical Market Size Value (USD Billion) & Volume (Thousand Metric Tons) Trend Analysis By Market Taxonomy, 2020 to 2024
    • Market Size Value (USD Billion) & Volume (Thousand Metric Tons) Forecast By Market Taxonomy, 2025 to 2035
      • By Country
        • Brazil
        • Argentina
        • Rest of LATAM
      • By Product Type
      • By Form
      • By Animal Type
      • By Functionality
      • By Sales Channel
      • By Coating Technology
      • By End Use Application
    • Market Attractiveness Analysis
      • By Country
      • By Product Type
      • By Form
      • By Animal Type
      • By Functionality
      • By Sales Channel
      • By Coating Technology
      • By End Use Application
    • Key Takeaways
  16. Western Europe Market Analysis 2020 to 2024 and Forecast 2025 to 2035, By Country
    • Historical Market Size Value (USD Billion) & Volume (Thousand Metric Tons) Trend Analysis By Market Taxonomy, 2020 to 2024
    • Market Size Value (USD Billion) & Volume (Thousand Metric Tons) Forecast By Market Taxonomy, 2025 to 2035
      • By Country
        • Germany
        • Italy
        • France
        • UK
        • Spain
        • BENELUX
        • Nordic
        • Rest of W.Europe
      • By Product Type
      • By Form
      • By Animal Type
      • By Functionality
      • By Sales Channel
      • By Coating Technology
      • By End Use Application
    • Market Attractiveness Analysis
      • By Country
      • By Product Type
      • By Form
      • By Animal Type
      • By Functionality
      • By Sales Channel
      • By Coating Technology
      • By End Use Application
    • Key Takeaways
  17. Eastern Europe Market Analysis 2020 to 2024 and Forecast 2025 to 2035, By Country
    • Historical Market Size Value (USD Billion) & Volume (Thousand Metric Tons) Trend Analysis By Market Taxonomy, 2020 to 2024
    • Market Size Value (USD Billion) & Volume (Thousand Metric Tons) Forecast By Market Taxonomy, 2025 to 2035
      • By Country
        • Russia
        • Hungary
        • Poland
        • Balkan & Baltics
        • Rest of E. Europe
      • By Product Type
      • By Form
      • By Animal Type
      • By Functionality
      • By Sales Channel
      • By Coating Technology
      • By End Use Application
    • Market Attractiveness Analysis
      • By Country
      • By Product Type
      • By Form
      • By Animal Type
      • By Functionality
      • By Sales Channel
      • By Coating Technology
      • By End Use Application
    • Key Takeaways
  18. East Asia Market Analysis 2020 to 2024 and Forecast 2025 to 2035, By Country
    • Historical Market Size Value (USD Billion) & Volume (Thousand Metric Tons) Trend Analysis By Market Taxonomy, 2020 to 2024
    • Market Size Value (USD Billion) & Volume (Thousand Metric Tons) Forecast By Market Taxonomy, 2025 to 2035
      • By Country
        • China
        • Japan
        • South Korea
      • By Product Type
      • By Form
      • By Animal Type
      • By Functionality
      • By Sales Channel
      • By Coating Technology
      • By End Use Application
    • Market Attractiveness Analysis
      • By Country
      • By Product Type
      • By Form
      • By Animal Type
      • By Functionality
      • By Sales Channel
      • By Coating Technology
      • By End Use Application
    • Key Takeaways
  19. South Asia & Pacific Market Analysis 2020 to 2024 and Forecast 2025 to 2035, By Country
    • Historical Market Size Value (USD Billion) & Volume (Thousand Metric Tons) Trend Analysis By Market Taxonomy, 2020 to 2024
    • Market Size Value (USD Billion) & Volume (Thousand Metric Tons) Forecast By Market Taxonomy, 2025 to 2035
      • By Country
        • India
        • Australia & New Zealand
        • ASEAN
        • Rest of SAP
      • By Product Type
      • By Form
      • By Animal Type
      • By Functionality
      • By Sales Channel
      • By Coating Technology
      • By End Use Application
    • Market Attractiveness Analysis
      • By Country
      • By Product Type
      • By Form
      • By Animal Type
      • By Functionality
      • By Sales Channel
      • By Coating Technology
      • By End Use Application
    • Key Takeaways
  20. Middle East and Africa Market Analysis 2020 to 2024 and Forecast 2025 to 2035, By Country
    • Historical Market Size Value (USD Billion) & Volume (Thousand Metric Tons) Trend Analysis By Market Taxonomy, 2020 to 2024
    • Market Size Value (USD Billion) & Volume (Thousand Metric Tons) Forecast By Market Taxonomy, 2025 to 2035
      • By Country
        • GCC Countries
        • Northern Africa
        • South Africa
        • Turkiye
        • Rest of MEA
      • By Product Type
      • By Form
      • By Animal Type
      • By Functionality
      • By Sales Channel
      • By Coating Technology
      • By End Use Application
    • Market Attractiveness Analysis
      • By Country
      • By Product Type
      • By Form
      • By Animal Type
      • By Functionality
      • By Sales Channel
      • By Coating Technology
      • By End Use Application
    • Key Takeaways
  21. Key Countries Market Analysis
    • U.S.
      • Pricing Analysis
      • Market Share Analysis, 2024
        • By Product Type
        • By Form
        • By Animal Type
        • By Functionality
        • By Sales Channel
        • By Coating Technology
        • By End Use Application
    • Canada
      • Pricing Analysis
      • Market Share Analysis, 2024
        • By Product Type
        • By Form
        • By Animal Type
        • By Functionality
        • By Sales Channel
        • By Coating Technology
        • By End Use Application
    • Brazil
      • Pricing Analysis
      • Market Share Analysis, 2024
        • By Product Type
        • By Form
        • By Animal Type
        • By Functionality
        • By Sales Channel
        • By Coating Technology
        • By End Use Application
    • Mexico
      • Pricing Analysis
      • Market Share Analysis, 2024
        • By Product Type
        • By Form
        • By Animal Type
        • By Functionality
        • By Sales Channel
        • By Coating Technology
        • By End Use Application
    • Argentina
      • Pricing Analysis
      • Market Share Analysis, 2024
        • By Product Type
        • By Form
        • By Animal Type
        • By Functionality
        • By Sales Channel
        • By Coating Technology
        • By End Use Application
  22. Market Structure Analysis
    • Competition Dashboard
    • Competition Benchmarking
    • Market Share Analysis of Top Players
      • By Regional
      • By Product Type
      • By Form
      • By Animal Type
      • By Functionality
      • By Sales Channel
      • By Coating Technology
      • By End Use Application
  23. Competition Analysis
    • Competition Deep Dive
      • Perstorp Group (Glycare®, ProPhorce™ SR)
        • Overview
        • Product Portfolio
        • Profitability by Market Segments (Product/Age /Sales Channel/Region)
        • Sales Footprint
        • Strategy Overview
          • Marketing Strategy
          • Product Strategy
          • Channel Strategy
      • Novus International (Next Enhance®, Activate® DA)
        • Overview
        • Product Portfolio
        • Profitability by Market Segments (Product/Age /Sales Channel/Region)
        • Sales Footprint
        • Strategy Overview
          • Marketing Strategy
          • Product Strategy
          • Channel Strategy
      • ADDCON GmbH (ADDCON Butyrate, Formi®)
        • Overview
        • Product Portfolio
        • Profitability by Market Segments (Product/Age /Sales Channel/Region)
        • Sales Footprint
        • Strategy Overview
          • Marketing Strategy
          • Product Strategy
          • Channel Strategy
      • Kemin Industries (ButiPearl™, EnteroPearl™)
        • Overview
        • Product Portfolio
        • Profitability by Market Segments (Product/Age /Sales Channel/Region)
        • Sales Footprint
        • Strategy Overview
          • Marketing Strategy
          • Product Strategy
          • Channel Strategy
      • Impextraco (XARACOL®, Impextraco Butyrates)
        • Overview
        • Product Portfolio
        • Profitability by Market Segments (Product/Age /Sales Channel/Region)
        • Sales Footprint
        • Strategy Overview
          • Marketing Strategy
          • Product Strategy
          • Channel Strategy
  24. Assumptions & Acronyms Used
  25. Research Methodology

List of Tables

  • Table 1: Global Market Analysis Value (USD Billion) Forecast by Region, 2020-2035
  • Table 2: Global Market Analysis Volume (Thousand Metric Tons) Forecast by Region, 2020-2035
  • Table 3: Global Market Analysis Value (USD Billion) Forecast by Product Type, 2020-2035
  • Table 4: Global Market Analysis Volume (Thousand Metric Tons) Forecast by Product Type, 2020-2035
  • Table 5: Global Market Analysis Value (USD Billion) Forecast by Form, 2020-2035
  • Table 6: Global Market Analysis Volume (Thousand Metric Tons) Forecast by Form, 2020-2035
  • Table 7: Global Market Analysis Value (USD Billion) Forecast by Animal Type, 2020-2035
  • Table 8: Global Market Analysis Volume (Thousand Metric Tons) Forecast by Animal Type, 2020-2035
  • Table 9: Global Market Analysis Value (USD Billion) Forecast by Functionality, 2020-2035
  • Table 10: Global Market Analysis Volume (Thousand Metric Tons) Forecast by Functionality, 2020-2035
  • Table 11: Global Market Analysis Value (USD Billion) Forecast by Sales Channel, 2020-2035
  • Table 12: Global Market Analysis Volume (Thousand Metric Tons) Forecast by Sales Channel, 2020-2035
  • Table 13: Global Market Analysis Value (USD Billion) Forecast by Coating Technology, 2020-2035
  • Table 14: Global Market Analysis Volume (Thousand Metric Tons) Forecast by Coating Technology, 2020-2035
  • Table 15: Global Market Analysis Value (USD Billion) Forecast by End Use Application, 2020-2035
  • Table 16: Global Market Analysis Volume (Thousand Metric Tons) Forecast by End Use Application, 2020-2035
  • Table 17: North America Market Analysis Value (USD Billion) Forecast by Country, 2020-2035
  • Table 18: North America Market Analysis Volume (Thousand Metric Tons) Forecast by Country, 2020-2035
  • Table 19: North America Market Analysis Value (USD Billion) Forecast by Product Type, 2020-2035
  • Table 20: North America Market Analysis Volume (Thousand Metric Tons) Forecast by Product Type, 2020-2035
  • Table 21: North America Market Analysis Value (USD Billion) Forecast by Form, 2020-2035
  • Table 22: North America Market Analysis Volume (Thousand Metric Tons) Forecast by Form, 2020-2035
  • Table 23: North America Market Analysis Value (USD Billion) Forecast by Animal Type, 2020-2035
  • Table 24: North America Market Analysis Volume (Thousand Metric Tons) Forecast by Animal Type, 2020-2035
  • Table 25: North America Market Analysis Value (USD Billion) Forecast by Functionality, 2020-2035
  • Table 26: North America Market Analysis Volume (Thousand Metric Tons) Forecast by Functionality, 2020-2035
  • Table 27: North America Market Analysis Value (USD Billion) Forecast by Sales Channel, 2020-2035
  • Table 28: North America Market Analysis Volume (Thousand Metric Tons) Forecast by Sales Channel, 2020-2035
  • Table 29: North America Market Analysis Value (USD Billion) Forecast by Coating Technology, 2020-2035
  • Table 30: North America Market Analysis Volume (Thousand Metric Tons) Forecast by Coating Technology, 2020-2035
  • Table 31: North America Market Analysis Value (USD Billion) Forecast by End Use Application, 2020-2035
  • Table 32: North America Market Analysis Volume (Thousand Metric Tons) Forecast by End Use Application, 2020-2035
  • Table 33: Latin America Market Analysis Value (USD Billion) Forecast by Country, 2020-2035
  • Table 34: Latin America Market Analysis Volume (Thousand Metric Tons) Forecast by Country, 2020-2035
  • Table 35: Latin America Market Analysis Value (USD Billion) Forecast by Product Type, 2020-2035
  • Table 36: Latin America Market Analysis Volume (Thousand Metric Tons) Forecast by Product Type, 2020-2035
  • Table 37: Latin America Market Analysis Value (USD Billion) Forecast by Form, 2020-2035
  • Table 38: Latin America Market Analysis Volume (Thousand Metric Tons) Forecast by Form, 2020-2035
  • Table 39: Latin America Market Analysis Value (USD Billion) Forecast by Animal Type, 2020-2035
  • Table 40: Latin America Market Analysis Volume (Thousand Metric Tons) Forecast by Animal Type, 2020-2035
  • Table 41: Latin America Market Analysis Value (USD Billion) Forecast by Functionality, 2020-2035
  • Table 42: Latin America Market Analysis Volume (Thousand Metric Tons) Forecast by Functionality, 2020-2035
  • Table 43: Latin America Market Analysis Value (USD Billion) Forecast by Sales Channel, 2020-2035
  • Table 44: Latin America Market Analysis Volume (Thousand Metric Tons) Forecast by Sales Channel, 2020-2035
  • Table 45: Latin America Market Analysis Value (USD Billion) Forecast by Coating Technology, 2020-2035
  • Table 46: Latin America Market Analysis Volume (Thousand Metric Tons) Forecast by Coating Technology, 2020-2035
  • Table 47: Latin America Market Analysis Value (USD Billion) Forecast by End Use Application, 2020-2035
  • Table 48: Latin America Market Analysis Volume (Thousand Metric Tons) Forecast by End Use Application, 2020-2035
  • Table 49: Western Europe Market Analysis Value (USD Billion) Forecast by Country, 2020-2035
  • Table 50: Western Europe Market Analysis Volume (Thousand Metric Tons) Forecast by Country, 2020-2035
  • Table 51: Western Europe Market Analysis Value (USD Billion) Forecast by Product Type, 2020-2035
  • Table 52: Western Europe Market Analysis Volume (Thousand Metric Tons) Forecast by Product Type, 2020-2035
  • Table 53: Western Europe Market Analysis Value (USD Billion) Forecast by Form, 2020-2035
  • Table 54: Western Europe Market Analysis Volume (Thousand Metric Tons) Forecast by Form, 2020-2035
  • Table 55: Western Europe Market Analysis Value (USD Billion) Forecast by Animal Type, 2020-2035
  • Table 56: Western Europe Market Analysis Volume (Thousand Metric Tons) Forecast by Animal Type, 2020-2035
  • Table 57: Western Europe Market Analysis Value (USD Billion) Forecast by Functionality, 2020-2035
  • Table 58: Western Europe Market Analysis Volume (Thousand Metric Tons) Forecast by Functionality, 2020-2035
  • Table 59: Western Europe Market Analysis Value (USD Billion) Forecast by Sales Channel, 2020-2035
  • Table 60: Western Europe Market Analysis Volume (Thousand Metric Tons) Forecast by Sales Channel, 2020-2035
  • Table 61: Western Europe Market Analysis Value (USD Billion) Forecast by Coating Technology, 2020-2035
  • Table 62: Western Europe Market Analysis Volume (Thousand Metric Tons) Forecast by Coating Technology, 2020-2035
  • Table 63: Western Europe Market Analysis Value (USD Billion) Forecast by End Use Application, 2020-2035
  • Table 64: Western Europe Market Analysis Volume (Thousand Metric Tons) Forecast by End Use Application, 2020-2035
  • Table 65: Eastern Europe Market Analysis Value (USD Billion) Forecast by Country, 2020-2035
  • Table 66: Eastern Europe Market Analysis Volume (Thousand Metric Tons) Forecast by Country, 2020-2035
  • Table 67: Eastern Europe Market Analysis Value (USD Billion) Forecast by Product Type, 2020-2035
  • Table 68: Eastern Europe Market Analysis Volume (Thousand Metric Tons) Forecast by Product Type, 2020-2035
  • Table 69: Eastern Europe Market Analysis Value (USD Billion) Forecast by Form, 2020-2035
  • Table 70: Eastern Europe Market Analysis Volume (Thousand Metric Tons) Forecast by Form, 2020-2035
  • Table 71: Eastern Europe Market Analysis Value (USD Billion) Forecast by Animal Type, 2020-2035
  • Table 72: Eastern Europe Market Analysis Volume (Thousand Metric Tons) Forecast by Animal Type, 2020-2035
  • Table 73: Eastern Europe Market Analysis Value (USD Billion) Forecast by Functionality, 2020-2035
  • Table 74: Eastern Europe Market Analysis Volume (Thousand Metric Tons) Forecast by Functionality, 2020-2035
  • Table 75: Eastern Europe Market Analysis Value (USD Billion) Forecast by Sales Channel, 2020-2035
  • Table 76: Eastern Europe Market Analysis Volume (Thousand Metric Tons) Forecast by Sales Channel, 2020-2035
  • Table 77: Eastern Europe Market Analysis Value (USD Billion) Forecast by Coating Technology, 2020-2035
  • Table 78: Eastern Europe Market Analysis Volume (Thousand Metric Tons) Forecast by Coating Technology, 2020-2035
  • Table 79: Eastern Europe Market Analysis Value (USD Billion) Forecast by End Use Application, 2020-2035
  • Table 80: Eastern Europe Market Analysis Volume (Thousand Metric Tons) Forecast by End Use Application, 2020-2035
  • Table 81: East Asia Market Analysis Value (USD Billion) Forecast by Country, 2020-2035
  • Table 82: East Asia Market Analysis Volume (Thousand Metric Tons) Forecast by Country, 2020-2035
  • Table 83: East Asia Market Analysis Value (USD Billion) Forecast by Product Type, 2020-2035
  • Table 84: East Asia Market Analysis Volume (Thousand Metric Tons) Forecast by Product Type, 2020-2035
  • Table 85: East Asia Market Analysis Value (USD Billion) Forecast by Form, 2020-2035
  • Table 86: East Asia Market Analysis Volume (Thousand Metric Tons) Forecast by Form, 2020-2035
  • Table 87: East Asia Market Analysis Value (USD Billion) Forecast by Animal Type, 2020-2035
  • Table 88: East Asia Market Analysis Volume (Thousand Metric Tons) Forecast by Animal Type, 2020-2035
  • Table 89: East Asia Market Analysis Value (USD Billion) Forecast by Functionality, 2020-2035
  • Table 90: East Asia Market Analysis Volume (Thousand Metric Tons) Forecast by Functionality, 2020-2035
  • Table 91: East Asia Market Analysis Value (USD Billion) Forecast by Sales Channel, 2020-2035
  • Table 92: East Asia Market Analysis Volume (Thousand Metric Tons) Forecast by Sales Channel, 2020-2035
  • Table 93: East Asia Market Analysis Value (USD Billion) Forecast by Coating Technology, 2020-2035
  • Table 94: East Asia Market Analysis Volume (Thousand Metric Tons) Forecast by Coating Technology, 2020-2035
  • Table 95: East Asia Market Analysis Value (USD Billion) Forecast by End Use Application, 2020-2035
  • Table 96: East Asia Market Analysis Volume (Thousand Metric Tons) Forecast by End Use Application, 2020-2035
  • Table 97: South Asia & Pacific Market Analysis Value (USD Billion) Forecast by Country, 2020-2035
  • Table 98: South Asia & Pacific Market Analysis Volume (Thousand Metric Tons) Forecast by Country, 2020-2035
  • Table 99: South Asia & Pacific Market Analysis Value (USD Billion) Forecast by Product Type, 2020-2035
  • Table 100: South Asia & Pacific Market Analysis Volume (Thousand Metric Tons) Forecast by Product Type, 2020-2035
  • Table 101: South Asia & Pacific Market Analysis Value (USD Billion) Forecast by Form, 2020-2035
  • Table 102: South Asia & Pacific Market Analysis Volume (Thousand Metric Tons) Forecast by Form, 2020-2035
  • Table 103: South Asia & Pacific Market Analysis Value (USD Billion) Forecast by Animal Type, 2020-2035
  • Table 104: South Asia & Pacific Market Analysis Volume (Thousand Metric Tons) Forecast by Animal Type, 2020-2035
  • Table 105: South Asia & Pacific Market Analysis Value (USD Billion) Forecast by Functionality, 2020-2035
  • Table 106: South Asia & Pacific Market Analysis Volume (Thousand Metric Tons) Forecast by Functionality, 2020-2035
  • Table 107: South Asia & Pacific Market Analysis Value (USD Billion) Forecast by Sales Channel, 2020-2035
  • Table 108: South Asia & Pacific Market Analysis Volume (Thousand Metric Tons) Forecast by Sales Channel, 2020-2035
  • Table 109: South Asia & Pacific Market Analysis Value (USD Billion) Forecast by Coating Technology, 2020-2035
  • Table 110: South Asia & Pacific Market Analysis Volume (Thousand Metric Tons) Forecast by Coating Technology, 2020-2035
  • Table 111: South Asia & Pacific Market Analysis Value (USD Billion) Forecast by End Use Application, 2020-2035
  • Table 112: South Asia & Pacific Market Analysis Volume (Thousand Metric Tons) Forecast by End Use Application, 2020-2035
  • Table 113: Middle East and Africa Market Analysis Value (USD Billion) Forecast by Country, 2020-2035
  • Table 114: Middle East and Africa Market Analysis Volume (Thousand Metric Tons) Forecast by Country, 2020-2035
  • Table 115: Middle East and Africa Market Analysis Value (USD Billion) Forecast by Product Type, 2020-2035
  • Table 116: Middle East and Africa Market Analysis Volume (Thousand Metric Tons) Forecast by Product Type, 2020-2035
  • Table 117: Middle East and Africa Market Analysis Value (USD Billion) Forecast by Form, 2020-2035
  • Table 118: Middle East and Africa Market Analysis Volume (Thousand Metric Tons) Forecast by Form, 2020-2035
  • Table 119: Middle East and Africa Market Analysis Value (USD Billion) Forecast by Animal Type, 2020-2035
  • Table 120: Middle East and Africa Market Analysis Volume (Thousand Metric Tons) Forecast by Animal Type, 2020-2035
  • Table 121: Middle East and Africa Market Analysis Value (USD Billion) Forecast by Functionality, 2020-2035
  • Table 122: Middle East and Africa Market Analysis Volume (Thousand Metric Tons) Forecast by Functionality, 2020-2035
  • Table 123: Middle East and Africa Market Analysis Value (USD Billion) Forecast by Sales Channel, 2020-2035
  • Table 124: Middle East and Africa Market Analysis Volume (Thousand Metric Tons) Forecast by Sales Channel, 2020-2035
  • Table 125: Middle East and Africa Market Analysis Value (USD Billion) Forecast by Coating Technology, 2020-2035
  • Table 126: Middle East and Africa Market Analysis Volume (Thousand Metric Tons) Forecast by Coating Technology, 2020-2035
  • Table 127: Middle East and Africa Market Analysis Value (USD Billion) Forecast by End Use Application, 2020-2035
  • Table 128: Middle East and Africa Market Analysis Volume (Thousand Metric Tons) Forecast by End Use Application, 2020-2035

List of Figures

  • Figure 1: Global Market Analysis Volume (Thousand Metric Tons) Forecast 2020-2035
  • Figure 2: Global Market Analysis Pricing Analysis
  • Figure 3: Global Market Analysis Value (USD Billion) Forecast 2020-2035
  • Figure 4: Global Market Analysis Value Share and BPS Analysis by Product Type, 2025 and 2035
  • Figure 5: Global Market Analysis Y-o-Y Growth Comparison by Product Type, 2025-2035
  • Figure 6: Global Market Analysis Attractiveness Analysis by Product Type
  • Figure 7: Global Market Analysis Value Share and BPS Analysis by Form, 2025 and 2035
  • Figure 8: Global Market Analysis Y-o-Y Growth Comparison by Form, 2025-2035
  • Figure 9: Global Market Analysis Attractiveness Analysis by Form
  • Figure 10: Global Market Analysis Value Share and BPS Analysis by Animal Type, 2025 and 2035
  • Figure 11: Global Market Analysis Y-o-Y Growth Comparison by Animal Type, 2025-2035
  • Figure 12: Global Market Analysis Attractiveness Analysis by Animal Type
  • Figure 13: Global Market Analysis Value Share and BPS Analysis by Functionality, 2025 and 2035
  • Figure 14: Global Market Analysis Y-o-Y Growth Comparison by Functionality, 2025-2035
  • Figure 15: Global Market Analysis Attractiveness Analysis by Functionality
  • Figure 16: Global Market Analysis Value Share and BPS Analysis by Sales Channel, 2025 and 2035
  • Figure 17: Global Market Analysis Y-o-Y Growth Comparison by Sales Channel, 2025-2035
  • Figure 18: Global Market Analysis Attractiveness Analysis by Sales Channel
  • Figure 19: Global Market Analysis Value Share and BPS Analysis by Coating Technology, 2025 and 2035
  • Figure 20: Global Market Analysis Y-o-Y Growth Comparison by Coating Technology, 2025-2035
  • Figure 21: Global Market Analysis Attractiveness Analysis by Coating Technology
  • Figure 22: Global Market Analysis Value Share and BPS Analysis by End Use Application, 2025 and 2035
  • Figure 23: Global Market Analysis Y-o-Y Growth Comparison by End Use Application, 2025-2035
  • Figure 24: Global Market Analysis Attractiveness Analysis by End Use Application
  • Figure 25: Global Market Analysis Value (USD Billion) Share and BPS Analysis by Region, 2025 and 2035
  • Figure 26: Global Market Analysis Y-o-Y Growth Comparison by Region, 2025-2035
  • Figure 27: Global Market Analysis Attractiveness Analysis by Region
  • Figure 28: North America Market Analysis Incremental $ Opportunity, 2025-2035
  • Figure 29: Latin America Market Analysis Incremental $ Opportunity, 2025-2035
  • Figure 30: Western Europe Market Analysis Incremental $ Opportunity, 2025-2035
  • Figure 31: Eastern Europe Market Analysis Incremental $ Opportunity, 2025-2035
  • Figure 32: East Asia Market Analysis Incremental $ Opportunity, 2025-2035
  • Figure 33: South Asia & Pacific Market Analysis Incremental $ Opportunity, 2025-2035
  • Figure 34: Middle East and Africa Market Analysis Incremental $ Opportunity, 2025-2035
  • Figure 35: North America Market Analysis Value Share and BPS Analysis by Country, 2025 and 2035
  • Figure 36: North America Market Analysis Value Share and BPS Analysis by Product Type, 2025 and 2035
  • Figure 37: North America Market Analysis Y-o-Y Growth Comparison by Product Type, 2025-2035
  • Figure 38: North America Market Analysis Attractiveness Analysis by Product Type
  • Figure 39: North America Market Analysis Value Share and BPS Analysis by Form, 2025 and 2035
  • Figure 40: North America Market Analysis Y-o-Y Growth Comparison by Form, 2025-2035
  • Figure 41: North America Market Analysis Attractiveness Analysis by Form
  • Figure 42: North America Market Analysis Value Share and BPS Analysis by Animal Type, 2025 and 2035
  • Figure 43: North America Market Analysis Y-o-Y Growth Comparison by Animal Type, 2025-2035
  • Figure 44: North America Market Analysis Attractiveness Analysis by Animal Type
  • Figure 45: North America Market Analysis Value Share and BPS Analysis by Functionality, 2025 and 2035
  • Figure 46: North America Market Analysis Y-o-Y Growth Comparison by Functionality, 2025-2035
  • Figure 47: North America Market Analysis Attractiveness Analysis by Functionality
  • Figure 48: North America Market Analysis Value Share and BPS Analysis by Sales Channel, 2025 and 2035
  • Figure 49: North America Market Analysis Y-o-Y Growth Comparison by Sales Channel, 2025-2035
  • Figure 50: North America Market Analysis Attractiveness Analysis by Sales Channel
  • Figure 51: North America Market Analysis Value Share and BPS Analysis by Coating Technology, 2025 and 2035
  • Figure 52: North America Market Analysis Y-o-Y Growth Comparison by Coating Technology, 2025-2035
  • Figure 53: North America Market Analysis Attractiveness Analysis by Coating Technology
  • Figure 54: North America Market Analysis Value Share and BPS Analysis by End Use Application, 2025 and 2035
  • Figure 55: North America Market Analysis Y-o-Y Growth Comparison by End Use Application, 2025-2035
  • Figure 56: North America Market Analysis Attractiveness Analysis by End Use Application
  • Figure 57: Latin America Market Analysis Value Share and BPS Analysis by Country, 2025 and 2035
  • Figure 58: Latin America Market Analysis Value Share and BPS Analysis by Product Type, 2025 and 2035
  • Figure 59: Latin America Market Analysis Y-o-Y Growth Comparison by Product Type, 2025-2035
  • Figure 60: Latin America Market Analysis Attractiveness Analysis by Product Type
  • Figure 61: Latin America Market Analysis Value Share and BPS Analysis by Form, 2025 and 2035
  • Figure 62: Latin America Market Analysis Y-o-Y Growth Comparison by Form, 2025-2035
  • Figure 63: Latin America Market Analysis Attractiveness Analysis by Form
  • Figure 64: Latin America Market Analysis Value Share and BPS Analysis by Animal Type, 2025 and 2035
  • Figure 65: Latin America Market Analysis Y-o-Y Growth Comparison by Animal Type, 2025-2035
  • Figure 66: Latin America Market Analysis Attractiveness Analysis by Animal Type
  • Figure 67: Latin America Market Analysis Value Share and BPS Analysis by Functionality, 2025 and 2035
  • Figure 68: Latin America Market Analysis Y-o-Y Growth Comparison by Functionality, 2025-2035
  • Figure 69: Latin America Market Analysis Attractiveness Analysis by Functionality
  • Figure 70: Latin America Market Analysis Value Share and BPS Analysis by Sales Channel, 2025 and 2035
  • Figure 71: Latin America Market Analysis Y-o-Y Growth Comparison by Sales Channel, 2025-2035
  • Figure 72: Latin America Market Analysis Attractiveness Analysis by Sales Channel
  • Figure 73: Latin America Market Analysis Value Share and BPS Analysis by Coating Technology, 2025 and 2035
  • Figure 74: Latin America Market Analysis Y-o-Y Growth Comparison by Coating Technology, 2025-2035
  • Figure 75: Latin America Market Analysis Attractiveness Analysis by Coating Technology
  • Figure 76: Latin America Market Analysis Value Share and BPS Analysis by End Use Application, 2025 and 2035
  • Figure 77: Latin America Market Analysis Y-o-Y Growth Comparison by End Use Application, 2025-2035
  • Figure 78: Latin America Market Analysis Attractiveness Analysis by End Use Application
  • Figure 79: Western Europe Market Analysis Value Share and BPS Analysis by Country, 2025 and 2035
  • Figure 80: Western Europe Market Analysis Value Share and BPS Analysis by Product Type, 2025 and 2035
  • Figure 81: Western Europe Market Analysis Y-o-Y Growth Comparison by Product Type, 2025-2035
  • Figure 82: Western Europe Market Analysis Attractiveness Analysis by Product Type
  • Figure 83: Western Europe Market Analysis Value Share and BPS Analysis by Form, 2025 and 2035
  • Figure 84: Western Europe Market Analysis Y-o-Y Growth Comparison by Form, 2025-2035
  • Figure 85: Western Europe Market Analysis Attractiveness Analysis by Form
  • Figure 86: Western Europe Market Analysis Value Share and BPS Analysis by Animal Type, 2025 and 2035
  • Figure 87: Western Europe Market Analysis Y-o-Y Growth Comparison by Animal Type, 2025-2035
  • Figure 88: Western Europe Market Analysis Attractiveness Analysis by Animal Type
  • Figure 89: Western Europe Market Analysis Value Share and BPS Analysis by Functionality, 2025 and 2035
  • Figure 90: Western Europe Market Analysis Y-o-Y Growth Comparison by Functionality, 2025-2035
  • Figure 91: Western Europe Market Analysis Attractiveness Analysis by Functionality
  • Figure 92: Western Europe Market Analysis Value Share and BPS Analysis by Sales Channel, 2025 and 2035
  • Figure 93: Western Europe Market Analysis Y-o-Y Growth Comparison by Sales Channel, 2025-2035
  • Figure 94: Western Europe Market Analysis Attractiveness Analysis by Sales Channel
  • Figure 95: Western Europe Market Analysis Value Share and BPS Analysis by Coating Technology, 2025 and 2035
  • Figure 96: Western Europe Market Analysis Y-o-Y Growth Comparison by Coating Technology, 2025-2035
  • Figure 97: Western Europe Market Analysis Attractiveness Analysis by Coating Technology
  • Figure 98: Western Europe Market Analysis Value Share and BPS Analysis by End Use Application, 2025 and 2035
  • Figure 99: Western Europe Market Analysis Y-o-Y Growth Comparison by End Use Application, 2025-2035
  • Figure 100: Western Europe Market Analysis Attractiveness Analysis by End Use Application
  • Figure 101: Eastern Europe Market Analysis Value Share and BPS Analysis by Country, 2025 and 2035
  • Figure 102: Eastern Europe Market Analysis Value Share and BPS Analysis by Product Type, 2025 and 2035
  • Figure 103: Eastern Europe Market Analysis Y-o-Y Growth Comparison by Product Type, 2025-2035
  • Figure 104: Eastern Europe Market Analysis Attractiveness Analysis by Product Type
  • Figure 105: Eastern Europe Market Analysis Value Share and BPS Analysis by Form, 2025 and 2035
  • Figure 106: Eastern Europe Market Analysis Y-o-Y Growth Comparison by Form, 2025-2035
  • Figure 107: Eastern Europe Market Analysis Attractiveness Analysis by Form
  • Figure 108: Eastern Europe Market Analysis Value Share and BPS Analysis by Animal Type, 2025 and 2035
  • Figure 109: Eastern Europe Market Analysis Y-o-Y Growth Comparison by Animal Type, 2025-2035
  • Figure 110: Eastern Europe Market Analysis Attractiveness Analysis by Animal Type
  • Figure 111: Eastern Europe Market Analysis Value Share and BPS Analysis by Functionality, 2025 and 2035
  • Figure 112: Eastern Europe Market Analysis Y-o-Y Growth Comparison by Functionality, 2025-2035
  • Figure 113: Eastern Europe Market Analysis Attractiveness Analysis by Functionality
  • Figure 114: Eastern Europe Market Analysis Value Share and BPS Analysis by Sales Channel, 2025 and 2035
  • Figure 115: Eastern Europe Market Analysis Y-o-Y Growth Comparison by Sales Channel, 2025-2035
  • Figure 116: Eastern Europe Market Analysis Attractiveness Analysis by Sales Channel
  • Figure 117: Eastern Europe Market Analysis Value Share and BPS Analysis by Coating Technology, 2025 and 2035
  • Figure 118: Eastern Europe Market Analysis Y-o-Y Growth Comparison by Coating Technology, 2025-2035
  • Figure 119: Eastern Europe Market Analysis Attractiveness Analysis by Coating Technology
  • Figure 120: Eastern Europe Market Analysis Value Share and BPS Analysis by End Use Application, 2025 and 2035
  • Figure 121: Eastern Europe Market Analysis Y-o-Y Growth Comparison by End Use Application, 2025-2035
  • Figure 122: Eastern Europe Market Analysis Attractiveness Analysis by End Use Application
  • Figure 123: East Asia Market Analysis Value Share and BPS Analysis by Country, 2025 and 2035
  • Figure 124: East Asia Market Analysis Value Share and BPS Analysis by Product Type, 2025 and 2035
  • Figure 125: East Asia Market Analysis Y-o-Y Growth Comparison by Product Type, 2025-2035
  • Figure 126: East Asia Market Analysis Attractiveness Analysis by Product Type
  • Figure 127: East Asia Market Analysis Value Share and BPS Analysis by Form, 2025 and 2035
  • Figure 128: East Asia Market Analysis Y-o-Y Growth Comparison by Form, 2025-2035
  • Figure 129: East Asia Market Analysis Attractiveness Analysis by Form
  • Figure 130: East Asia Market Analysis Value Share and BPS Analysis by Animal Type, 2025 and 2035
  • Figure 131: East Asia Market Analysis Y-o-Y Growth Comparison by Animal Type, 2025-2035
  • Figure 132: East Asia Market Analysis Attractiveness Analysis by Animal Type
  • Figure 133: East Asia Market Analysis Value Share and BPS Analysis by Functionality, 2025 and 2035
  • Figure 134: East Asia Market Analysis Y-o-Y Growth Comparison by Functionality, 2025-2035
  • Figure 135: East Asia Market Analysis Attractiveness Analysis by Functionality
  • Figure 136: East Asia Market Analysis Value Share and BPS Analysis by Sales Channel, 2025 and 2035
  • Figure 137: East Asia Market Analysis Y-o-Y Growth Comparison by Sales Channel, 2025-2035
  • Figure 138: East Asia Market Analysis Attractiveness Analysis by Sales Channel
  • Figure 139: East Asia Market Analysis Value Share and BPS Analysis by Coating Technology, 2025 and 2035
  • Figure 140: East Asia Market Analysis Y-o-Y Growth Comparison by Coating Technology, 2025-2035
  • Figure 141: East Asia Market Analysis Attractiveness Analysis by Coating Technology
  • Figure 142: East Asia Market Analysis Value Share and BPS Analysis by End Use Application, 2025 and 2035
  • Figure 143: East Asia Market Analysis Y-o-Y Growth Comparison by End Use Application, 2025-2035
  • Figure 144: East Asia Market Analysis Attractiveness Analysis by End Use Application
  • Figure 145: South Asia & Pacific Market Analysis Value Share and BPS Analysis by Country, 2025 and 2035
  • Figure 146: South Asia & Pacific Market Analysis Value Share and BPS Analysis by Product Type, 2025 and 2035
  • Figure 147: South Asia & Pacific Market Analysis Y-o-Y Growth Comparison by Product Type, 2025-2035
  • Figure 148: South Asia & Pacific Market Analysis Attractiveness Analysis by Product Type
  • Figure 149: South Asia & Pacific Market Analysis Value Share and BPS Analysis by Form, 2025 and 2035
  • Figure 150: South Asia & Pacific Market Analysis Y-o-Y Growth Comparison by Form, 2025-2035
  • Figure 151: South Asia & Pacific Market Analysis Attractiveness Analysis by Form
  • Figure 152: South Asia & Pacific Market Analysis Value Share and BPS Analysis by Animal Type, 2025 and 2035
  • Figure 153: South Asia & Pacific Market Analysis Y-o-Y Growth Comparison by Animal Type, 2025-2035
  • Figure 154: South Asia & Pacific Market Analysis Attractiveness Analysis by Animal Type
  • Figure 155: South Asia & Pacific Market Analysis Value Share and BPS Analysis by Functionality, 2025 and 2035
  • Figure 156: South Asia & Pacific Market Analysis Y-o-Y Growth Comparison by Functionality, 2025-2035
  • Figure 157: South Asia & Pacific Market Analysis Attractiveness Analysis by Functionality
  • Figure 158: South Asia & Pacific Market Analysis Value Share and BPS Analysis by Sales Channel, 2025 and 2035
  • Figure 159: South Asia & Pacific Market Analysis Y-o-Y Growth Comparison by Sales Channel, 2025-2035
  • Figure 160: South Asia & Pacific Market Analysis Attractiveness Analysis by Sales Channel
  • Figure 161: South Asia & Pacific Market Analysis Value Share and BPS Analysis by Coating Technology, 2025 and 2035
  • Figure 162: South Asia & Pacific Market Analysis Y-o-Y Growth Comparison by Coating Technology, 2025-2035
  • Figure 163: South Asia & Pacific Market Analysis Attractiveness Analysis by Coating Technology
  • Figure 164: South Asia & Pacific Market Analysis Value Share and BPS Analysis by End Use Application, 2025 and 2035
  • Figure 165: South Asia & Pacific Market Analysis Y-o-Y Growth Comparison by End Use Application, 2025-2035
  • Figure 166: South Asia & Pacific Market Analysis Attractiveness Analysis by End Use Application
  • Figure 167: Middle East and Africa Market Analysis Value Share and BPS Analysis by Country, 2025 and 2035
  • Figure 168: Middle East and Africa Market Analysis Value Share and BPS Analysis by Product Type, 2025 and 2035
  • Figure 169: Middle East and Africa Market Analysis Y-o-Y Growth Comparison by Product Type, 2025-2035
  • Figure 170: Middle East and Africa Market Analysis Attractiveness Analysis by Product Type
  • Figure 171: Middle East and Africa Market Analysis Value Share and BPS Analysis by Form, 2025 and 2035
  • Figure 172: Middle East and Africa Market Analysis Y-o-Y Growth Comparison by Form, 2025-2035
  • Figure 173: Middle East and Africa Market Analysis Attractiveness Analysis by Form
  • Figure 174: Middle East and Africa Market Analysis Value Share and BPS Analysis by Animal Type, 2025 and 2035
  • Figure 175: Middle East and Africa Market Analysis Y-o-Y Growth Comparison by Animal Type, 2025-2035
  • Figure 176: Middle East and Africa Market Analysis Attractiveness Analysis by Animal Type
  • Figure 177: Middle East and Africa Market Analysis Value Share and BPS Analysis by Functionality, 2025 and 2035
  • Figure 178: Middle East and Africa Market Analysis Y-o-Y Growth Comparison by Functionality, 2025-2035
  • Figure 179: Middle East and Africa Market Analysis Attractiveness Analysis by Functionality
  • Figure 180: Middle East and Africa Market Analysis Value Share and BPS Analysis by Sales Channel, 2025 and 2035
  • Figure 181: Middle East and Africa Market Analysis Y-o-Y Growth Comparison by Sales Channel, 2025-2035
  • Figure 182: Middle East and Africa Market Analysis Attractiveness Analysis by Sales Channel
  • Figure 183: Middle East and Africa Market Analysis Value Share and BPS Analysis by Coating Technology, 2025 and 2035
  • Figure 184: Middle East and Africa Market Analysis Y-o-Y Growth Comparison by Coating Technology, 2025-2035
  • Figure 185: Middle East and Africa Market Analysis Attractiveness Analysis by Coating Technology
  • Figure 186: Middle East and Africa Market Analysis Value Share and BPS Analysis by End Use Application, 2025 and 2035
  • Figure 187: Middle East and Africa Market Analysis Y-o-Y Growth Comparison by End Use Application, 2025-2035
  • Figure 188: Middle East and Africa Market Analysis Attractiveness Analysis by End Use Application
  • Figure 189: Global Market Analysis - Tier Structure Analysis
  • Figure 190: Global Market Analysis - Company Share Analysis

Frequently Asked Questions

What is the projected industry value of the butyrate additives market in 2025?

The industry is projected to reach USD 1.4 billion in 2025.

What is the expected global CAGR for the butyrate additives market from 2025 to 2035?

The industry is expected to grow at a CAGR of 3.7% from 2025 to 2035.

Which segment is expected to dominate the butyrate additives market in 2025?

The poultry segment is expected to capture 41.1% share in 2025.

Which region is forecasted to show significant growth in the butyrate additives market by 2025?

The Asia-Pacific region, particularly India, is projected to register a CAGR of 4.4% from 2025 to 2035.

What is the forecasted industry value of the butyrate additives market by 2035?

The industry is projected to reach USD 1.9 billion by 2035.

Explore Similar Insights

Future Market Insights

Butyrate Additives Market