Refining Additives Market Size and Share Forecast Outlook 2025 to 2035

The Refining Additives Market is estimated to be valued at USD 3.4 billion in 2025 and is projected to reach USD 5.8 billion by 2035, registering a compound annual growth rate (CAGR) of 5.5% over the forecast period.
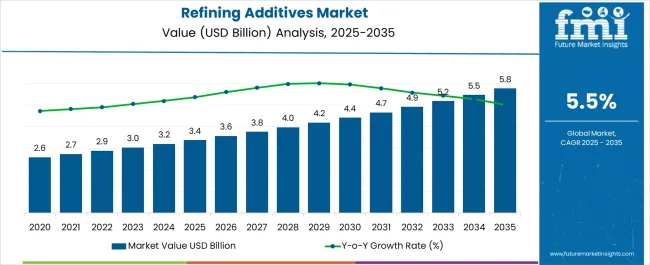
Quick Stats for Refining Additives Market

  • Refining Additives Market Value (2025): USD 3.4 billion
  • Refining Additives Market Forecast Value (2035): USD 5.8 billion
  • Refining Additives Market Forecast CAGR: 5.5%
  • Leading Segment in Refining Additives Market in 2025: Stabilizers (26.9%)
  • Key Growth Regions in Refining Additives Market: North America, Asia-Pacific, Europe
  • Top Key Players in Refining Additives Market: GE, Berkshire Hathaway, Dorf-Ketal Chemicals, Clariant, Exxon Mobil, Amspec, Evonik Industries, Albemarle, BASF, Johnson Matthey, Ecolab, Chevron, Infineum International

Refining Additives Market Market Value Analysis

Refining Additives Market Key Takeaways

Metric Value
Refining Additives Market Estimated Value in (2025 E) USD 3.4 billion
Refining Additives Market Forecast Value in (2035 F) USD 5.8 billion
Forecast CAGR (2025 to 2035) 5.5%

Why is the Refining Additives Market Growing?

The Refining Additives market is experiencing robust growth, driven by increasing global demand for high-quality fuels and lubricants that meet stringent performance and environmental standards. Growth is being supported by the adoption of advanced additive technologies that enhance fuel stability, improve oxidation resistance, and reduce engine deposits and emissions. Rising energy consumption across transportation, industrial, and power sectors has increased the need for refined petroleum products, creating higher demand for additives that optimize refining efficiency.

Regulatory pressure to reduce sulfur content, improve combustion efficiency, and meet international fuel standards is accelerating adoption. Additive manufacturers are investing in research and development to improve performance characteristics, enhance compatibility with diverse feedstocks, and develop multifunctional solutions.

The integration of advanced stabilizers, detergents, and corrosion inhibitors is improving operational reliability and extending the service life of fuels and lubricants As refiners seek cost-effective and sustainable solutions, the Refining Additives market is expected to maintain steady growth, driven by ongoing technological innovation and increased focus on fuel quality, efficiency, and regulatory compliance.

Segmental Analysis

The refining additives market is segmented by product type, application, and geographic regions. By product type, refining additives market is divided into Stabilizers, Corrosion Inhibitor, Hydrogen Sulfide Scavenger, Antioxidants, Antifoulants, Defoamers, Catalyst Regenerators, Biocides, Amine Solutions, Cetane Number Improver, Octane Booster, and Others. In terms of application, refining additives market is classified into Crude Oil Processing, Fluid Catalytic Cracking, Hydroprocessing, and Other. Regionally, the refining additives industry is classified into North America, Latin America, Western Europe, Eastern Europe, Balkan & Baltic Countries, Russia & Belarus, Central Asia, East Asia, South Asia & Pacific, and the Middle East & Africa.
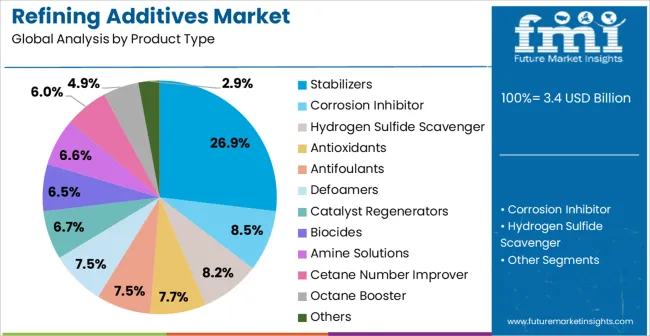
Insights into the Stabilizers Product Type Segment

Refining Additives Market Analysis By Product Type

The stabilizers product type segment is projected to hold 26.9% of the Refining Additives market revenue in 2025, establishing it as the leading product type. Growth in this segment is being driven by the critical role of stabilizers in enhancing fuel oxidation resistance, reducing sludge formation, and improving storage stability of refined petroleum products. These additives help maintain product quality during transportation and storage, which is essential for meeting regulatory standards and customer expectations.

Stabilizers also enhance the performance of other additive components, ensuring consistent functionality across various fuels and lubricants. Ongoing research in formulation optimization and compatibility with different crude oil grades has strengthened the segment’s reliability and adoption.

The cost-efficiency achieved by reducing maintenance needs and extending fuel service life further reinforces the preference for stabilizers among refiners and industrial users As the demand for high-performance and environmentally compliant fuels continues to rise globally, the stabilizers product type is expected to retain its leading position, supported by continuous technological enhancements and regulatory-driven adoption.
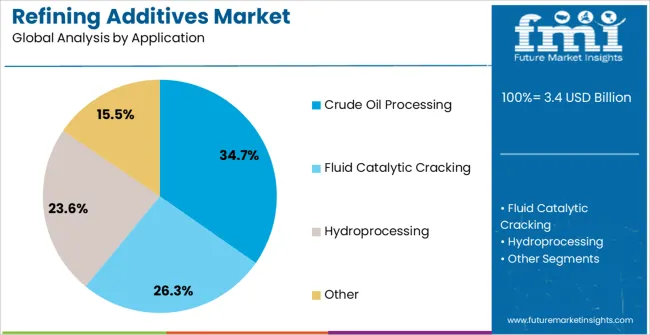
Insights into the Crude Oil Processing Application Segment

Refining Additives Market Analysis By Application

The crude oil processing application segment is anticipated to account for 34.7% of the market revenue in 2025, making it the leading application area. Its growth is being driven by the increasing need to optimize refinery operations and enhance the quality of intermediate and finished petroleum products. Additives used in crude oil processing improve thermal stability, prevent corrosion, and enhance the efficiency of catalytic processes, which reduces operational costs and ensures consistent product quality.

Rising global crude oil production, coupled with stringent fuel quality and emission standards, has further accelerated adoption in refinery operations. Integration of additives allows refiners to process diverse crude oil types with improved yield and reduced downtime.

Technological advancements in additive formulations have enabled enhanced performance in challenging refinery conditions, including high temperatures and variable feedstock compositions As refiners prioritize operational efficiency, regulatory compliance, and product quality, the crude oil processing segment is expected to remain a primary driver of market growth, supported by ongoing innovation in additive chemistry and process optimization.

Market Overview

Refining Additives Market Overview

Refinery additives (RA) are the compounds or chemicals that are used to improve and boost the performance in different refinery processes and the end-product fuels. The fuel performance is increased to meet and achieve the fuel specifications regulated by the government bodies and authorities.

These refinery additives are generally added during the refinery process and also can be used to enhance and modify the performance of specific end-product specifications, such as motor spirit and diesel. The refinery additive products are used in numerous refinery processes such as reformer system, distillation, filling plant process, process cracker, desulfurization, coker, catalytic reforming, vacuum distillation and many more.

These refinery additive products are only used by oil and gas downstream industry. There are numerous types of refining additives, such as antioxidants, stabilizers, antifoulants, defoamers, octane booster, catalyst regenerators, cold flow properties, biocides, cetane number improver, and amine solution, among others. Furthermore, more products comprise lubricity improvers and metal deactivators.

Refining additives products are used in several end-use petroleum products, such as diesel, gasoline, asphalt, and aviation fuel, among others. With the help of refinery additives the major downstream players are increasing their refinery throughputs and productivity. These type of refining additives are formulated through different processing techniques and formulated in such way to fulfill the different end-use demand.

In the construction industry, people are concerned about the health issues related to bitumen application. Recently, one of the company developed the H2S scavenger to address these types of industry challenges.
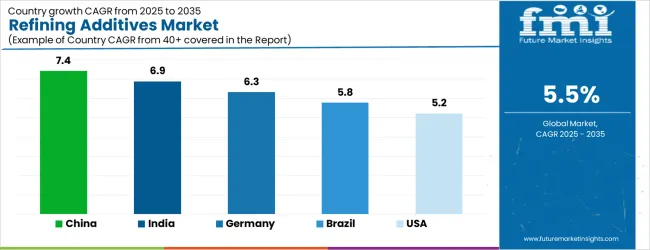
Analysis of Refining Additives Market By Key Countries

Refining Additives Market Cagr Analysis By Country
Country CAGR
China 7.4%
India 6.9%
Germany 6.3%
Brazil 5.8%
USA 5.2%
UK 4.7%
Japan 4.1%

Country-wise Analysis

The Refining Additives Market is expected to register a CAGR of 5.5% during the forecast period, exhibiting varied country level momentum. China leads with the highest CAGR of 7.4%, followed by India at 6.9%. Developed markets such as Germany, France, and the UK continue to expand steadily, while the USA is likely to grow at consistent rates. Japan posts the lowest CAGR at 4.1%, yet still underscores a broadly positive trajectory for the global Refining Additives Market. In 2024, Germany held a dominant revenue in the Western Europe market and is expected to grow with a CAGR of 6.3%. The USA Refining Additives Market is estimated to be valued at USD 1.2 billion in 2025 and is anticipated to reach a valuation of USD 1.2 billion by 2035. Sales are projected to rise at a CAGR of 0.0% over the forecast period between 2025 and 2035. While Japan and South Korea markets are estimated to be valued at USD 158.5 million and USD 118.0 million respectively in 2025.
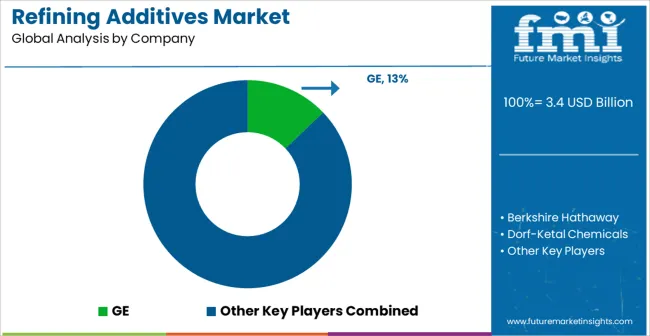
Key Players in the Refining Additives Market

Refining Additives Market Analysis By Company
  • GE
  • Berkshire Hathaway
  • Dorf-Ketal Chemicals
  • Clariant
  • Exxon Mobil
  • Amspec
  • Evonik Industries
  • Albemarle
  • BASF
  • Johnson Matthey
  • Ecolab
  • Chevron
  • Infineum International

Scope of the Report

Item Value
Quantitative Units USD 3.4 Billion
Product Type Stabilizers, Corrosion Inhibitor, Hydrogen Sulfide Scavenger, Antioxidants, Antifoulants, Defoamers, Catalyst Regenerators, Biocides, Amine Solutions, Cetane Number Improver, Octane Booster, and Others
Application Crude Oil Processing, Fluid Catalytic Cracking, Hydroprocessing, and Other
Regions Covered North America, Europe, Asia-Pacific, Latin America, Middle East & Africa
Country Covered United States, Canada, Germany, France, United Kingdom, China, Japan, India, Brazil, South Africa
Key Companies Profiled GE, Berkshire Hathaway, Dorf-Ketal Chemicals, Clariant, Exxon Mobil, Amspec, Evonik Industries, Albemarle, BASF, Johnson Matthey, Ecolab, Chevron, and Infineum International

Refining Additives Market by Segments

Product Type:

  • Stabilizers
  • Corrosion Inhibitor
  • Hydrogen Sulfide Scavenger
  • Antioxidants
  • Antifoulants
  • Defoamers
  • Catalyst Regenerators
  • Biocides
  • Amine Solutions
  • Cetane Number Improver
  • Octane Booster
  • Others

Application:

  • Crude Oil Processing
  • Fluid Catalytic Cracking
  • Hydroprocessing
  • Other

Region:

  • North America
    • USA
    • Canada
    • Mexico
  • Latin America
    • Brazil
    • Chile
    • Rest of Latin America
  • Western Europe
    • Germany
    • UK
    • Italy
    • Spain
    • France
    • Nordic
    • BENELUX
    • Rest of Western Europe
  • Eastern Europe
    • Russia
    • Poland
    • Hungary
    • Balkan & Baltic
    • Rest of Eastern Europe
  • East Asia
    • China
    • Japan
    • South Korea
  • South Asia and Pacific
    • India
    • ASEAN
    • Australia & New Zealand
    • Rest of South Asia and Pacific
  • Middle East & Africa
    • Kingdom of Saudi Arabia
    • Other GCC Countries
    • Turkiye
    • South Africa
    • Other African Union
    • Rest of Middle East & Africa

Table of Content

  1. Executive Summary
    • Global Market Outlook
    • Demand-side Trends
    • Supply-side Trends
    • Technology Roadmap Analysis
    • Analysis and Recommendations
  2. Market Overview
    • Market Coverage / Taxonomy
    • Market Definition / Scope / Limitations
  3. Market Background
    • Market Dynamics
      • Drivers
      • Restraints
      • Opportunity
      • Trends
    • Scenario Forecast
      • Demand in Optimistic Scenario
      • Demand in Likely Scenario
      • Demand in Conservative Scenario
    • Opportunity Map Analysis
    • Product Life Cycle Analysis
    • Supply Chain Analysis
    • Investment Feasibility Matrix
    • Value Chain Analysis
    • PESTLE and Porter’s Analysis
    • Regulatory Landscape
    • Regional Parent Market Outlook
    • Production and Consumption Statistics
    • Import and Export Statistics
  4. Global Market Analysis 2020 to 2024 and Forecast, 2025 to 2035
    • Historical Market Size Value (USD Million) Analysis, 2020 to 2024
    • Current and Future Market Size Value (USD Million) Projections, 2025 to 2035
      • Y-o-Y Growth Trend Analysis
      • Absolute $ Opportunity Analysis
  5. Global Market Pricing Analysis 2020 to 2024 and Forecast 2025 to 2035
  6. Global Market Analysis 2020 to 2024 and Forecast 2025 to 2035, By Product Type
    • Introduction / Key Findings
    • Historical Market Size Value (USD Million) Analysis By Product Type , 2020 to 2024
    • Current and Future Market Size Value (USD Million) Analysis and Forecast By Product Type , 2025 to 2035
      • Stabilizers
      • Corrosion Inhibitor
      • Hydrogen Sulfide Scavenger
      • Antioxidants
      • Antifoulants
      • Defoamers
      • Catalyst Regenerators
      • Biocides
      • Amine Solutions
      • Cetane Number Improver
      • Octane Booster
    • Y-o-Y Growth Trend Analysis By Product Type , 2020 to 2024
    • Absolute $ Opportunity Analysis By Product Type , 2025 to 2035
  7. Global Market Analysis 2020 to 2024 and Forecast 2025 to 2035, By Application
    • Introduction / Key Findings
    • Historical Market Size Value (USD Million) Analysis By Application, 2020 to 2024
    • Current and Future Market Size Value (USD Million) Analysis and Forecast By Application, 2025 to 2035
      • Crude Oil Processing
      • Fluid Catalytic Cracking
      • Hydroprocessing
      • Other
    • Y-o-Y Growth Trend Analysis By Application, 2020 to 2024
    • Absolute $ Opportunity Analysis By Application, 2025 to 2035
  8. Global Market Analysis 2020 to 2024 and Forecast 2025 to 2035, By Region
    • Introduction
    • Historical Market Size Value (USD Million) Analysis By Region, 2020 to 2024
    • Current Market Size Value (USD Million) Analysis and Forecast By Region, 2025 to 2035
      • North America
      • Latin America
      • Western Europe
      • Eastern Europe
      • East Asia
      • South Asia and Pacific
      • Middle East & Africa
    • Market Attractiveness Analysis By Region
  9. North America Market Analysis 2020 to 2024 and Forecast 2025 to 2035, By Country
    • Historical Market Size Value (USD Million) Trend Analysis By Market Taxonomy, 2020 to 2024
    • Market Size Value (USD Million) Forecast By Market Taxonomy, 2025 to 2035
      • By Country
        • USA
        • Canada
        • Mexico
      • By Product Type
      • By Application
    • Market Attractiveness Analysis
      • By Country
      • By Product Type
      • By Application
    • Key Takeaways
  10. Latin America Market Analysis 2020 to 2024 and Forecast 2025 to 2035, By Country
    • Historical Market Size Value (USD Million) Trend Analysis By Market Taxonomy, 2020 to 2024
    • Market Size Value (USD Million) Forecast By Market Taxonomy, 2025 to 2035
      • By Country
        • Brazil
        • Chile
        • Rest of Latin America
      • By Product Type
      • By Application
    • Market Attractiveness Analysis
      • By Country
      • By Product Type
      • By Application
    • Key Takeaways
  11. Western Europe Market Analysis 2020 to 2024 and Forecast 2025 to 2035, By Country
    • Historical Market Size Value (USD Million) Trend Analysis By Market Taxonomy, 2020 to 2024
    • Market Size Value (USD Million) Forecast By Market Taxonomy, 2025 to 2035
      • By Country
        • Germany
        • UK
        • Italy
        • Spain
        • France
        • Nordic
        • BENELUX
        • Rest of Western Europe
      • By Product Type
      • By Application
    • Market Attractiveness Analysis
      • By Country
      • By Product Type
      • By Application
    • Key Takeaways
  12. Eastern Europe Market Analysis 2020 to 2024 and Forecast 2025 to 2035, By Country
    • Historical Market Size Value (USD Million) Trend Analysis By Market Taxonomy, 2020 to 2024
    • Market Size Value (USD Million) Forecast By Market Taxonomy, 2025 to 2035
      • By Country
        • Russia
        • Poland
        • Hungary
        • Balkan & Baltic
        • Rest of Eastern Europe
      • By Product Type
      • By Application
    • Market Attractiveness Analysis
      • By Country
      • By Product Type
      • By Application
    • Key Takeaways
  13. East Asia Market Analysis 2020 to 2024 and Forecast 2025 to 2035, By Country
    • Historical Market Size Value (USD Million) Trend Analysis By Market Taxonomy, 2020 to 2024
    • Market Size Value (USD Million) Forecast By Market Taxonomy, 2025 to 2035
      • By Country
        • China
        • Japan
        • South Korea
      • By Product Type
      • By Application
    • Market Attractiveness Analysis
      • By Country
      • By Product Type
      • By Application
    • Key Takeaways
  14. South Asia and Pacific Market Analysis 2020 to 2024 and Forecast 2025 to 2035, By Country
    • Historical Market Size Value (USD Million) Trend Analysis By Market Taxonomy, 2020 to 2024
    • Market Size Value (USD Million) Forecast By Market Taxonomy, 2025 to 2035
      • By Country
        • India
        • ASEAN
        • Australia & New Zealand
        • Rest of South Asia and Pacific
      • By Product Type
      • By Application
    • Market Attractiveness Analysis
      • By Country
      • By Product Type
      • By Application
    • Key Takeaways
  15. Middle East & Africa Market Analysis 2020 to 2024 and Forecast 2025 to 2035, By Country
    • Historical Market Size Value (USD Million) Trend Analysis By Market Taxonomy, 2020 to 2024
    • Market Size Value (USD Million) Forecast By Market Taxonomy, 2025 to 2035
      • By Country
        • Kingdom of Saudi Arabia
        • Other GCC Countries
        • Turkiye
        • South Africa
        • Other African Union
        • Rest of Middle East & Africa
      • By Product Type
      • By Application
    • Market Attractiveness Analysis
      • By Country
      • By Product Type
      • By Application
    • Key Takeaways
  16. Key Countries Market Analysis
    • USA
      • Pricing Analysis
      • Market Share Analysis, 2024
        • By Product Type
        • By Application
    • Canada
      • Pricing Analysis
      • Market Share Analysis, 2024
        • By Product Type
        • By Application
    • Mexico
      • Pricing Analysis
      • Market Share Analysis, 2024
        • By Product Type
        • By Application
    • Brazil
      • Pricing Analysis
      • Market Share Analysis, 2024
        • By Product Type
        • By Application
    • Chile
      • Pricing Analysis
      • Market Share Analysis, 2024
        • By Product Type
        • By Application
    • Germany
      • Pricing Analysis
      • Market Share Analysis, 2024
        • By Product Type
        • By Application
    • UK
      • Pricing Analysis
      • Market Share Analysis, 2024
        • By Product Type
        • By Application
    • Italy
      • Pricing Analysis
      • Market Share Analysis, 2024
        • By Product Type
        • By Application
    • Spain
      • Pricing Analysis
      • Market Share Analysis, 2024
        • By Product Type
        • By Application
    • France
      • Pricing Analysis
      • Market Share Analysis, 2024
        • By Product Type
        • By Application
    • India
      • Pricing Analysis
      • Market Share Analysis, 2024
        • By Product Type
        • By Application
    • ASEAN
      • Pricing Analysis
      • Market Share Analysis, 2024
        • By Product Type
        • By Application
    • Australia & New Zealand
      • Pricing Analysis
      • Market Share Analysis, 2024
        • By Product Type
        • By Application
    • China
      • Pricing Analysis
      • Market Share Analysis, 2024
        • By Product Type
        • By Application
    • Japan
      • Pricing Analysis
      • Market Share Analysis, 2024
        • By Product Type
        • By Application
    • South Korea
      • Pricing Analysis
      • Market Share Analysis, 2024
        • By Product Type
        • By Application
    • Russia
      • Pricing Analysis
      • Market Share Analysis, 2024
        • By Product Type
        • By Application
    • Poland
      • Pricing Analysis
      • Market Share Analysis, 2024
        • By Product Type
        • By Application
    • Hungary
      • Pricing Analysis
      • Market Share Analysis, 2024
        • By Product Type
        • By Application
    • Kingdom of Saudi Arabia
      • Pricing Analysis
      • Market Share Analysis, 2024
        • By Product Type
        • By Application
    • Turkiye
      • Pricing Analysis
      • Market Share Analysis, 2024
        • By Product Type
        • By Application
    • South Africa
      • Pricing Analysis
      • Market Share Analysis, 2024
        • By Product Type
        • By Application
  17. Market Structure Analysis
    • Competition Dashboard
    • Competition Benchmarking
    • Market Share Analysis of Top Players
      • By Regional
      • By Product Type
      • By Application
  18. Competition Analysis
    • Competition Deep Dive
      • GE
        • Overview
        • Product Portfolio
        • Profitability by Market Segments (Product/Age /Sales Channel/Region)
        • Sales Footprint
        • Strategy Overview
          • Marketing Strategy
          • Product Strategy
          • Channel Strategy
      • Berkshire Hathaway
      • Dorf-Ketal Chemicals
      • Clariant
      • Exxon Mobil
      • Amspec
      • Evonik Industries
      • Albemarle
      • BASF
      • Johnson Matthey
      • Ecolab
      • Chevron
      • Infineum International
  19. Assumptions & Acronyms Used
  20. Research Methodology

List of Tables

  • Table 1: Global Market Value (USD Million) Forecast by Region, 2020-2035
  • Table 2: Global Market Value (USD Million) Forecast by Product Type , 2020-2035
  • Table 3: Global Market Value (USD Million) Forecast by Application, 2020-2035
  • Table 4: North America Market Value (USD Million) Forecast by Country, 2020-2035
  • Table 5: North America Market Value (USD Million) Forecast by Product Type , 2020-2035
  • Table 6: North America Market Value (USD Million) Forecast by Application, 2020-2035
  • Table 7: Latin America Market Value (USD Million) Forecast by Country, 2020-2035
  • Table 8: Latin America Market Value (USD Million) Forecast by Product Type , 2020-2035
  • Table 9: Latin America Market Value (USD Million) Forecast by Application, 2020-2035
  • Table 10: Western Europe Market Value (USD Million) Forecast by Country, 2020-2035
  • Table 11: Western Europe Market Value (USD Million) Forecast by Product Type , 2020-2035
  • Table 12: Western Europe Market Value (USD Million) Forecast by Application, 2020-2035
  • Table 13: Eastern Europe Market Value (USD Million) Forecast by Country, 2020-2035
  • Table 14: Eastern Europe Market Value (USD Million) Forecast by Product Type , 2020-2035
  • Table 15: Eastern Europe Market Value (USD Million) Forecast by Application, 2020-2035
  • Table 16: East Asia Market Value (USD Million) Forecast by Country, 2020-2035
  • Table 17: East Asia Market Value (USD Million) Forecast by Product Type , 2020-2035
  • Table 18: East Asia Market Value (USD Million) Forecast by Application, 2020-2035
  • Table 19: South Asia and Pacific Market Value (USD Million) Forecast by Country, 2020-2035
  • Table 20: South Asia and Pacific Market Value (USD Million) Forecast by Product Type , 2020-2035
  • Table 21: South Asia and Pacific Market Value (USD Million) Forecast by Application, 2020-2035
  • Table 22: Middle East & Africa Market Value (USD Million) Forecast by Country, 2020-2035
  • Table 23: Middle East & Africa Market Value (USD Million) Forecast by Product Type , 2020-2035
  • Table 24: Middle East & Africa Market Value (USD Million) Forecast by Application, 2020-2035

List of Figures

  • Figure 1: Global Market Pricing Analysis
  • Figure 2: Global Market Value (USD Million) Forecast 2020-2035
  • Figure 3: Global Market Value Share and BPS Analysis by Product Type , 2025 and 2035
  • Figure 4: Global Market Y-o-Y Growth Comparison by Product Type , 2025-2035
  • Figure 5: Global Market Attractiveness Analysis by Product Type
  • Figure 6: Global Market Value Share and BPS Analysis by Application, 2025 and 2035
  • Figure 7: Global Market Y-o-Y Growth Comparison by Application, 2025-2035
  • Figure 8: Global Market Attractiveness Analysis by Application
  • Figure 9: Global Market Value (USD Million) Share and BPS Analysis by Region, 2025 and 2035
  • Figure 10: Global Market Y-o-Y Growth Comparison by Region, 2025-2035
  • Figure 11: Global Market Attractiveness Analysis by Region
  • Figure 12: North America Market Incremental Dollar Opportunity, 2025-2035
  • Figure 13: Latin America Market Incremental Dollar Opportunity, 2025-2035
  • Figure 14: Western Europe Market Incremental Dollar Opportunity, 2025-2035
  • Figure 15: Eastern Europe Market Incremental Dollar Opportunity, 2025-2035
  • Figure 16: East Asia Market Incremental Dollar Opportunity, 2025-2035
  • Figure 17: South Asia and Pacific Market Incremental Dollar Opportunity, 2025-2035
  • Figure 18: Middle East & Africa Market Incremental Dollar Opportunity, 2025-2035
  • Figure 19: North America Market Value Share and BPS Analysis by Country, 2025 and 2035
  • Figure 20: North America Market Value Share and BPS Analysis by Product Type , 2025 and 2035
  • Figure 21: North America Market Y-o-Y Growth Comparison by Product Type , 2025-2035
  • Figure 22: North America Market Attractiveness Analysis by Product Type
  • Figure 23: North America Market Value Share and BPS Analysis by Application, 2025 and 2035
  • Figure 24: North America Market Y-o-Y Growth Comparison by Application, 2025-2035
  • Figure 25: North America Market Attractiveness Analysis by Application
  • Figure 26: Latin America Market Value Share and BPS Analysis by Country, 2025 and 2035
  • Figure 27: Latin America Market Value Share and BPS Analysis by Product Type , 2025 and 2035
  • Figure 28: Latin America Market Y-o-Y Growth Comparison by Product Type , 2025-2035
  • Figure 29: Latin America Market Attractiveness Analysis by Product Type
  • Figure 30: Latin America Market Value Share and BPS Analysis by Application, 2025 and 2035
  • Figure 31: Latin America Market Y-o-Y Growth Comparison by Application, 2025-2035
  • Figure 32: Latin America Market Attractiveness Analysis by Application
  • Figure 33: Western Europe Market Value Share and BPS Analysis by Country, 2025 and 2035
  • Figure 34: Western Europe Market Value Share and BPS Analysis by Product Type , 2025 and 2035
  • Figure 35: Western Europe Market Y-o-Y Growth Comparison by Product Type , 2025-2035
  • Figure 36: Western Europe Market Attractiveness Analysis by Product Type
  • Figure 37: Western Europe Market Value Share and BPS Analysis by Application, 2025 and 2035
  • Figure 38: Western Europe Market Y-o-Y Growth Comparison by Application, 2025-2035
  • Figure 39: Western Europe Market Attractiveness Analysis by Application
  • Figure 40: Eastern Europe Market Value Share and BPS Analysis by Country, 2025 and 2035
  • Figure 41: Eastern Europe Market Value Share and BPS Analysis by Product Type , 2025 and 2035
  • Figure 42: Eastern Europe Market Y-o-Y Growth Comparison by Product Type , 2025-2035
  • Figure 43: Eastern Europe Market Attractiveness Analysis by Product Type
  • Figure 44: Eastern Europe Market Value Share and BPS Analysis by Application, 2025 and 2035
  • Figure 45: Eastern Europe Market Y-o-Y Growth Comparison by Application, 2025-2035
  • Figure 46: Eastern Europe Market Attractiveness Analysis by Application
  • Figure 47: East Asia Market Value Share and BPS Analysis by Country, 2025 and 2035
  • Figure 48: East Asia Market Value Share and BPS Analysis by Product Type , 2025 and 2035
  • Figure 49: East Asia Market Y-o-Y Growth Comparison by Product Type , 2025-2035
  • Figure 50: East Asia Market Attractiveness Analysis by Product Type
  • Figure 51: East Asia Market Value Share and BPS Analysis by Application, 2025 and 2035
  • Figure 52: East Asia Market Y-o-Y Growth Comparison by Application, 2025-2035
  • Figure 53: East Asia Market Attractiveness Analysis by Application
  • Figure 54: South Asia and Pacific Market Value Share and BPS Analysis by Country, 2025 and 2035
  • Figure 55: South Asia and Pacific Market Value Share and BPS Analysis by Product Type , 2025 and 2035
  • Figure 56: South Asia and Pacific Market Y-o-Y Growth Comparison by Product Type , 2025-2035
  • Figure 57: South Asia and Pacific Market Attractiveness Analysis by Product Type
  • Figure 58: South Asia and Pacific Market Value Share and BPS Analysis by Application, 2025 and 2035
  • Figure 59: South Asia and Pacific Market Y-o-Y Growth Comparison by Application, 2025-2035
  • Figure 60: South Asia and Pacific Market Attractiveness Analysis by Application
  • Figure 61: Middle East & Africa Market Value Share and BPS Analysis by Country, 2025 and 2035
  • Figure 62: Middle East & Africa Market Value Share and BPS Analysis by Product Type , 2025 and 2035
  • Figure 63: Middle East & Africa Market Y-o-Y Growth Comparison by Product Type , 2025-2035
  • Figure 64: Middle East & Africa Market Attractiveness Analysis by Product Type
  • Figure 65: Middle East & Africa Market Value Share and BPS Analysis by Application, 2025 and 2035
  • Figure 66: Middle East & Africa Market Y-o-Y Growth Comparison by Application, 2025-2035
  • Figure 67: Middle East & Africa Market Attractiveness Analysis by Application
  • Figure 68: Global Market - Tier Structure Analysis
  • Figure 69: Global Market - Company Share Analysis

Frequently Asked Questions

How big is the refining additives market in 2025?

The global refining additives market is estimated to be valued at USD 3.4 billion in 2025.

What will be the size of refining additives market in 2035?

The market size for the refining additives market is projected to reach USD 5.8 billion by 2035.

How much will be the refining additives market growth between 2025 and 2035?

The refining additives market is expected to grow at a 5.5% CAGR between 2025 and 2035.

What are the key product types in the refining additives market?

The key product types in refining additives market are stabilizers, corrosion inhibitor, hydrogen sulfide scavenger, antioxidants, antifoulants, defoamers, catalyst regenerators, biocides, amine solutions, cetane number improver, octane booster and others.

Which application segment to contribute significant share in the refining additives market in 2025?

In terms of application, crude oil processing segment to command 34.7% share in the refining additives market in 2025.

Explore Similar Insights

Future Market Insights

Refining Additives Market

Chat With MaRIA

Chat With

MaRIA

Hi There, I am MaRIA, Your Market Research Intelligence Assistant. How may I help you?