Reports
- Global Locations -
Headquarters
Future Market Insights, Inc.
Christiana Corporate, 200
Continental Drive, Suite 401,
Newark, Delaware - 19713,
United States
Americas
Future Market Insights, Inc.
616 Corporate Way, Suite 2-9018,
Valley Cottage, NY 10989, United States
MEA
Future Market Insights
1602-6 Jumeirah Bay X2 Tower, Plot No: JLT-PH2-X2A,
Jumeirah Lakes Towers, Dubai,
United Arab Emirates
Europe
Future Market Insights
3rd Floor, 207 Regent Street,
W1B 3HH London
United Kingdom
Asia Pacific
Future Market Insights
Office No. 401-A, 4th Floor,
VANTAGE 9, S.No. 36/1/1,
Baner, Pune 411045, India
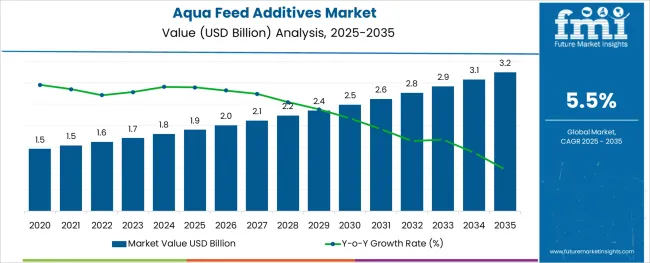
The global aquafeed additives market size is anticipated to reach US$ 3.4 billion by 2033. It is estimated to record a steady CAGR of 4.3% in the review period 2023 to 2033. It is likely to hold a valuation of US$ 2.3 billion in 2023.
The market is rising fast due to the growing demand for fish and seafood products. This trend is projected to continue in the future as the population continues to grow and the need for protein from seafood sources is increasing.
As the world population continues to surge, fish consumption is expected to increase due to several health benefits related to it. This includes improved cognitive growth in children, reduced risk of heart disease vessels, and reduced amount of fat in the body. This, in turn, is expected to drive demand for healthy and high-quality fish products. This, again, is expected to drive the consumption of aquafeed additives.
In North America, the United States has become a key market for aquafeed additives, driven by the growth of the aquaculture sector and growing consumption of fish products. The United States has a well-developed aquaculture sector and high per capita consumption of seafood, which is driving the domestic market growth.
The sudden outburst of the pandemic caused widespread disruption in worldwide supply chains, leading to delays and a lack of raw materials products. This has resulted in augmented prices for aquafeed additive producers, as well as abridged production size and limited quantity of certain goods.
Furthermore, the pandemic likewise affected demand for this product as several fish and aquaculture farms were forced to temporarily close or reduce production stages due to pandemic and blockade measures. This has resulted in reduced demand for aquafeed additives, which additionally increases the challenges faced by producers.
Attributes | Key Insights |
---|---|
Aquafeed Additives Market Size (2022A) | US$ 2.1 billion |
Aquafeed Additives Market Estimated Size (2023E) | US$ 2.3 billion |
Projected Aquafeed Additives Market Valuation (2033F) | US$ 3.4 billion |
Value-based CAGR (2023 to 2033) | 4.3% |
Don't pay for what you don't need
Customize your report by selecting specific countries or regions and save 30%!
The global aquafeed additives market registered an astonishing CAGR of 6.1% in the historical period between 2018 and 2022. It is projected to rise at a decent CAGR of 4.3% in the assessment period.
Historical Value (2022) | US$ 2.1 billion |
---|---|
Historical CAGR (2018 to 2022) | 6.1% |
Fishmeal and fish oil became staples in aquaculture feeds in the 21st century. These ingredients provide a source of high-quality protein and fat supporting the rapid growth of the aquaculture industry. The heavy reliance on fishmeal and fish oil in aquaculture feeds has raised concerns about overfishing, environmental sustainability, and competition with the human food chain.
In the 2020s, researchers began to explore alternative protein sources such as soybean meal, corn gluten meal, and poultry by-products to reduce dependence on fishmeal. Vegetable oils and animal fats have been studied to replace fish oil. It is becoming more and more common to incorporate functional additives such as vitamins, probiotics, minerals, prebiotics, and enzymes into fish feed.
Sustainability has become a key driver in the aquafeed additive market since the 2020s. Consumers and regulators have begun to emphasize sustainable sourcing of ingredients, eco-friendly feed formulations, and responsible aquaculture practices.
Diseases in aquaculture have prompted research into aquafeed additives to improve the immune system and disease resistance of several aquatic species. Advances in aquaculture feed technology and nutrition have enabled the creation of more precise feed formulations, tailored to the precise requirements of diverse aquatic species and growth stages.
The Clean Label movement has led to a preference for recognizable and natural ingredients in fish and aqua feeds. This has influenced the use of natural colorants, flavor enhancers, and additives with friendly names. Technology, including data analytics, automation, and innovative processing methods, has enabled advanced aquafeed production and management, leading to more effective and sustainable operations.
Attributes | Key Factors |
---|---|
Latest Trends |
|
Growth Hindrances |
|
Upcoming Opportunities |
|
The section covers a comparative view of three markets similar to that of the global aquafeed additives market. As per estimations, the aquafeed market would lead out of the three markets. Rising emphasis on sustainable sources is set to aid market expansion by 2033.
The market for aquafeed is set to hit a valuation of US$ 90.9 billion by 2023. The food additives market and aquafeed additives market is projected to reach US$ 4.62 billion and US$ 2.3 billion, respectively in 2023.
Aquafeed Additives Market:
Attributes | Aquafeed Additives Market |
---|---|
CAGR (2023 to 2033) | 6.1% |
Aquafeed Additives Market Value (2023) | US$ 2.3 billion |
Growth Factor | Advances in digital technology, data analytics, and precision aquaculture are altering the industry. Companies that incorporate these technologies into feed management and observing systems can improve feed efficacy, reduce waste, and improve overall production. |
Key Trend | Increasing focus on traceability and certification in the aquaculture sector. Businesses that can deliver transparency in the supply chain and source food additives that are sourced and certified can gain a competitive advantage. |
Food Additives Market:
Attributes | Food Additives Market |
---|---|
CAGR (2023 to 2033) | 6.6% |
Market Value (2023) | US$ 4.62 billion |
Growth Factor | Personalized feed formulations tailored to the precise nutritional needs of diverse growing species and stages of growth. Precise feeding optimizes growth and reduces waste. |
Key Trend | Increasing focus on sustainable sourcing of elements for aquaculture feed, counting fishmeal and fish oil. This trend is driven by concerns about overfishing and the need to decrease the environmental impact of aquaculture. |
Aquafeed Market:
Attributes | Aquafeed Market |
---|---|
CAGR (2023 to 2033) | 6.8% |
Market Value (2023) | US$ 90.9 billion |
Growth Factor | Sustainable and ecologically friendly food additives, counting those that reduce carbon emissions or from renewable materials, are progressively favored by consumers and food manufacturers. |
Key Trend | Consumers are looking for foods with clear and simple ingredient lists. This trend has led to a need for recognizable and natural additives, as well as a desire to reduce or eradicate artificial additives. |
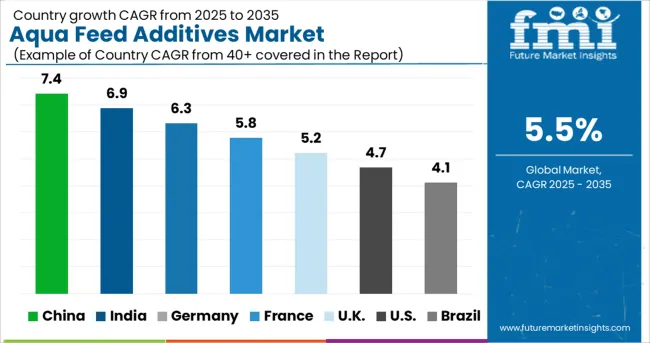
The below table explains the aquafeed additives market size and CAGRs of the top 5 countries for 2033. Among them, the United States is anticipated to remain at the forefront by reaching a valuation of US$ 611 million.
China is projected to total around US$ 524.3 million by 2033, which is a bit less than Japan's US$ 347.9 million. Japan is anticipated to be followed by South Korea with a value of US$ 197 million.
Country | Market Value (2033) |
---|---|
United States | US$ 611 million |
United Kingdom | US$ 134.8 million |
China | US$ 524.3 million |
Japan | US$ 347.9 million |
South Korea | US$ 197 million |
In the table below, the CAGRs of the top 5 countries are given for the review period 2023 to 2033. Out of these, the United States and South Korea are expected to remain dominant by exhibiting a CAGR of 5.1% and 5.4% respectively. Japan and China are likely to follow with CAGRs of 4.9% and 4.6%, respectively.
Country | Value-based CAGR (2023 to 2033) |
---|---|
United States | 4.5% |
United Kingdom | 5.1% |
China | 4.6% |
Japan | 4.9% |
South Korea | 5.4% |
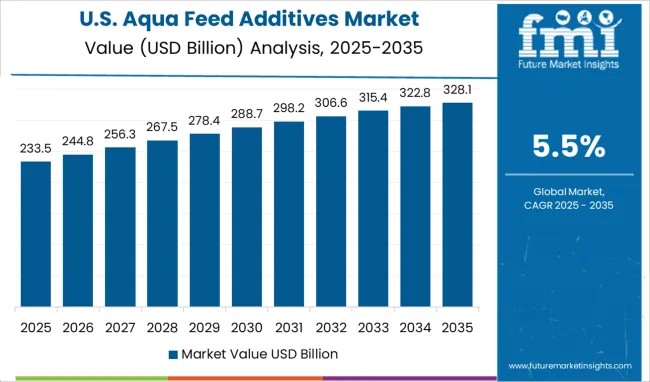
The United States aquafeed additives market is projected to reach US$ 611 million in the forecast period. It expanded at a CAGR of 6.7% in the historical period. The United States is expected to dominate the market with the utmost revenue share by 2033.
The United States is home to the world's leading aquaculture industries, which are driving demand among the population. Growing population and urbanization are driving the need for fish as a cause of protein and nutrition, which is also pouring into the market.
Furthermore, the growing mindfulness of the benefits of aquafeed additives, the stringent guidelines to ensure the security and ecological impact of feed ingredients and the support of the government for the aqua feed additives market are projected to drive market development in the United States.
The United Kingdom aquafeed additives market is anticipated to be valued at US$ 134.8 million by 2033. It expanded at a CAGR of 8.0% in the historical period. The United Kingdom has a huge aquaculture industry, with an emphasis on salmon, trout, and shellfish production. The industry has faced challenges linked to sustainability, disease management, and the need for innovative aquafeed solutions.
Sustainability has developed as a key driver in the United Kingdom aquaculture industry. There is an increasing focus on reducing the ecological impact of aquaculture operations, counting on sustainable sourcing of ingredients for aquaculture feed. The United Kingdom's aquaculture and feed industry is subject to regulations relating to food safety, environmental impact, and labeling. Compliance with these guidelines is essential for companies operating in this sector.
The United Kingdom is investigating the use of insect meal, microalgae, and other non-traditional elements to reduce dependence on fishmeal and fish oil. Customer demand for sustainably sourced seafood has inclined the United Kingdom aquafeed market. Firms that can supply aquafeed additives that match consumer preferences for high-quality, environmentally friendly seafood may find growth opportunities.
China's aquafeed additives market is projected to hit a value of US$ 524.3 million by 2033. It expanded at a CAGR of 7.5% in the historical period. It is the leading and prominently growing aquafeed additives market in the world.
China is the world's leading producer of farmed seafood, comprising fish, shrimp, and other aquatic species. This vast aquaculture industry creates significant demand for fish feed and related additives. China's aquaculture industry has developed rapidly to meet the growing domestic and global demand for seafood.
Aquaculture in China includes several species including carp, tilapia, catfish, shrimp, and crustaceans. Species diversity offers the opportunity for specialized aquafeed additives, tailored to diverse nutritional needs.
Sustainability and ecological issues are becoming progressively important in the Chinese aquaculture industry. Using sustainable ingredients for aquaculture feed, reducing reliance on fishmeal and fish oil, and promoting environmentally friendly additives are the areas of focus.
Japan's aquafeed additives market is projected to top a valuation of US$ 347.9 million by 2033. It expanded at a CAGR of 7.8% in the historical period. Japan is one of the countries with the utmost per capita seafood consumption in the world.
High demand for seafood products, especially fish and shellfish, requires efficient and sustainable aquaculture operations, hence the need for aquafeed additives. Japan has a longstanding and technologically advanced aquaculture industry that focuses on species such as salmon, trout, eel, and several crustaceans.
The growth and competitiveness of this industry have fueled innovation in aquafeed formulations and additives. Sustainability is a key concern in the Japan aquaculture industry. Consumers are looking for sustainable and responsibly sourced seafood. This has led to rising interest in sustainable aquafeed additives and alternative protein sources.
Like several other countries, Japan is directing towards alternative protein sources for aquaculture feed. Insect meal, microalgae, and other new ingredients are researched to reduce dependence on traditional fishmeal and fish oil.
South Korea's aquafeed additives market is estimated to total a valuation of US$ 197 million by 2033. It expanded at a CAGR of 10.1% in the historical period. Research institutes and aquafeed manufacturers in South Korea have been involved in innovative feed preparations and additives. Partnerships between academia and industry drive advancements in aquafeed technology.
South Korea aquaculture goods, including seafood, are exported to several international markets. Companies engaged in the production of aquafeed additives can benefit from this export-oriented industry. South Korea's aquafeed additive market is competitive with both local and international players. Companies that want to succeed in this market must consider aspects such as product differentiation, quality, and value-added services.
Following the global trend, the issue of traceability and certification in South Korea's aquaculture sector is increasingly focused. Providing transparent and certified additives for aquaculture feed can be a competitive advantage. Companies functioning in South Korea can explore growth opportunities by growing their market reach, targeting diverse species, or diversifying their product offering.
Get the data you need at a Fraction of the cost
Personalize your report by choosing insights you need
and save 40%!
The table below signifies leading sub-categories under the ingredient and application category in the aquafeed additives market. Anti-parasitic is expected to dominate the market for aquafeed additives by exhibiting a 4.1% CAGR in the evaluation period. Under the application segment, the carp category is projected to lead the global aquafeed additives market at a 4.0% CAGR.
Category | Forecast CAGR (2023 to 2033) |
---|---|
Anti-parasitic (Ingredient) | 4.1% |
Carp (Application) | 4.0% |
Based on ingredients, the anti-parasitic category is projected to account for the most significant aquafeed additives market share through 2033. It registered an average CAGR of 6.0% from 2018 to 2022.
Anti-parasitic additives used in the aquafeed industry are essential in maintaining the well-being of farmed aquatic species. Parasitic infections can lead to noteworthy economic losses in aquaculture, which is why the use of operative anti-parasitic additives is essential.
Parasitic infections can cause disease in fish and other aquatic species, resulting in reduced growth rates, augmented mortality, and poor general health. Effective pest control additives are needed to prevent and control parasite infestations, particularly in intensive aquaculture systems where there is a higher risk of disease transmission.
Traditional pest control additives may comprise chemical compounds such as formalin, praziquantel, and hydrogen peroxide. These chemicals are added to water or food to treat and control parasitic infections. There is increasing concern about natural and herbal additives with antiparasitic properties.
Ingredients such as garlic, neem oil, and several plant extracts are being studied for their ability to regulate parasites in aquaculture. Anti-parasitic additives can work in several ways, including killing or inhibiting the development of parasites, unsettling their life cycle, or improving the immune response of aquatic species.
Anti-parasitic additives play an important role in upholding the health and efficiency of aquaculture operations. As the aquafeed additives industry continues to evolve and familiarize itself with sustainability concerns, the growth and use of operative, safe, and environmentally friendly anti-parasitic additives will continue to grow.
In terms of application, the carp segment is expected to generate a lion's share in the aquafeed additives market by 2033. It expanded at 5.8% CAGR in the historical period from 2018 to 2022.
Carp is the most sold freshwater fish in the world and its application in the aquafeed additive market is substantial. Carp farming is popular in several countries and enhancing the nutrition and wellbeing of carp through aquafeed additives is vital for sustainable and profitable production.
To decrease the reliance on traditional fish oil and fish meal, carp diets progressively incorporate substitute protein sources. Insect meal, vegetable protein, and microbial protein are studied as ecological and profitable alternatives. Aquatic feed additives containing immunostimulants help strengthen the immune system of carp, reducing the risk of infection.
Antioxidant additives, such as vitamins C and E, can guard carp from oxidative stress, improve disease resistance, and underwrite overall health. On some carp farms, natural colorants such as astaxanthin may be added to the feed to improve the color of the fish, which can be especially significant for ornamental carp breeds.
The aquafeed additive market is competitive, with several companies offering an extensive range of goods for diverse species of aquatic animals. Key companies have a robust global presence and supply a wide variety of aquafeed additives, such as minerals, vitamins, amino acids, and enzymes.
To compete in the market, firms need to offer high-quality goods that are supported by research and that meet industry standards. Having a sturdy distribution network, and competitive pricing are all significant factors for the market to remain competitive.
For instance,
Attribute | Details |
---|---|
Estimated Aquafeed Additives Market Size (2023) | US$ 2.3 billion |
Projected Aquafeed Additives Market Valuation (2033) | US$ 3.4 billion |
Value-based CAGR (2023 to 2033) | 4.3% |
Historical Data | 2018 to 2022 |
Forecast Period | 2023 to 2033 |
Quantitative Units | Value (US$ billion) |
Segments Covered | Ingredient and Technology |
Regions Covered | North America, Latin America, East Asia, South Asia Pacific, Western Europe, Eastern Europe, Middle East & Africa |
Key Companies Profiled | Nutriad Inc, Alltech, Olmix Group, Nouryon, DuPont de Nemours Inc. |
1. Executive Summary 1.1. Global Market Outlook 1.2. Demand-side Trends 1.3. Supply-side Trends 1.4. Technology Roadmap Analysis 1.5. Analysis and Recommendations 2. Market Overview 2.1. Market Coverage / Taxonomy 2.2. Market Definition / Scope / Limitations 3. Market Background 3.1. Market Dynamics 3.1.1. Drivers 3.1.2. Restraints 3.1.3. Opportunity 3.1.4. Trends 3.2. Scenario Forecast 3.2.1. Demand in Optimistic Scenario 3.2.2. Demand in Likely Scenario 3.2.3. Demand in Conservative Scenario 3.3. Opportunity Map Analysis 3.4. Product Life Cycle Analysis 3.5. Supply Chain Analysis 3.5.1. Supply Side Participants and their Roles 3.5.1.1. Producers 3.5.1.2. Mid-Level Participants (Traders/ Agents/ Brokers) 3.5.1.3. Wholesalers and Distributors 3.5.2. Value Added and Value Created at Node in the Supply Chain 3.5.3. List of Raw Material Suppliers 3.5.4. List of Existing and Potential Buyer’s 3.6. Investment Feasibility Matrix 3.7. Value Chain Analysis 3.7.1. Profit Margin Analysis 3.7.2. Wholesalers and Distributors 3.7.3. Retailers 3.8. PESTLE and Porter’s Analysis 3.9. Regulatory Landscape 3.9.1. By Key Regions 3.9.2. By Key Countries 3.10. Regional Parent Market Outlook 3.11. Production and Consumption Statistics 3.12. Import and Export Statistics 4. Global Market Analysis 2018 to 2022 and Forecast, 2023 to 2033 4.1. Historical Market Size Value (US$ Million) & Volume (Tons) Analysis, 2018 to 2022 4.2. Current and Future Market Size Value (US$ Million) & Volume (Tons) Projections, 2023 to 2033 4.2.1. Y-o-Y Growth Trend Analysis 4.2.2. Absolute $ Opportunity Analysis 5. Global Market Analysis 2018 to 2022 and Forecast 2023 to 2033, By Ingredient 5.1. Introduction / Key Findings 5.2. Historical Market Size Value (US$ Million) & Volume (Tons) Analysis By Ingredient, 2018 to 2022 5.3. Current and Future Market Size Value (US$ Million) & Volume (Tons) Analysis and Forecast By Ingredient, 2023 to 2033 5.3.1. Anti-Parasitic 5.3.2. Feed Acidifiers 5.3.3. Prebiotics 5.3.4. Essential Oils and Natural Extracts 5.3.5. Palatants 5.3.6. Hydrolysates 5.3.7. Yeast Extracts 5.3.8. Others 5.4. Y-o-Y Growth Trend Analysis By Ingredient, 2018 to 2022 5.5. Absolute $ Opportunity Analysis By Ingredient, 2023 to 2033 6. Global Market Analysis 2018 to 2022 and Forecast 2023 to 2033, By Application 6.1. Introduction / Key Findings 6.2. Historical Market Size Value (US$ Million) & Volume (Tons) Analysis By Application, 2018 to 2022 6.3. Current and Future Market Size Value (US$ Million) & Volume (Tons) Analysis and Forecast By Application, 2023 to 2033 6.3.1. Carp 6.3.2. Rainbow Trout 6.3.3. Salmon 6.3.4. Crustaceans 6.3.5. Tilapia 6.3.6. Catfish 6.3.7. Sea Bass 6.3.8. Grouper 6.3.9. Others 6.4. Y-o-Y Growth Trend Analysis By Application, 2018 to 2022 6.5. Absolute $ Opportunity Analysis By Application, 2023 to 2033 7. Global Market Analysis 2018 to 2022 and Forecast 2023 to 2033, By Region 7.1. Introduction 7.2. Historical Market Size Value (US$ Million) & Volume (Tons) Analysis By Region, 2018 to 2022 7.3. Current Market Size Value (US$ Million) & Volume (Tons) Analysis and Forecast By Region, 2023 to 2033 7.3.1. North America 7.3.2. Latin America 7.3.3. Western Europe 7.3.4. Eastern Europe 7.3.5. South Asia and Pacific 7.3.6. East Asia 7.3.7. Middle East and Africa 7.4. Market Attractiveness Analysis By Region 8. North America Market Analysis 2018 to 2022 and Forecast 2023 to 2033, By Country 8.1. Historical Market Size Value (US$ Million) & Volume (Tons) Trend Analysis By Market Taxonomy, 2018 to 2022 8.2. Market Size Value (US$ Million) & Volume (Tons) Forecast By Market Taxonomy, 2023 to 2033 8.2.1. By Country 8.2.1.1. United States 8.2.1.2. Canada 8.2.2. By Ingredient 8.2.3. By Application 8.3. Market Attractiveness Analysis 8.3.1. By Country 8.3.2. By Ingredient 8.3.3. By Application 8.4. Key Takeaways 9. Latin America Market Analysis 2018 to 2022 and Forecast 2023 to 2033, By Country 9.1. Historical Market Size Value (US$ Million) & Volume (Tons) Trend Analysis By Market Taxonomy, 2018 to 2022 9.2. Market Size Value (US$ Million) & Volume (Tons) Forecast By Market Taxonomy, 2023 to 2033 9.2.1. By Country 9.2.1.1. Brazil 9.2.1.2. Mexico 9.2.1.3. Rest of Latin America 9.2.2. By Ingredient 9.2.3. By Application 9.3. Market Attractiveness Analysis 9.3.1. By Country 9.3.2. By Ingredient 9.3.3. By Application 9.4. Key Takeaways 10. Western Europe Market Analysis 2018 to 2022 and Forecast 2023 to 2033, By Country 10.1. Historical Market Size Value (US$ Million) & Volume (Tons) Trend Analysis By Market Taxonomy, 2018 to 2022 10.2. Market Size Value (US$ Million) & Volume (Tons) Forecast By Market Taxonomy, 2023 to 2033 10.2.1. By Country 10.2.1.1. Germany 10.2.1.2. United Kingdom 10.2.1.3. France 10.2.1.4. Spain 10.2.1.5. Italy 10.2.1.6. Rest of Western Europe 10.2.2. By Ingredient 10.2.3. By Application 10.3. Market Attractiveness Analysis 10.3.1. By Country 10.3.2. By Ingredient 10.3.3. By Application 10.4. Key Takeaways 11. Eastern Europe Market Analysis 2018 to 2022 and Forecast 2023 to 2033, By Country 11.1. Historical Market Size Value (US$ Million) & Volume (Tons) Trend Analysis By Market Taxonomy, 2018 to 2022 11.2. Market Size Value (US$ Million) & Volume (Tons) Forecast By Market Taxonomy, 2023 to 2033 11.2.1. By Country 11.2.1.1. Poland 11.2.1.2. Russia 11.2.1.3. Czech Republic 11.2.1.4. Romania 11.2.1.5. Rest of Eastern Europe 11.2.2. By Ingredient 11.2.3. By Application 11.3. Market Attractiveness Analysis 11.3.1. By Country 11.3.2. By Ingredient 11.3.3. By Application 11.4. Key Takeaways 12. South Asia and Pacific Market Analysis 2018 to 2022 and Forecast 2023 to 2033, By Country 12.1. Historical Market Size Value (US$ Million) & Volume (Tons) Trend Analysis By Market Taxonomy, 2018 to 2022 12.2. Market Size Value (US$ Million) & Volume (Tons) Forecast By Market Taxonomy, 2023 to 2033 12.2.1. By Country 12.2.1.1. India 12.2.1.2. Bangladesh 12.2.1.3. Australia 12.2.1.4. New Zealand 12.2.1.5. Rest of South Asia and Pacific 12.2.2. By Ingredient 12.2.3. By Application 12.3. Market Attractiveness Analysis 12.3.1. By Country 12.3.2. By Ingredient 12.3.3. By Application 12.4. Key Takeaways 13. East Asia Market Analysis 2018 to 2022 and Forecast 2023 to 2033, By Country 13.1. Historical Market Size Value (US$ Million) & Volume (Tons) Trend Analysis By Market Taxonomy, 2018 to 2022 13.2. Market Size Value (US$ Million) & Volume (Tons) Forecast By Market Taxonomy, 2023 to 2033 13.2.1. By Country 13.2.1.1. China 13.2.1.2. Japan 13.2.1.3. South Korea 13.2.2. By Ingredient 13.2.3. By Application 13.3. Market Attractiveness Analysis 13.3.1. By Country 13.3.2. By Ingredient 13.3.3. By Application 13.4. Key Takeaways 14. Middle East and Africa Market Analysis 2018 to 2022 and Forecast 2023 to 2033, By Country 14.1. Historical Market Size Value (US$ Million) & Volume (Tons) Trend Analysis By Market Taxonomy, 2018 to 2022 14.2. Market Size Value (US$ Million) & Volume (Tons) Forecast By Market Taxonomy, 2023 to 2033 14.2.1. By Country 14.2.1.1. GCC Countries 14.2.1.2. South Africa 14.2.1.3. Israel 14.2.1.4. Rest of Middle East and Africa 14.2.2. By Ingredient 14.2.3. By Application 14.3. Market Attractiveness Analysis 14.3.1. By Country 14.3.2. By Ingredient 14.3.3. By Application 14.4. Key Takeaways 15. Key Countries Market Analysis 15.1. United States 15.1.1. Pricing Analysis 15.1.2. Market Share Analysis, 2022 15.1.2.1. By Ingredient 15.1.2.2. By Application 15.2. Canada 15.2.1. Pricing Analysis 15.2.2. Market Share Analysis, 2022 15.2.2.1. By Ingredient 15.2.2.2. By Application 15.3. Brazil 15.3.1. Pricing Analysis 15.3.2. Market Share Analysis, 2022 15.3.2.1. By Ingredient 15.3.2.2. By Application 15.4. Mexico 15.4.1. Pricing Analysis 15.4.2. Market Share Analysis, 2022 15.4.2.1. By Ingredient 15.4.2.2. By Application 15.5. Germany 15.5.1. Pricing Analysis 15.5.2. Market Share Analysis, 2022 15.5.2.1. By Ingredient 15.5.2.2. By Application 15.6. United Kingdom 15.6.1. Pricing Analysis 15.6.2. Market Share Analysis, 2022 15.6.2.1. By Ingredient 15.6.2.2. By Application 15.7. France 15.7.1. Pricing Analysis 15.7.2. Market Share Analysis, 2022 15.7.2.1. By Ingredient 15.7.2.2. By Application 15.8. Spain 15.8.1. Pricing Analysis 15.8.2. Market Share Analysis, 2022 15.8.2.1. By Ingredient 15.8.2.2. By Application 15.9. Italy 15.9.1. Pricing Analysis 15.9.2. Market Share Analysis, 2022 15.9.2.1. By Ingredient 15.9.2.2. By Application 15.10. Poland 15.10.1. Pricing Analysis 15.10.2. Market Share Analysis, 2022 15.10.2.1. By Ingredient 15.10.2.2. By Application 15.11. Russia 15.11.1. Pricing Analysis 15.11.2. Market Share Analysis, 2022 15.11.2.1. By Ingredient 15.11.2.2. By Application 15.12. Czech Republic 15.12.1. Pricing Analysis 15.12.2. Market Share Analysis, 2022 15.12.2.1. By Ingredient 15.12.2.2. By Application 15.13. Romania 15.13.1. Pricing Analysis 15.13.2. Market Share Analysis, 2022 15.13.2.1. By Ingredient 15.13.2.2. By Application 15.14. India 15.14.1. Pricing Analysis 15.14.2. Market Share Analysis, 2022 15.14.2.1. By Ingredient 15.14.2.2. By Application 15.15. Bangladesh 15.15.1. Pricing Analysis 15.15.2. Market Share Analysis, 2022 15.15.2.1. By Ingredient 15.15.2.2. By Application 15.16. Australia 15.16.1. Pricing Analysis 15.16.2. Market Share Analysis, 2022 15.16.2.1. By Ingredient 15.16.2.2. By Application 15.17. New Zealand 15.17.1. Pricing Analysis 15.17.2. Market Share Analysis, 2022 15.17.2.1. By Ingredient 15.17.2.2. By Application 15.18. China 15.18.1. Pricing Analysis 15.18.2. Market Share Analysis, 2022 15.18.2.1. By Ingredient 15.18.2.2. By Application 15.19. Japan 15.19.1. Pricing Analysis 15.19.2. Market Share Analysis, 2022 15.19.2.1. By Ingredient 15.19.2.2. By Application 15.20. South Korea 15.20.1. Pricing Analysis 15.20.2. Market Share Analysis, 2022 15.20.2.1. By Ingredient 15.20.2.2. By Application 15.21. GCC Countries 15.21.1. Pricing Analysis 15.21.2. Market Share Analysis, 2022 15.21.2.1. By Ingredient 15.21.2.2. By Application 15.22. South Africa 15.22.1. Pricing Analysis 15.22.2. Market Share Analysis, 2022 15.22.2.1. By Ingredient 15.22.2.2. By Application 15.23. Israel 15.23.1. Pricing Analysis 15.23.2. Market Share Analysis, 2022 15.23.2.1. By Ingredient 15.23.2.2. By Application 16. Market Structure Analysis 16.1. Competition Dashboard 16.2. Competition Benchmarking 16.3. Market Share Analysis of Top Players 16.3.1. By Regional 16.3.2. By Ingredient 16.3.3. By Application 17. Competition Analysis 17.1. Competition Deep Dive 17.1.1. Nutriad Inc 17.1.1.1. Overview 17.1.1.2. Product Portfolio 17.1.1.3. Profitability by Market Segments 17.1.1.4. Sales Footprint 17.1.1.5. Strategy Overview 17.1.1.5.1. Marketing Strategy 17.1.1.5.2. Product Strategy 17.1.1.5.3. Channel Strategy 17.1.2. Alltech 17.1.2.1. Overview 17.1.2.2. Product Portfolio 17.1.2.3. Profitability by Market Segments 17.1.2.4. Sales Footprint 17.1.2.5. Strategy Overview 17.1.2.5.1. Marketing Strategy 17.1.2.5.2. Product Strategy 17.1.2.5.3. Channel Strategy 17.1.3. Olmix Group 17.1.3.1. Overview 17.1.3.2. Product Portfolio 17.1.3.3. Profitability by Market Segments 17.1.3.4. Sales Footprint 17.1.3.5. Strategy Overview 17.1.3.5.1. Marketing Strategy 17.1.3.5.2. Product Strategy 17.1.3.5.3. Channel Strategy 17.1.4. Nouryon 17.1.4.1. Overview 17.1.4.2. Product Portfolio 17.1.4.3. Profitability by Market Segments 17.1.4.4. Sales Footprint 17.1.4.5. Strategy Overview 17.1.4.5.1. Marketing Strategy 17.1.4.5.2. Product Strategy 17.1.4.5.3. Channel Strategy 17.1.5. DuPont de Nemours Inc. 17.1.5.1. Overview 17.1.5.2. Product Portfolio 17.1.5.3. Profitability by Market Segments 17.1.5.4. Sales Footprint 17.1.5.5. Strategy Overview 17.1.5.5.1. Marketing Strategy 17.1.5.5.2. Product Strategy 17.1.5.5.3. Channel Strategy 17.1.6. Lallemand Inc. 17.1.6.1. Overview 17.1.6.2. Product Portfolio 17.1.6.3. Profitability by Market Segments 17.1.6.4. Sales Footprint 17.1.6.5. Strategy Overview 17.1.6.5.1. Marketing Strategy 17.1.6.5.2. Product Strategy 17.1.6.5.3. Channel Strategy 17.1.7. AKER BIO MARINE 17.1.7.1. Overview 17.1.7.2. Product Portfolio 17.1.7.3. Profitability by Market Segments 17.1.7.4. Sales Footprint 17.1.7.5. Strategy Overview 17.1.7.5.1. Marketing Strategy 17.1.7.5.2. Product Strategy 17.1.7.5.3. Channel Strategy 17.1.8. Diana Group 17.1.8.1. Overview 17.1.8.2. Product Portfolio 17.1.8.3. Profitability by Market Segments 17.1.8.4. Sales Footprint 17.1.8.5. Strategy Overview 17.1.8.5.1. Marketing Strategy 17.1.8.5.2. Product Strategy 17.1.8.5.3. Channel Strategy 17.1.9. Delacon Biotechnik GmbH 17.1.9.1. Overview 17.1.9.2. Product Portfolio 17.1.9.3. Profitability by Market Segments 17.1.9.4. Sales Footprint 17.1.9.5. Strategy Overview 17.1.9.5.1. Marketing Strategy 17.1.9.5.2. Product Strategy 17.1.9.5.3. Channel Strategy 17.1.10. Calmin Fine Sciences Inc. 17.1.10.1. Overview 17.1.10.2. Product Portfolio 17.1.10.3. Profitability by Market Segments 17.1.10.4. Sales Footprint 17.1.10.5. Strategy Overview 17.1.10.5.1. Marketing Strategy 17.1.10.5.2. Product Strategy 17.1.10.5.3. Channel Strategy 17.1.11. Calanua AS 17.1.11.1. Overview 17.1.11.2. Product Portfolio 17.1.11.3. Profitability by Market Segments 17.1.11.4. Sales Footprint 17.1.11.5. Strategy Overview 17.1.11.5.1. Marketing Strategy 17.1.11.5.2. Product Strategy 17.1.11.5.3. Channel Strategy 17.1.12. Kemin Industries Inc. 17.1.12.1. Overview 17.1.12.2. Product Portfolio 17.1.12.3. Profitability by Market Segments 17.1.12.4. Sales Footprint 17.1.12.5. Strategy Overview 17.1.12.5.1. Marketing Strategy 17.1.12.5.2. Product Strategy 17.1.12.5.3. Channel Strategy 17.1.13. Biorigin 17.1.13.1. Overview 17.1.13.2. Product Portfolio 17.1.13.3. Profitability by Market Segments 17.1.13.4. Sales Footprint 17.1.13.5. Strategy Overview 17.1.13.5.1. Marketing Strategy 17.1.13.5.2. Product Strategy 17.1.13.5.3. Channel Strategy 17.1.14. Phileo by Lesaffre 17.1.14.1. Overview 17.1.14.2. Product Portfolio 17.1.14.3. Profitability by Market Segments 17.1.14.4. Sales Footprint 17.1.14.5. Strategy Overview 17.1.14.5.1. Marketing Strategy 17.1.14.5.2. Product Strategy 17.1.14.5.3. Channel Strategy 18. Assumptions & Acronyms Used 19. Research Methodology
Don't pay for what you don't need
Customize your report by selecting specific countries or regions and save 30%!
Table 1: Global Market Value (US$ Million) Forecast by Region, 2018 to 2033 Table 2: Global Market Volume (Tons) Forecast by Region, 2018 to 2033 Table 3: Global Market Value (US$ Million) Forecast by Ingredient, 2018 to 2033 Table 4: Global Market Volume (Tons) Forecast by Ingredient, 2018 to 2033 Table 5: Global Market Value (US$ Million) Forecast by Application, 2018 to 2033 Table 6: Global Market Volume (Tons) Forecast by Application, 2018 to 2033 Table 7: North America Market Value (US$ Million) Forecast by Country, 2018 to 2033 Table 8: North America Market Volume (Tons) Forecast by Country, 2018 to 2033 Table 9: North America Market Value (US$ Million) Forecast by Ingredient, 2018 to 2033 Table 10: North America Market Volume (Tons) Forecast by Ingredient, 2018 to 2033 Table 11: North America Market Value (US$ Million) Forecast by Application, 2018 to 2033 Table 12: North America Market Volume (Tons) Forecast by Application, 2018 to 2033 Table 13: Latin America Market Value (US$ Million) Forecast by Country, 2018 to 2033 Table 14: Latin America Market Volume (Tons) Forecast by Country, 2018 to 2033 Table 15: Latin America Market Value (US$ Million) Forecast by Ingredient, 2018 to 2033 Table 16: Latin America Market Volume (Tons) Forecast by Ingredient, 2018 to 2033 Table 17: Latin America Market Value (US$ Million) Forecast by Application, 2018 to 2033 Table 18: Latin America Market Volume (Tons) Forecast by Application, 2018 to 2033 Table 19: Western Europe Market Value (US$ Million) Forecast by Country, 2018 to 2033 Table 20: Western Europe Market Volume (Tons) Forecast by Country, 2018 to 2033 Table 21: Western Europe Market Value (US$ Million) Forecast by Ingredient, 2018 to 2033 Table 22: Western Europe Market Volume (Tons) Forecast by Ingredient, 2018 to 2033 Table 23: Western Europe Market Value (US$ Million) Forecast by Application, 2018 to 2033 Table 24: Western Europe Market Volume (Tons) Forecast by Application, 2018 to 2033 Table 25: Eastern Europe Market Value (US$ Million) Forecast by Country, 2018 to 2033 Table 26: Eastern Europe Market Volume (Tons) Forecast by Country, 2018 to 2033 Table 27: Eastern Europe Market Value (US$ Million) Forecast by Ingredient, 2018 to 2033 Table 28: Eastern Europe Market Volume (Tons) Forecast by Ingredient, 2018 to 2033 Table 29: Eastern Europe Market Value (US$ Million) Forecast by Application, 2018 to 2033 Table 30: Eastern Europe Market Volume (Tons) Forecast by Application, 2018 to 2033 Table 31: South Asia and Pacific Market Value (US$ Million) Forecast by Country, 2018 to 2033 Table 32: South Asia and Pacific Market Volume (Tons) Forecast by Country, 2018 to 2033 Table 33: South Asia and Pacific Market Value (US$ Million) Forecast by Ingredient, 2018 to 2033 Table 34: South Asia and Pacific Market Volume (Tons) Forecast by Ingredient, 2018 to 2033 Table 35: South Asia and Pacific Market Value (US$ Million) Forecast by Application, 2018 to 2033 Table 36: South Asia and Pacific Market Volume (Tons) Forecast by Application, 2018 to 2033 Table 37: East Asia Market Value (US$ Million) Forecast by Country, 2018 to 2033 Table 38: East Asia Market Volume (Tons) Forecast by Country, 2018 to 2033 Table 39: East Asia Market Value (US$ Million) Forecast by Ingredient, 2018 to 2033 Table 40: East Asia Market Volume (Tons) Forecast by Ingredient, 2018 to 2033 Table 41: East Asia Market Value (US$ Million) Forecast by Application, 2018 to 2033 Table 42: East Asia Market Volume (Tons) Forecast by Application, 2018 to 2033 Table 43: Middle East and Africa Market Value (US$ Million) Forecast by Country, 2018 to 2033 Table 44: Middle East and Africa Market Volume (Tons) Forecast by Country, 2018 to 2033 Table 45: Middle East and Africa Market Value (US$ Million) Forecast by Ingredient, 2018 to 2033 Table 46: Middle East and Africa Market Volume (Tons) Forecast by Ingredient, 2018 to 2033 Table 47: Middle East and Africa Market Value (US$ Million) Forecast by Application, 2018 to 2033 Table 48: Middle East and Africa Market Volume (Tons) Forecast by Application, 2018 to 2033
Figure 1: Global Market Value (US$ Million) by Ingredient, 2023 to 2033 Figure 2: Global Market Value (US$ Million) by Application, 2023 to 2033 Figure 3: Global Market Value (US$ Million) by Region, 2023 to 2033 Figure 4: Global Market Value (US$ Million) Analysis by Region, 2018 to 2033 Figure 5: Global Market Volume (Tons) Analysis by Region, 2018 to 2033 Figure 6: Global Market Value Share (%) and BPS Analysis by Region, 2023 to 2033 Figure 7: Global Market Y-o-Y Growth (%) Projections by Region, 2023 to 2033 Figure 8: Global Market Value (US$ Million) Analysis by Ingredient, 2018 to 2033 Figure 9: Global Market Volume (Tons) Analysis by Ingredient, 2018 to 2033 Figure 10: Global Market Value Share (%) and BPS Analysis by Ingredient, 2023 to 2033 Figure 11: Global Market Y-o-Y Growth (%) Projections by Ingredient, 2023 to 2033 Figure 12: Global Market Value (US$ Million) Analysis by Application, 2018 to 2033 Figure 13: Global Market Volume (Tons) Analysis by Application, 2018 to 2033 Figure 14: Global Market Value Share (%) and BPS Analysis by Application, 2023 to 2033 Figure 15: Global Market Y-o-Y Growth (%) Projections by Application, 2023 to 2033 Figure 16: Global Market Attractiveness by Ingredient, 2023 to 2033 Figure 17: Global Market Attractiveness by Application, 2023 to 2033 Figure 18: Global Market Attractiveness by Region, 2023 to 2033 Figure 19: North America Market Value (US$ Million) by Ingredient, 2023 to 2033 Figure 20: North America Market Value (US$ Million) by Application, 2023 to 2033 Figure 21: North America Market Value (US$ Million) by Country, 2023 to 2033 Figure 22: North America Market Value (US$ Million) Analysis by Country, 2018 to 2033 Figure 23: North America Market Volume (Tons) Analysis by Country, 2018 to 2033 Figure 24: North America Market Value Share (%) and BPS Analysis by Country, 2023 to 2033 Figure 25: North America Market Y-o-Y Growth (%) Projections by Country, 2023 to 2033 Figure 26: North America Market Value (US$ Million) Analysis by Ingredient, 2018 to 2033 Figure 27: North America Market Volume (Tons) Analysis by Ingredient, 2018 to 2033 Figure 28: North America Market Value Share (%) and BPS Analysis by Ingredient, 2023 to 2033 Figure 29: North America Market Y-o-Y Growth (%) Projections by Ingredient, 2023 to 2033 Figure 30: North America Market Value (US$ Million) Analysis by Application, 2018 to 2033 Figure 31: North America Market Volume (Tons) Analysis by Application, 2018 to 2033 Figure 32: North America Market Value Share (%) and BPS Analysis by Application, 2023 to 2033 Figure 33: North America Market Y-o-Y Growth (%) Projections by Application, 2023 to 2033 Figure 34: North America Market Attractiveness by Ingredient, 2023 to 2033 Figure 35: North America Market Attractiveness by Application, 2023 to 2033 Figure 36: North America Market Attractiveness by Country, 2023 to 2033 Figure 37: Latin America Market Value (US$ Million) by Ingredient, 2023 to 2033 Figure 38: Latin America Market Value (US$ Million) by Application, 2023 to 2033 Figure 39: Latin America Market Value (US$ Million) by Country, 2023 to 2033 Figure 40: Latin America Market Value (US$ Million) Analysis by Country, 2018 to 2033 Figure 41: Latin America Market Volume (Tons) Analysis by Country, 2018 to 2033 Figure 42: Latin America Market Value Share (%) and BPS Analysis by Country, 2023 to 2033 Figure 43: Latin America Market Y-o-Y Growth (%) Projections by Country, 2023 to 2033 Figure 44: Latin America Market Value (US$ Million) Analysis by Ingredient, 2018 to 2033 Figure 45: Latin America Market Volume (Tons) Analysis by Ingredient, 2018 to 2033 Figure 46: Latin America Market Value Share (%) and BPS Analysis by Ingredient, 2023 to 2033 Figure 47: Latin America Market Y-o-Y Growth (%) Projections by Ingredient, 2023 to 2033 Figure 48: Latin America Market Value (US$ Million) Analysis by Application, 2018 to 2033 Figure 49: Latin America Market Volume (Tons) Analysis by Application, 2018 to 2033 Figure 50: Latin America Market Value Share (%) and BPS Analysis by Application, 2023 to 2033 Figure 51: Latin America Market Y-o-Y Growth (%) Projections by Application, 2023 to 2033 Figure 52: Latin America Market Attractiveness by Ingredient, 2023 to 2033 Figure 53: Latin America Market Attractiveness by Application, 2023 to 2033 Figure 54: Latin America Market Attractiveness by Country, 2023 to 2033 Figure 55: Western Europe Market Value (US$ Million) by Ingredient, 2023 to 2033 Figure 56: Western Europe Market Value (US$ Million) by Application, 2023 to 2033 Figure 57: Western Europe Market Value (US$ Million) by Country, 2023 to 2033 Figure 58: Western Europe Market Value (US$ Million) Analysis by Country, 2018 to 2033 Figure 59: Western Europe Market Volume (Tons) Analysis by Country, 2018 to 2033 Figure 60: Western Europe Market Value Share (%) and BPS Analysis by Country, 2023 to 2033 Figure 61: Western Europe Market Y-o-Y Growth (%) Projections by Country, 2023 to 2033 Figure 62: Western Europe Market Value (US$ Million) Analysis by Ingredient, 2018 to 2033 Figure 63: Western Europe Market Volume (Tons) Analysis by Ingredient, 2018 to 2033 Figure 64: Western Europe Market Value Share (%) and BPS Analysis by Ingredient, 2023 to 2033 Figure 65: Western Europe Market Y-o-Y Growth (%) Projections by Ingredient, 2023 to 2033 Figure 66: Western Europe Market Value (US$ Million) Analysis by Application, 2018 to 2033 Figure 67: Western Europe Market Volume (Tons) Analysis by Application, 2018 to 2033 Figure 68: Western Europe Market Value Share (%) and BPS Analysis by Application, 2023 to 2033 Figure 69: Western Europe Market Y-o-Y Growth (%) Projections by Application, 2023 to 2033 Figure 70: Western Europe Market Attractiveness by Ingredient, 2023 to 2033 Figure 71: Western Europe Market Attractiveness by Application, 2023 to 2033 Figure 72: Western Europe Market Attractiveness by Country, 2023 to 2033 Figure 73: Eastern Europe Market Value (US$ Million) by Ingredient, 2023 to 2033 Figure 74: Eastern Europe Market Value (US$ Million) by Application, 2023 to 2033 Figure 75: Eastern Europe Market Value (US$ Million) by Country, 2023 to 2033 Figure 76: Eastern Europe Market Value (US$ Million) Analysis by Country, 2018 to 2033 Figure 77: Eastern Europe Market Volume (Tons) Analysis by Country, 2018 to 2033 Figure 78: Eastern Europe Market Value Share (%) and BPS Analysis by Country, 2023 to 2033 Figure 79: Eastern Europe Market Y-o-Y Growth (%) Projections by Country, 2023 to 2033 Figure 80: Eastern Europe Market Value (US$ Million) Analysis by Ingredient, 2018 to 2033 Figure 81: Eastern Europe Market Volume (Tons) Analysis by Ingredient, 2018 to 2033 Figure 82: Eastern Europe Market Value Share (%) and BPS Analysis by Ingredient, 2023 to 2033 Figure 83: Eastern Europe Market Y-o-Y Growth (%) Projections by Ingredient, 2023 to 2033 Figure 84: Eastern Europe Market Value (US$ Million) Analysis by Application, 2018 to 2033 Figure 85: Eastern Europe Market Volume (Tons) Analysis by Application, 2018 to 2033 Figure 86: Eastern Europe Market Value Share (%) and BPS Analysis by Application, 2023 to 2033 Figure 87: Eastern Europe Market Y-o-Y Growth (%) Projections by Application, 2023 to 2033 Figure 88: Eastern Europe Market Attractiveness by Ingredient, 2023 to 2033 Figure 89: Eastern Europe Market Attractiveness by Application, 2023 to 2033 Figure 90: Eastern Europe Market Attractiveness by Country, 2023 to 2033 Figure 91: South Asia and Pacific Market Value (US$ Million) by Ingredient, 2023 to 2033 Figure 92: South Asia and Pacific Market Value (US$ Million) by Application, 2023 to 2033 Figure 93: South Asia and Pacific Market Value (US$ Million) by Country, 2023 to 2033 Figure 94: South Asia and Pacific Market Value (US$ Million) Analysis by Country, 2018 to 2033 Figure 95: South Asia and Pacific Market Volume (Tons) Analysis by Country, 2018 to 2033 Figure 96: South Asia and Pacific Market Value Share (%) and BPS Analysis by Country, 2023 to 2033 Figure 97: South Asia and Pacific Market Y-o-Y Growth (%) Projections by Country, 2023 to 2033 Figure 98: South Asia and Pacific Market Value (US$ Million) Analysis by Ingredient, 2018 to 2033 Figure 99: South Asia and Pacific Market Volume (Tons) Analysis by Ingredient, 2018 to 2033 Figure 100: South Asia and Pacific Market Value Share (%) and BPS Analysis by Ingredient, 2023 to 2033 Figure 101: South Asia and Pacific Market Y-o-Y Growth (%) Projections by Ingredient, 2023 to 2033 Figure 102: South Asia and Pacific Market Value (US$ Million) Analysis by Application, 2018 to 2033 Figure 103: South Asia and Pacific Market Volume (Tons) Analysis by Application, 2018 to 2033 Figure 104: South Asia and Pacific Market Value Share (%) and BPS Analysis by Application, 2023 to 2033 Figure 105: South Asia and Pacific Market Y-o-Y Growth (%) Projections by Application, 2023 to 2033 Figure 106: South Asia and Pacific Market Attractiveness by Ingredient, 2023 to 2033 Figure 107: South Asia and Pacific Market Attractiveness by Application, 2023 to 2033 Figure 108: South Asia and Pacific Market Attractiveness by Country, 2023 to 2033 Figure 109: East Asia Market Value (US$ Million) by Ingredient, 2023 to 2033 Figure 110: East Asia Market Value (US$ Million) by Application, 2023 to 2033 Figure 111: East Asia Market Value (US$ Million) by Country, 2023 to 2033 Figure 112: East Asia Market Value (US$ Million) Analysis by Country, 2018 to 2033 Figure 113: East Asia Market Volume (Tons) Analysis by Country, 2018 to 2033 Figure 114: East Asia Market Value Share (%) and BPS Analysis by Country, 2023 to 2033 Figure 115: East Asia Market Y-o-Y Growth (%) Projections by Country, 2023 to 2033 Figure 116: East Asia Market Value (US$ Million) Analysis by Ingredient, 2018 to 2033 Figure 117: East Asia Market Volume (Tons) Analysis by Ingredient, 2018 to 2033 Figure 118: East Asia Market Value Share (%) and BPS Analysis by Ingredient, 2023 to 2033 Figure 119: East Asia Market Y-o-Y Growth (%) Projections by Ingredient, 2023 to 2033 Figure 120: East Asia Market Value (US$ Million) Analysis by Application, 2018 to 2033 Figure 121: East Asia Market Volume (Tons) Analysis by Application, 2018 to 2033 Figure 122: East Asia Market Value Share (%) and BPS Analysis by Application, 2023 to 2033 Figure 123: East Asia Market Y-o-Y Growth (%) Projections by Application, 2023 to 2033 Figure 124: East Asia Market Attractiveness by Ingredient, 2023 to 2033 Figure 125: East Asia Market Attractiveness by Application, 2023 to 2033 Figure 126: East Asia Market Attractiveness by Country, 2023 to 2033 Figure 127: Middle East and Africa Market Value (US$ Million) by Ingredient, 2023 to 2033 Figure 128: Middle East and Africa Market Value (US$ Million) by Application, 2023 to 2033 Figure 129: Middle East and Africa Market Value (US$ Million) by Country, 2023 to 2033 Figure 130: Middle East and Africa Market Value (US$ Million) Analysis by Country, 2018 to 2033 Figure 131: Middle East and Africa Market Volume (Tons) Analysis by Country, 2018 to 2033 Figure 132: Middle East and Africa Market Value Share (%) and BPS Analysis by Country, 2023 to 2033 Figure 133: Middle East and Africa Market Y-o-Y Growth (%) Projections by Country, 2023 to 2033 Figure 134: Middle East and Africa Market Value (US$ Million) Analysis by Ingredient, 2018 to 2033 Figure 135: Middle East and Africa Market Volume (Tons) Analysis by Ingredient, 2018 to 2033 Figure 136: Middle East and Africa Market Value Share (%) and BPS Analysis by Ingredient, 2023 to 2033 Figure 137: Middle East and Africa Market Y-o-Y Growth (%) Projections by Ingredient, 2023 to 2033 Figure 138: Middle East and Africa Market Value (US$ Million) Analysis by Application, 2018 to 2033 Figure 139: Middle East and Africa Market Volume (Tons) Analysis by Application, 2018 to 2033 Figure 140: Middle East and Africa Market Value Share (%) and BPS Analysis by Application, 2023 to 2033 Figure 141: Middle East and Africa Market Y-o-Y Growth (%) Projections by Application, 2023 to 2033 Figure 142: Middle East and Africa Market Attractiveness by Ingredient, 2023 to 2033 Figure 143: Middle East and Africa Market Attractiveness by Application, 2023 to 2033 Figure 144: Middle East and Africa Market Attractiveness by Country, 2023 to 2033
Recommendations
Explore Food and Beverage Insights
View Reports